| Aquifers & Reclamation | Geothermal & Earthquakes | Mining & Critical Minerals | Oil & Gas | Origins | Patents | Projects | Technology |
![]()
Definitions:
|
 |
Frequently Asked Questions | Background Lightning Image |
| SECTION | PROJECT | EXAMPLE | PROJECT DESCRIPTION | |
| Aquifers & Reclamation | Geomorphology | 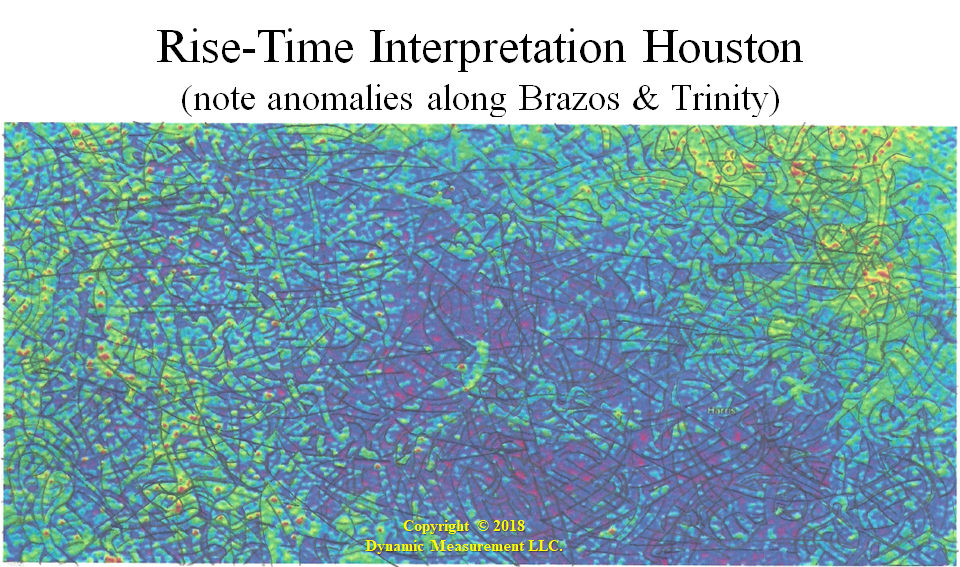 |
When Dynamic Measurement first started, we had the ability to make maps. Chief Geologist Kathy Haggar looked at maps from early projects and recognized there was a lot information on these maps. This set of images shows how Kathy was able to derive shallow geomorphology from different lightning attribute maps. Note how the high Rise-Times on this map follow the Brazos & Trinity Rivers, from this early lightning analysis project in the Houston, Texas area. Details in links to left. | |
| Aquifers & Reclamation | Hildale |  |
This 2019 project was our first water exploration. Dynamic was a subcontracor to Willowstick Technologies, working for for the city of Hildale, Utah in the deserts of Southern Utah. COVID-19 has delayed the first water well. The second Willowstick project is currently being negotiated with the City of Enoch, Utah. The successful results shown at the Hildale link to the left brings up an animation file stepping through the calcualted apparent resistivity volume without and with faults. | |
| Aquifers & Reclamation | Barite Hills, South Carolina | 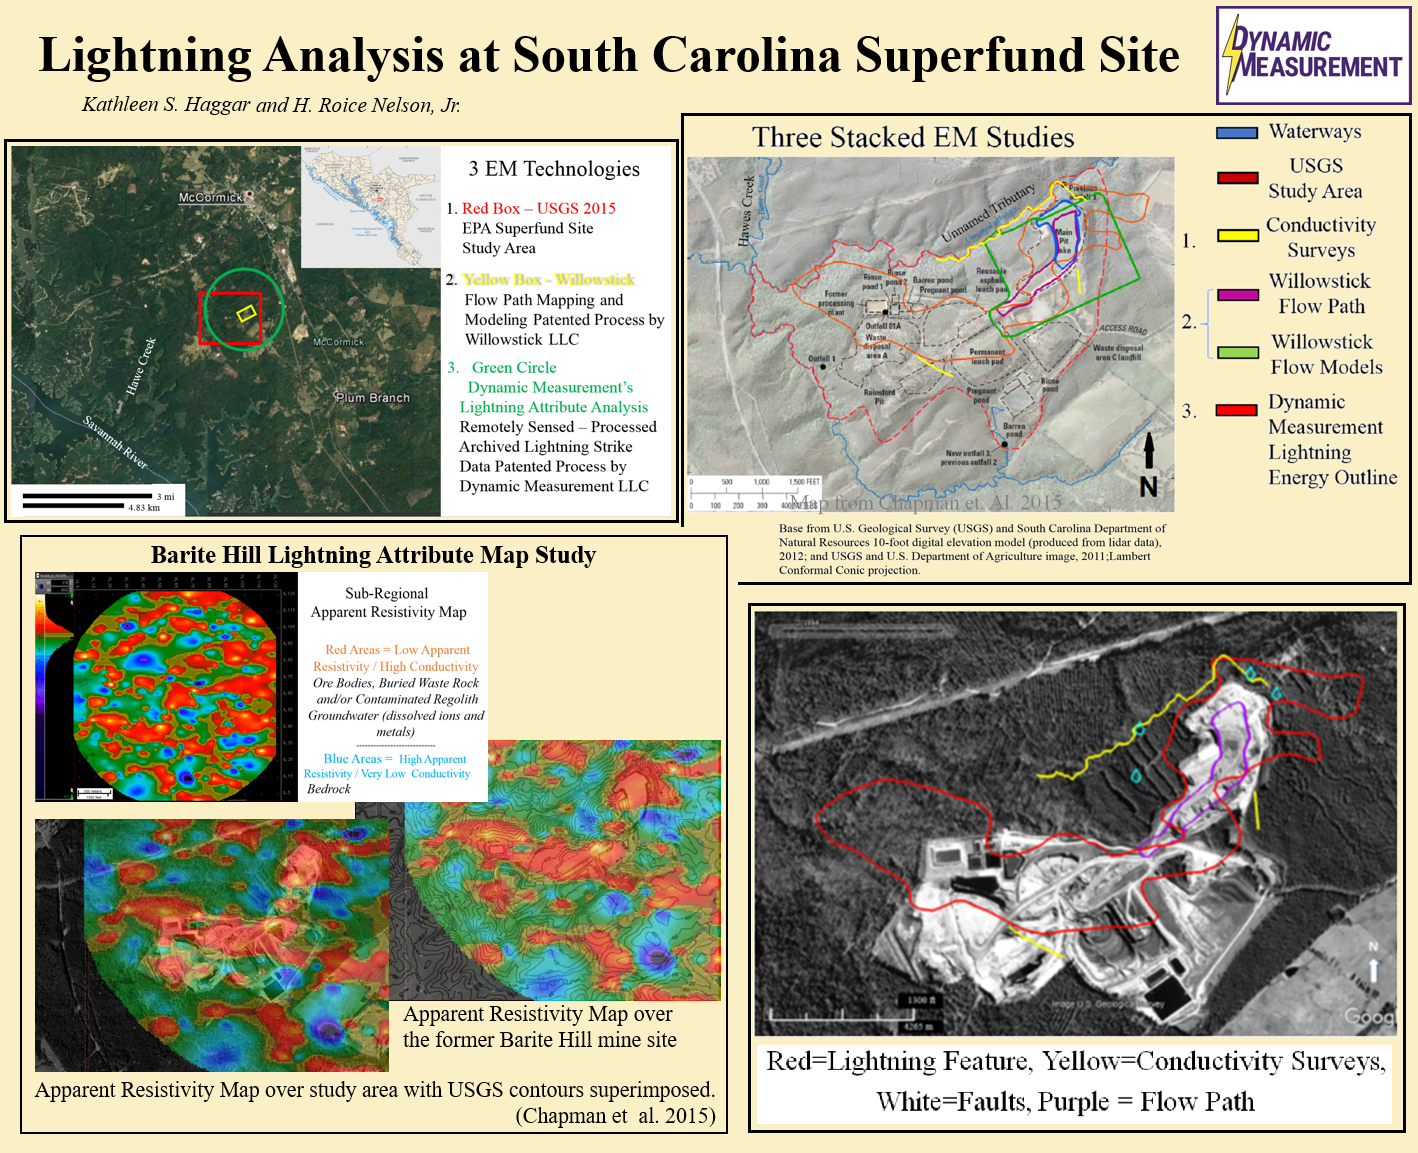 |
The Nevada Gold Fields, Inc. - now closed Barite Hill Gold Mine Project site - was one of four major mines in the South Carolina Slate Belt. It produced gold, silver and other minerals from 1991 to 1999. Ore was extracted from an open pit, crushed, treated, spread on leach pads, then sprayed with a cyanide solution to dissolve the gold. Barite Hill was Dynamic Measurement, LLC’s initial study projecting lightning strike data to the surface. The much earlier apparent resistivity surveys closely matched the apparent resistivity patterns from lightning data. The overlays of modeled flow path patterns closely resembled the attributes of lightning - Energy, Peak Current Absolute, and Apparent Resistivity - in the study area. | |
| Geothermal & Earthquakes | South Utah |  |
The South Utah link to the left connects to an animation file generated from lightning analysis results. The client had a lease, which had to be worked on for the BLM (Bureau of Land Management) to continue the lease. The report fulfilled BLM requirements and sparked a lot of interest. The first well was successful. The lightning anysis project showed faults were not just into the basin, rather they were strike-slip faults. This explained geological anomalies associated with this site. The animation shows dip cross-sections without and with fault interpretation, and 3D views or results. | |
| Geothermal & Earthquakes | Cushing, Oklahoma |  |
The animation link at 'Cushing, Oklahoma', shows a time-lapse apparent resistivity study. The project is over the location of an earthquake attributed to water reinjection. Dynamic has found we need about 3-years of lightning data to get reliable results. So we made a sweries of 3-year lightning derived resistivity volumes, and step through them. The idea is that as water is injected, it builds up pressure, pushes rock particles closer together, and increases conductivity. Our contact resigned as Oklahoma State Geologist, and we have not finished finding out if this approach can be used to predict earthquakes. | |
| Mining & Critical Minerals |
Humboldt County, Nevada |  |
The Humboldt County project defined a series of down to the basin faults, up which intrusive and highly resistive rhyolite domes are believed to followed. These intrusions bought hydrothermal fluids, which deposited significant gold and silver and critical minerals in the Sleeper Mine just to the north. The animation file to the left shows apprent resistivity cross-sections stepping through the volume orthogonally to the faults and showing several high apparent resistivity anomalies on the downside of of the faults. The animation steps throuh raw data and through an overlaid fault interpretation. | |
| Mining & Critical Minerals |
Resolution Copper | 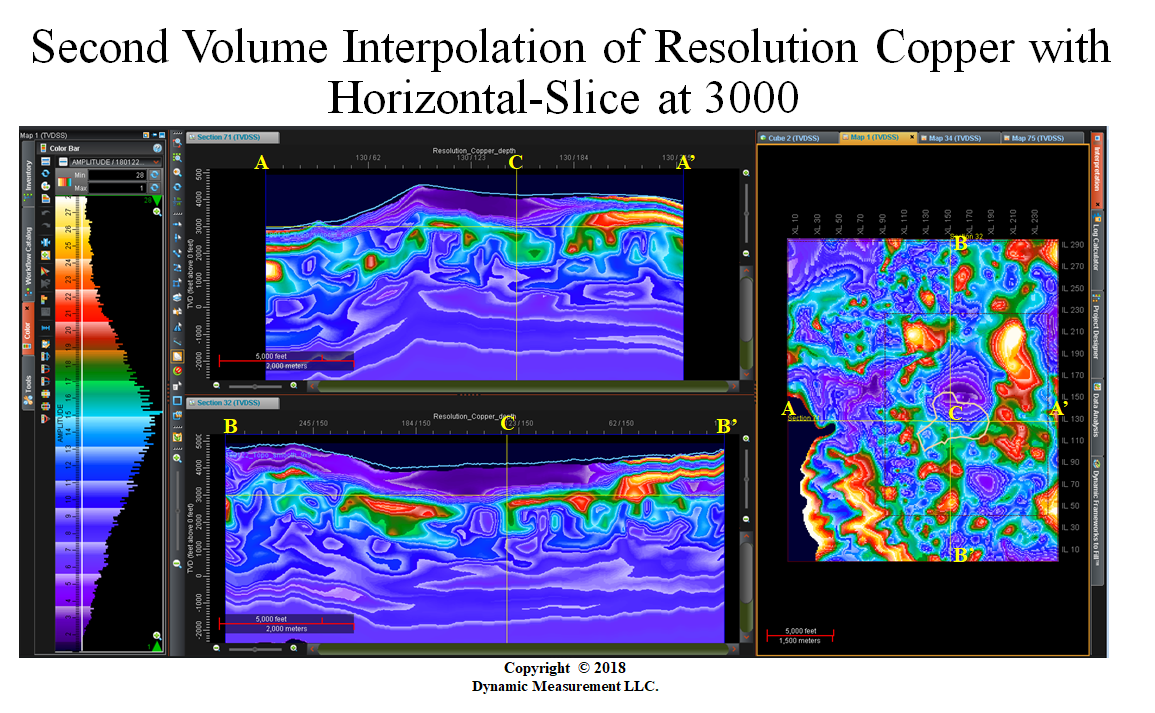 |
Resolution Copper is one of the largest new copper mines in the world. The mine is in the mountains just east of Superior, Arizona. The image linked to the left from 'Resolution Copper" shows a north-south and an east-west apparent resistivity cross-section, as well as a horizontal-slice. We recognized with this project our lighting maps and volumes are showing halos around copper deposits. The outline of the mine was provided by a consultant. The high apparent resistivty halo is just to the north of the mine location. We were able to integrate confidential control from the mine owner as part of this project. | |
| Mining & Critical Minerals |
Western Desert, AZ | 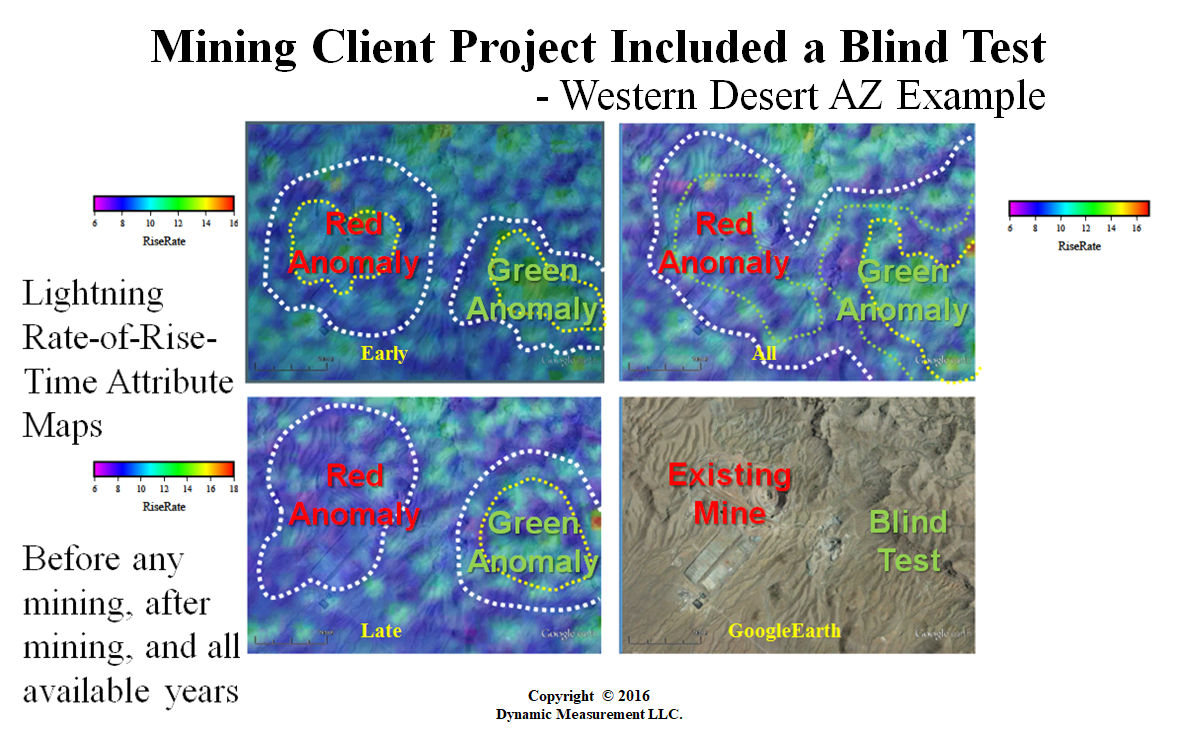 |
Another early lightning analysis project in a mountanous area in a Western Desert of Arizona with between 1-3 lightning strikes per square kilometer per year, compared to 10-14 strikes per square kilometer in Louisiana. The initial results did not look good. We realized by applying a topographic static correction processed data, results were more realistic. There was client concern electrical infrastructure at an existing mine would skew results. We processed volumes before and after mining started. Results were excellent (Red Anomaly), and client had a drilled discovery blind test (Green Anomaly). | |
| Mining & Critical Minerals |
Blackhawk | 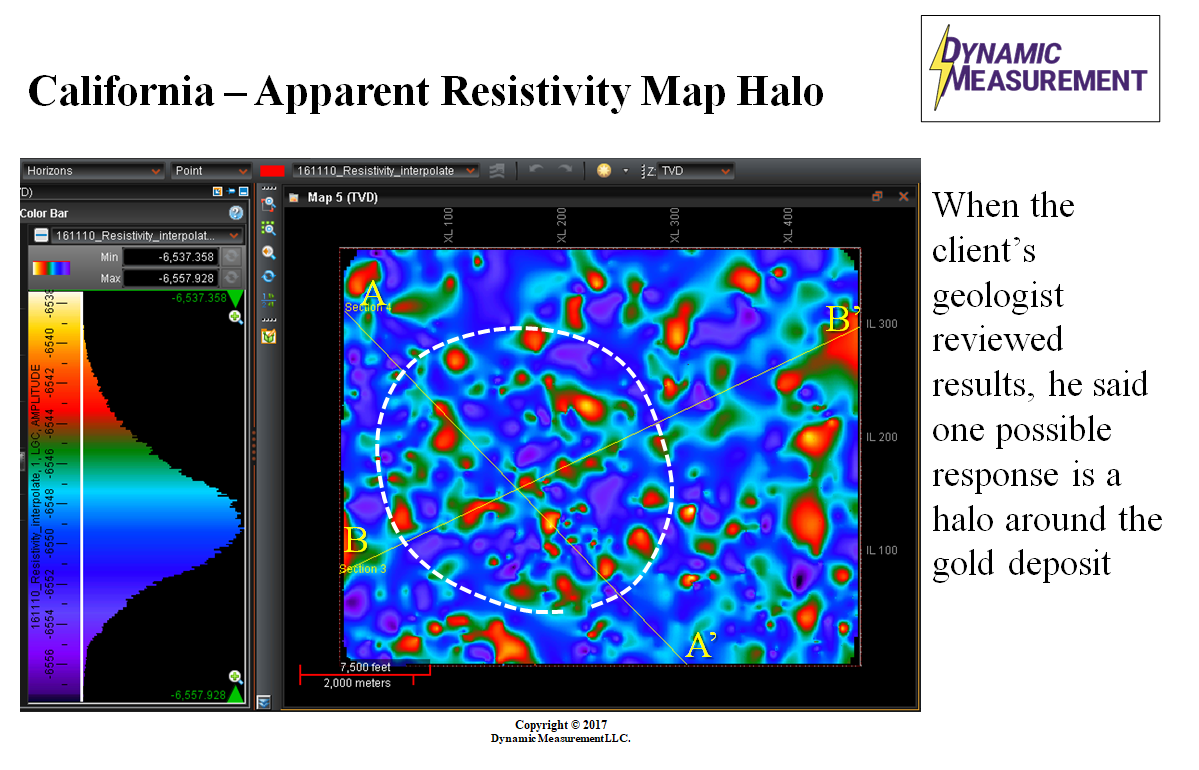 |
Blackhawk is a project in the Mojave Desert in San bernardino County, California where there are 0.1-0.5 lightning strikes per square kilometer per year. Since geology and related telluric currents do not change over 20 year time-frames, even though each new storm is unique, the lightning data can be stacked to improve signal and supress noise. So over 20 years, this becomes 2-10 strikes per square kilometer. Results were fascinating. The abandoned Blackhawk Mine is right at the center of an Apparent Resistivity Map Halo, as shown on the map that comes up from the link to Blackhawk on the left. | |
| Oil & Gas | Stratton |  |
The Bureau of Economic Geology (BEG) of UT Austin released seismic and shallow well data across the Stratton Field. Dynamic did a regional test study here. Note any portion of the regional analysis in the South Texas example below can be dislayed at the same resolution as shown in the animation linked from the word Stratton on the left. This animation steps through 27 dip resistivity cross-sections through the seismic, with fault interpretation and shallow wells shown, and then shows 9 strike sections. Vicksberg expansion fault matches both seismic and overlaid semi-transparent resistivity. | |
| Oil & Gas | South Texas | 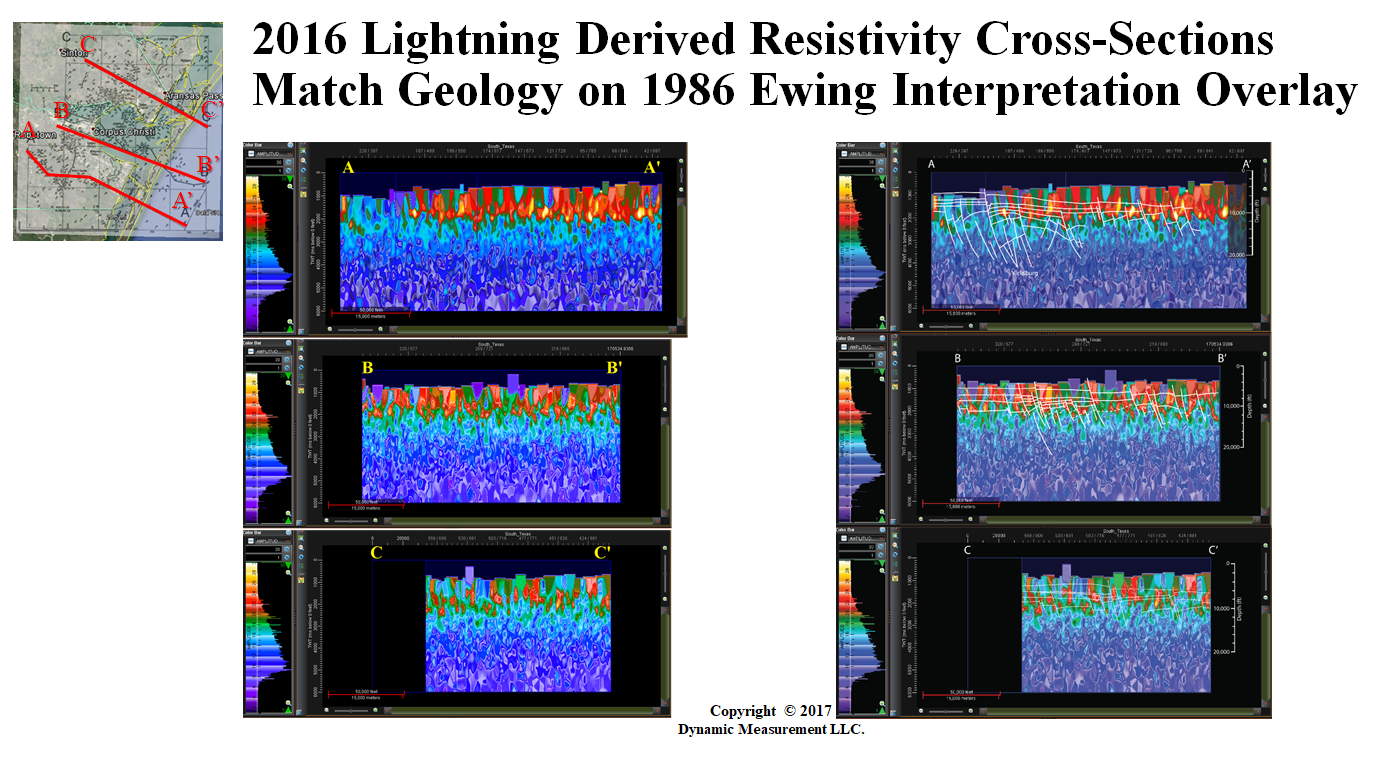 |
In 1986 Tom Ewing of BEG published 3 regional structural cross-section interpretation based on seismic and well data. Dynamic did a lightning analysis across this same area and pulled out apparent resistivity sections along these same 3 line locations. The Oil_&_Gas link goes to a series of images from this analysis. The South Texas link brings up the three apparent resistivity sections without and with the Ewing interpretation overlaid. Note how well the 2017 apparent resistivity anomalies match the 1986 structural interpretation. High resistivies above the key faults might show gas migration pathways. | |
| Oil & Gas | Hockley | 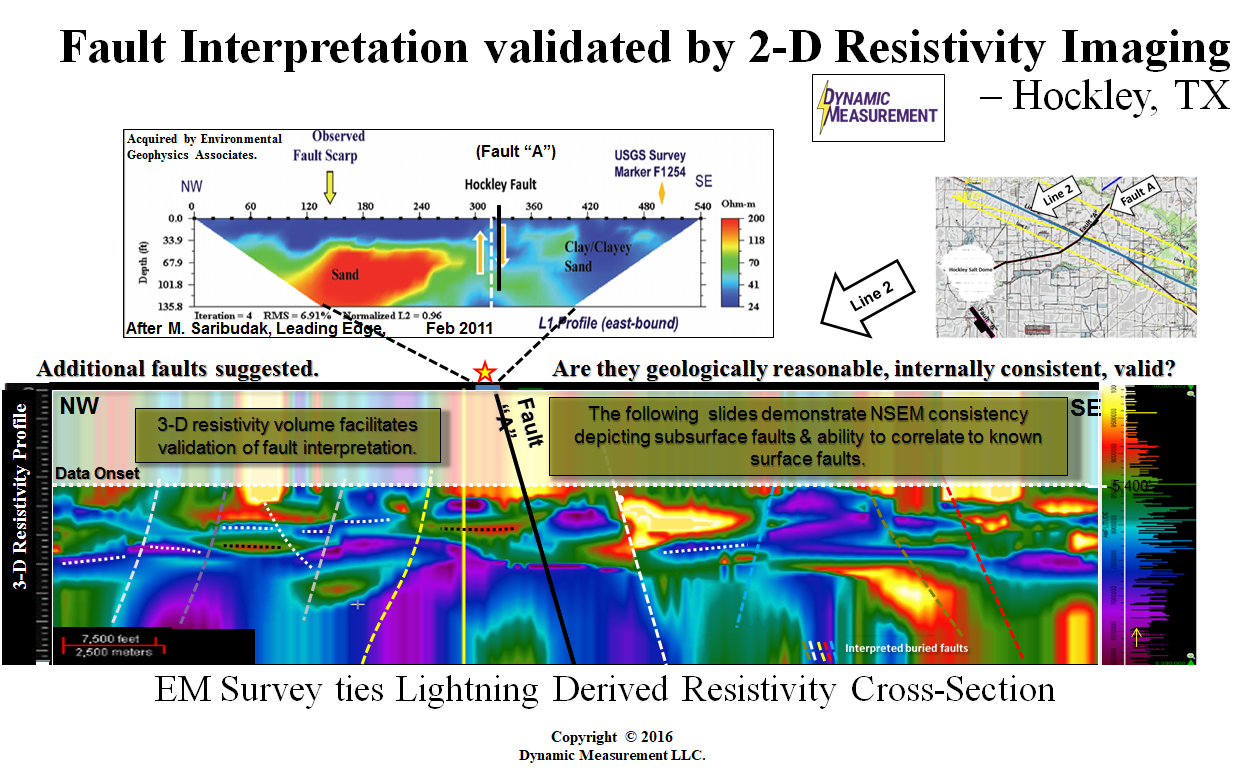 |
Louie Berent did this first project to tie a 2D Resistivity Image to a lightning cross-section across the same area. Note this project is in the same Hockley Dome Area where the idea of lightning analysis originated. NSEM Fault "A" matches the Resistivity Survey Fault "A". Note the other faults interpreted on this apparent resistivity cross-section. The Hockley link to the left connects to a series of parallel sections each of which have all of these faults and horizons on them. | |
| Oil & Gas | Colorado County | 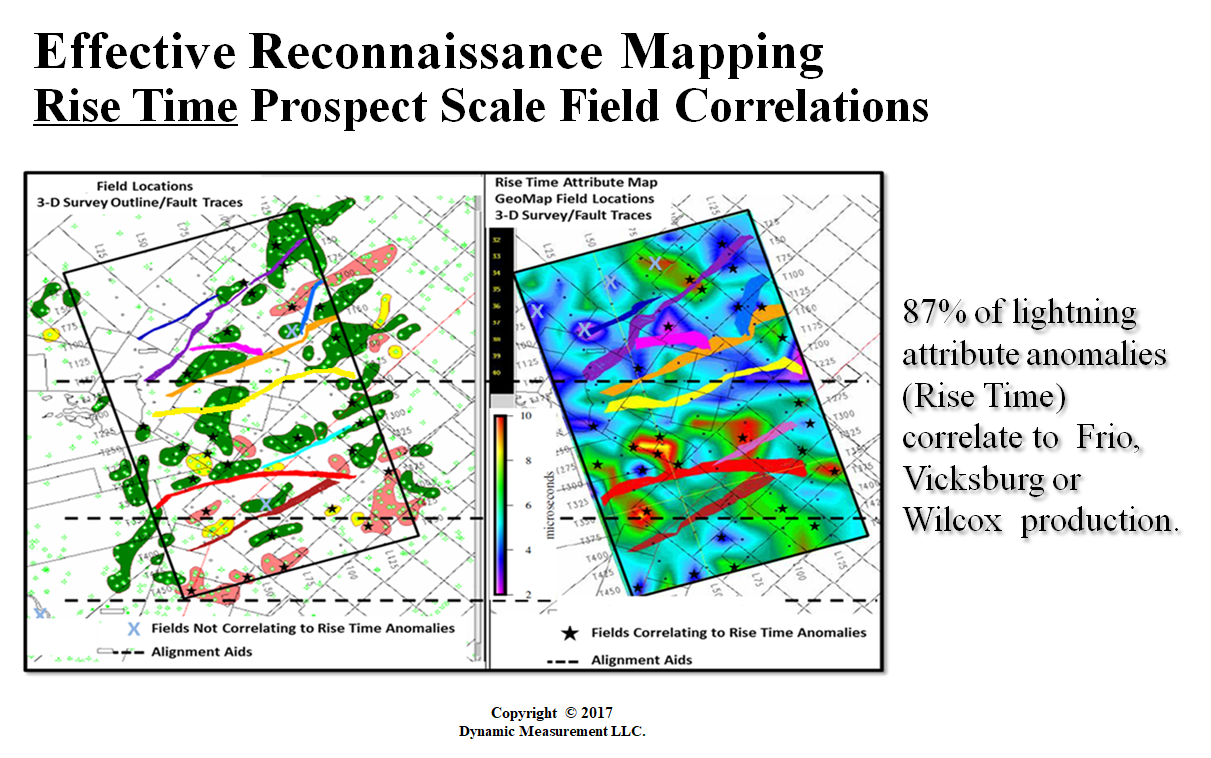 |
Louie Berent also did this analysis. He showed that 87% of Rise-Time lightning attribute anomalies correlate to Frio, vicksburg, or Wilcox production in this Colorado County, Texas lightning project. The left map shows the location of different fields within this 3-D seismic area. The right map shows the Rise-Time lightning attribute map. The faults were interpreted from the 3-D seismic defefining this area. Dynamic has developed tools so we can interpolate lightning attribute and rock property volumes to match the trace spacing of 3-D seismic, aeromag tracks, or other geophysical control. | |
| Oil & Gas | Houston | 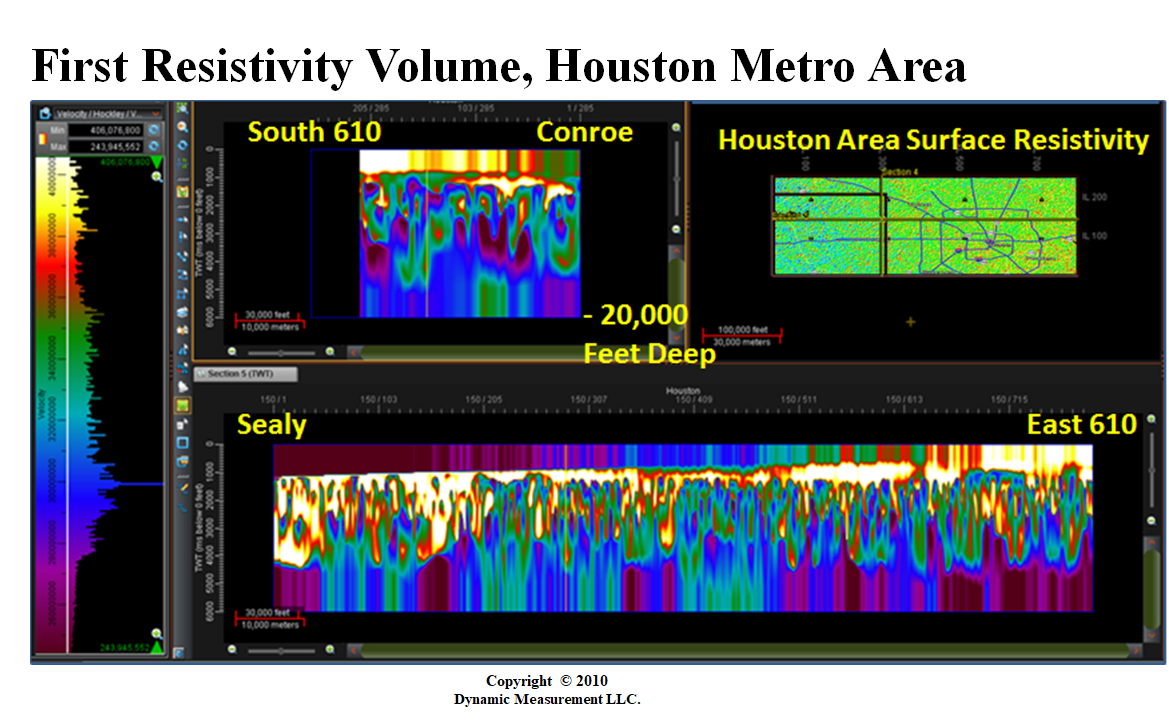 |
The Houston link shows data from another early lightning analysis project. Note Dynamic did not know how to mute above the first data, nor below the last data at this time. It is interesting how conductive this muted area is in the mud flats in Sealy and how resistive this zone is in the Trinity River flood planes by East 610. This matches what we expect from geology. It is also interesting the Houston infrasctructure has little to no impact on the lighting analysis results. Dynamic did find a lightning density anomaly over a large landfill, where there is a lot of methane seeping into the atmosphere. | |
| Oil & Gas | Goose Point, Lake Pontchartrain, Louisiana | 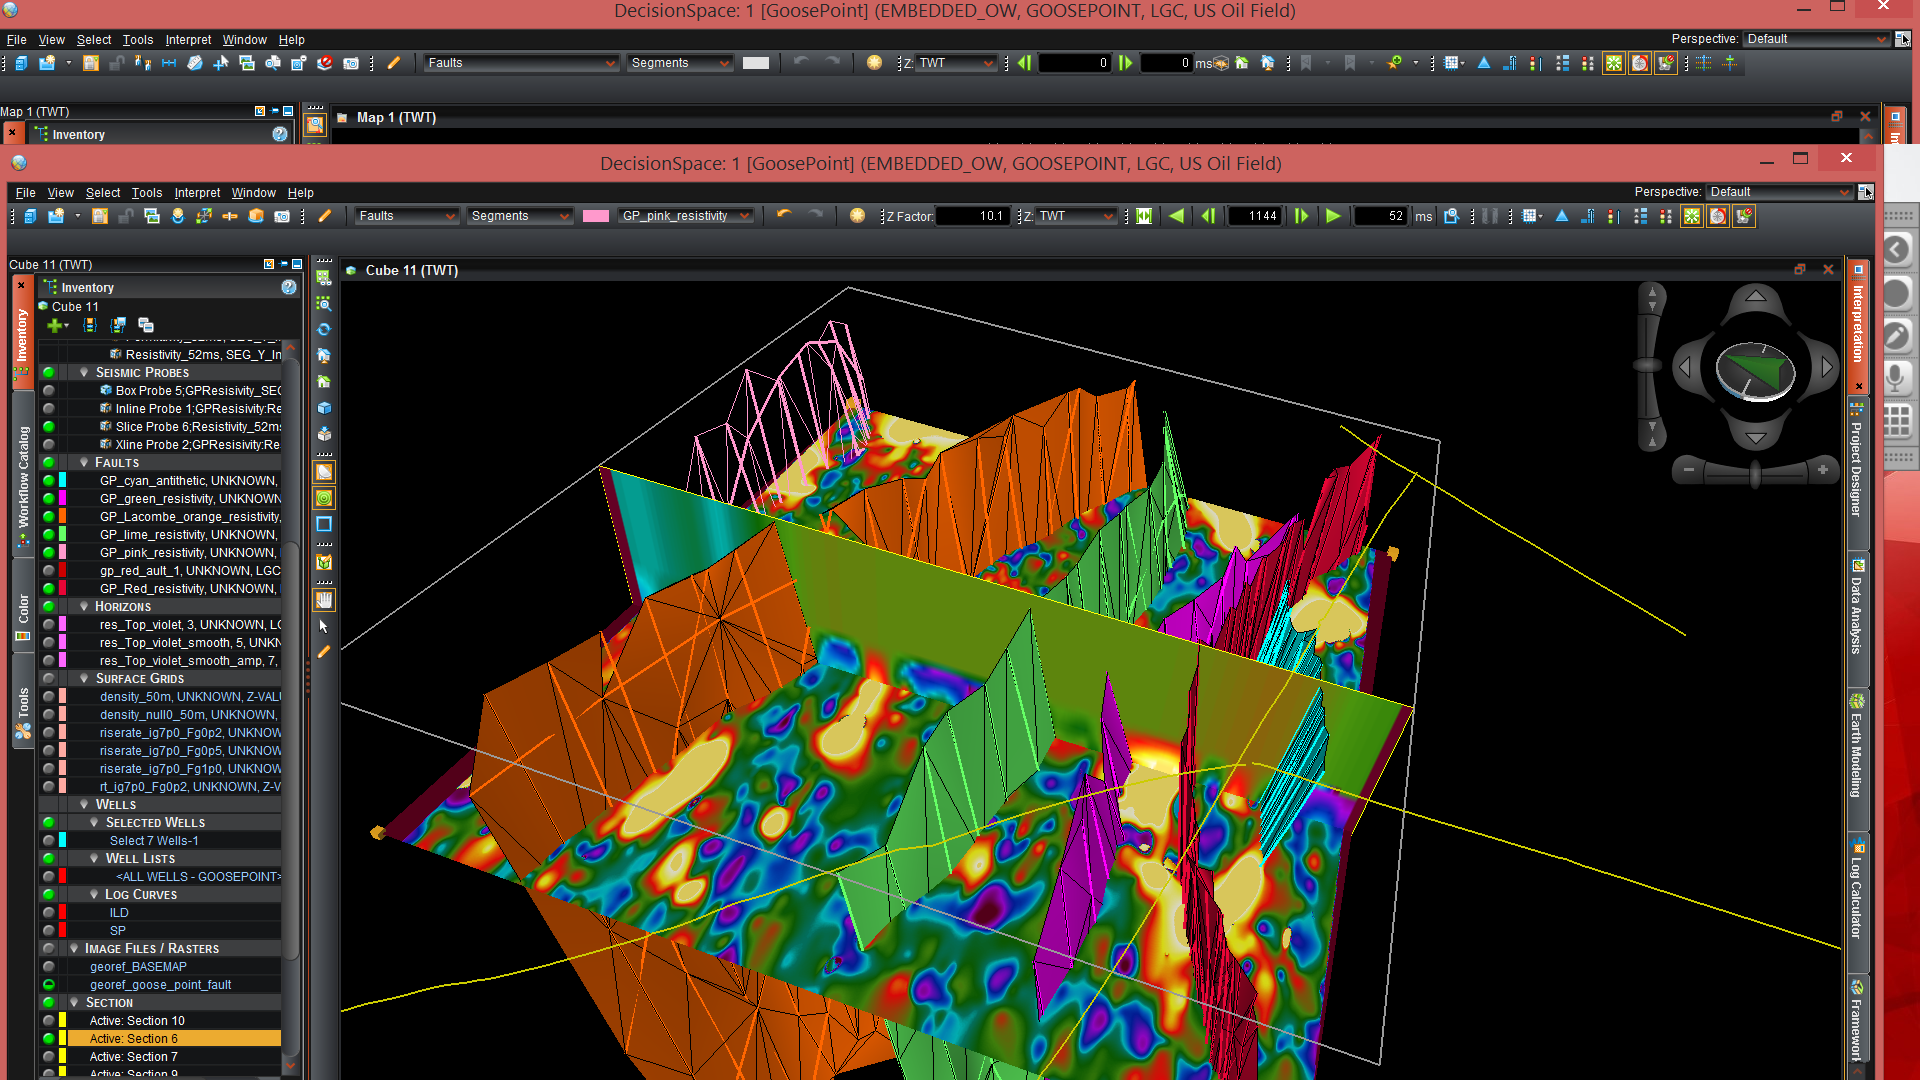 |
Kathy Haggar had performed wetland studies in the Goose Point part of Lake Pontchartrain, Louisiana. She provided well logs, sparker seismic, and LIDAR data to integrate with the lightning attributes. The linked image shows a fault interpretation derived from the lightning calculated apparent resistivity volume. Landmark Graphics, now division of Halliburton gave Roice Nelson, the initial founder of Landmark, a lifetime license to their seismic interpretation software. This software has been used to create most of the examples shown on these pages and in Dynamic Measurement papers. | |
| Oil & Gas | Red River County 3-Domes, TX Colorado Co., TX Covenant, UT Iberia Parish, LA Metro Houston Michigan Milam Co., TX North Dakota Steubens Co., NY |
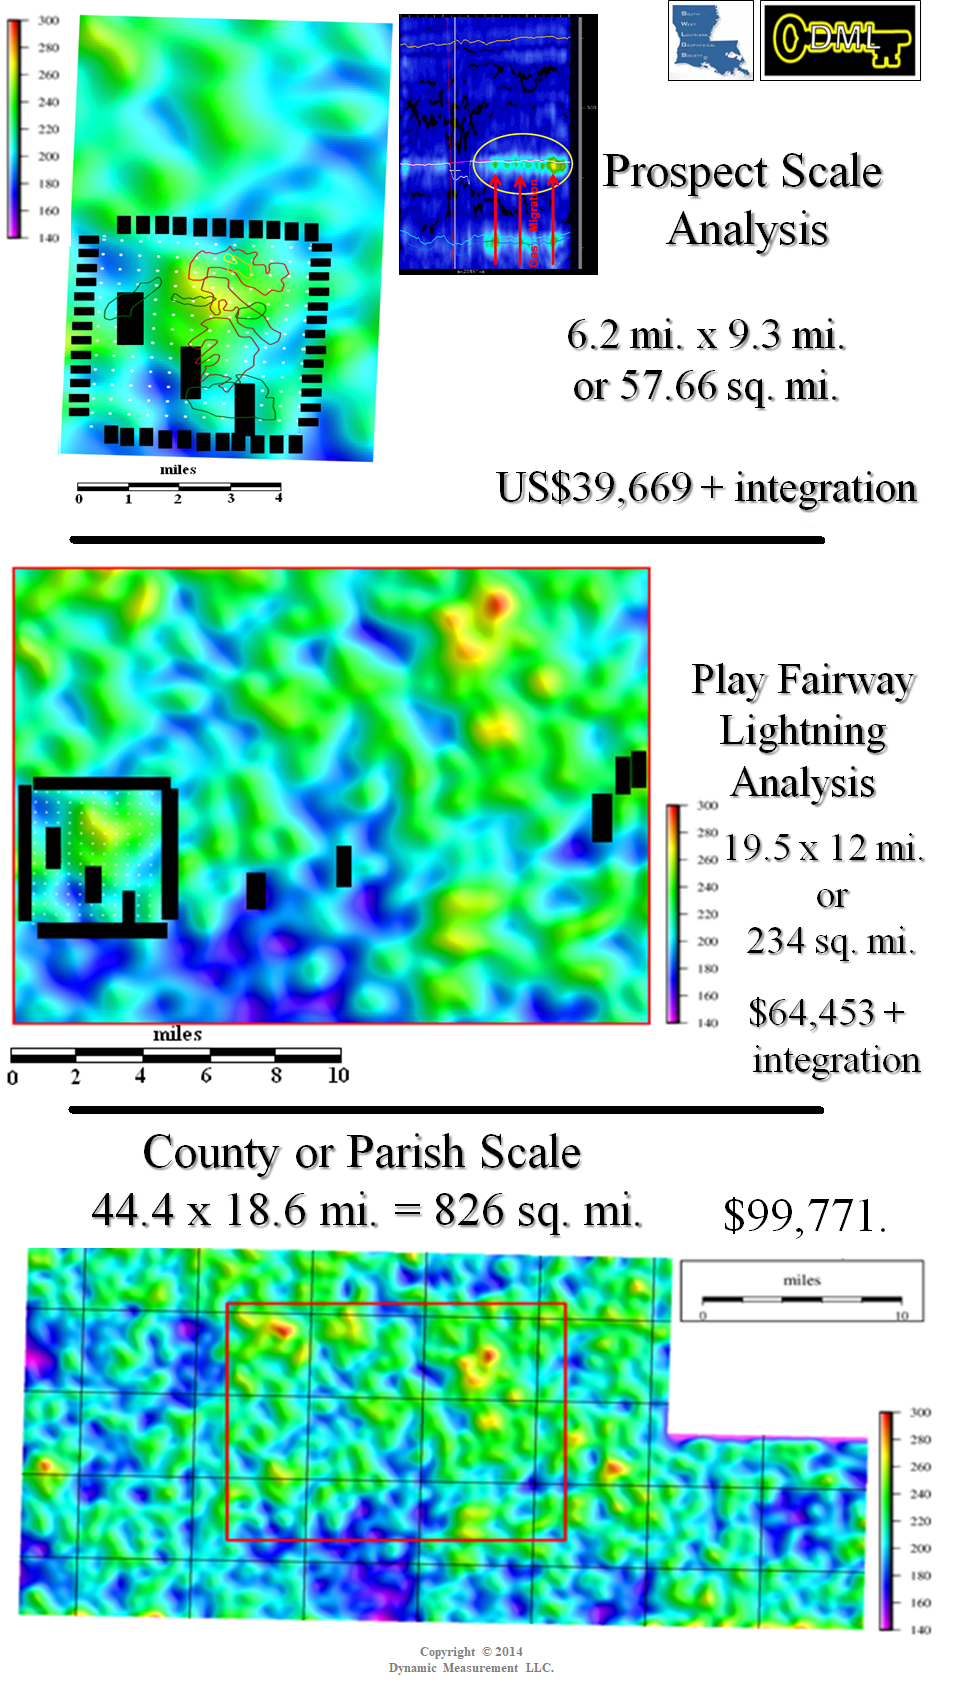 |
This 2013 project is in Red River County, Texas started as a seismic interpretation project. When the client happened
to mention "there is a place on the ranch where the 3-D seismic survey was located where they have a large number of lightning strikes." Told the client about the work we were doing with
lightning analysis, and they were interested in doing a test. Each of the 3 displayed scaled results (Prospect Scale - 57.66 square miles; Play Fairway scale - 234 square miles; and Regional
scale - 825 square miles) show about 270 lightning strikes per square kilometer (yellow anomaly at the top of the 3-D seismic survey) over this part of the ranch. This test was done before Dynamic
knew how to create lightning attribute and rock property volumes. The following shows how pricing has increased with the ability to create 50 meter trace spaced volumes:
| |
| Origins | Texas Duck Hunting Story | 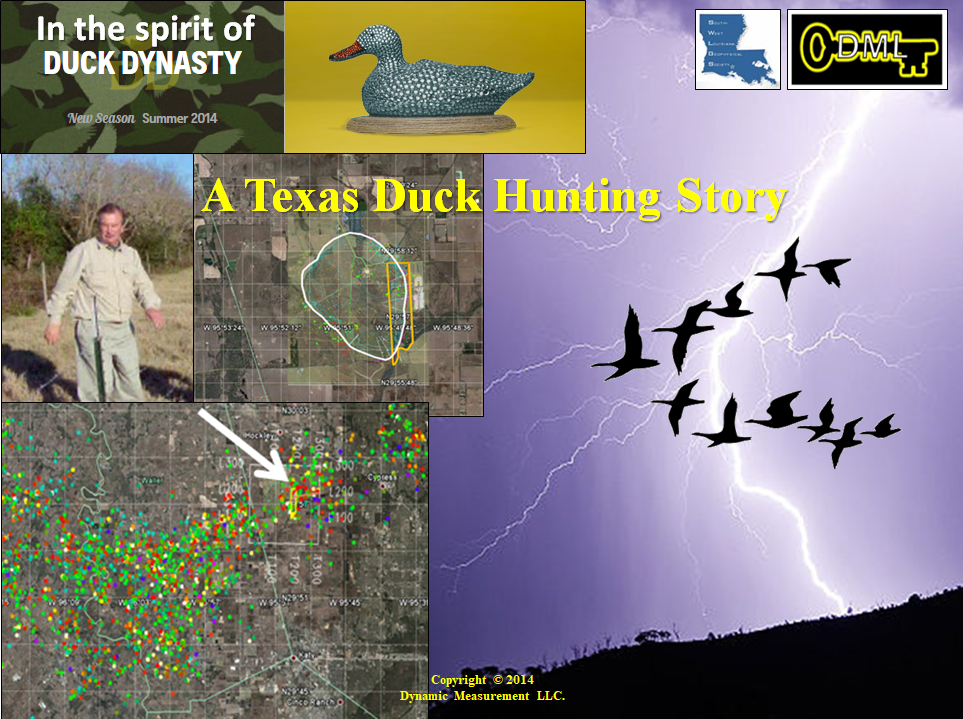 |
In 2007 Joe Roberts, who built Landmark Graphic's first building, was hunting ducks on his property on the east flank of the Hockley Salt Dome in Harris County, Texas. A lightning strike hit right next to where Joe's truck was parked. Scared him. A year later he was at the same place doing the same thing. Another storm, a lightning strike hit the same place. Joe drove to Roice Nelson's house and asked if lightning strikes twice in the same place, and if it does does it mean he has oil underneath his property. Roice asked Fox News Chief Meteorlogist, Dr. Jim Siebert, the same questions, and the rest is history. | |
| Origins | Founders | 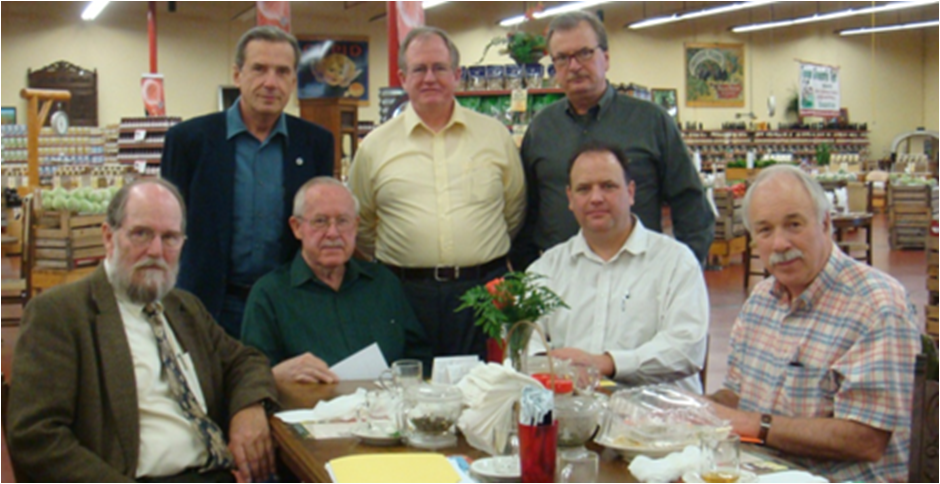 |
The summer of 2008 Founders of Dynamic Measurement LLC, a Delaware LLC, met for lunch on in West Houston. Bottom front: Les Denham, Dr. Richard Coons, Dr. Jim Siebert, Dr. Richard Nehring; top back Dr. Wulf Massell, Roice Nelson, and Joe Roberts. Dick Coons has since died from Parkinson's. Dr. Sam LeRoy chose to not be a co-founder. Les, Roice, and Jim have remained active in Dynamic Measurement. Michael Reed later joined as COO, Kathy Haggar as Chief Geologist, Louis Berent as Vice-President Interpretation Business Deveopment, and Mark Ruths as Technology Accelerator. | |
| Patents | Patent 1 | 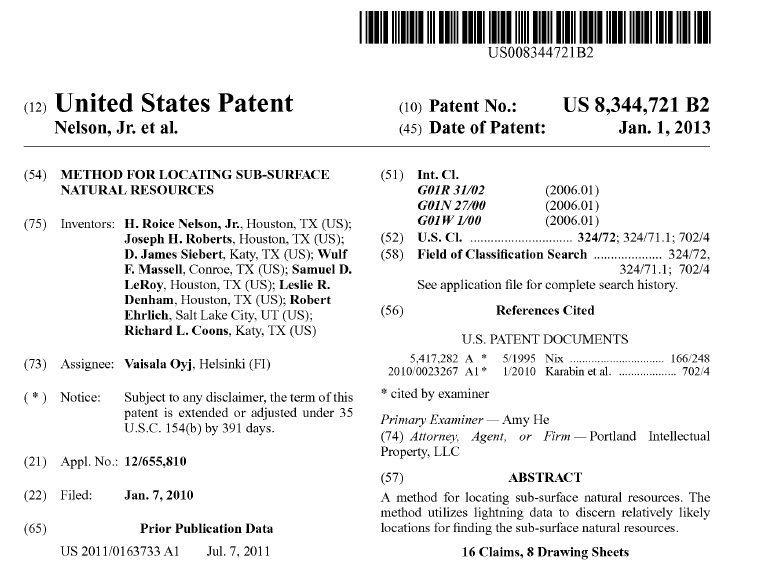 |
The summer of 2008 Roice and Dr. Jim met with representatives of Vaisala, owners of the best lightning databases in Houston and signed a non-disclosure agreement. Later that summer Roice and Jim went to Helsenki, Finland and met with senior executives of Vaisala and signed a license agreement providing exclusivity to Dynamic Measurement for reselling Vaisala's lightning data for natural resource exploration. Vaisala also arranged for a Patent application, with Dynamic Measurement having exclusive use. The agreement's first renewal was in 2018. The patent was issued 01 January 2013. | |
| Patents | Patent 2 | 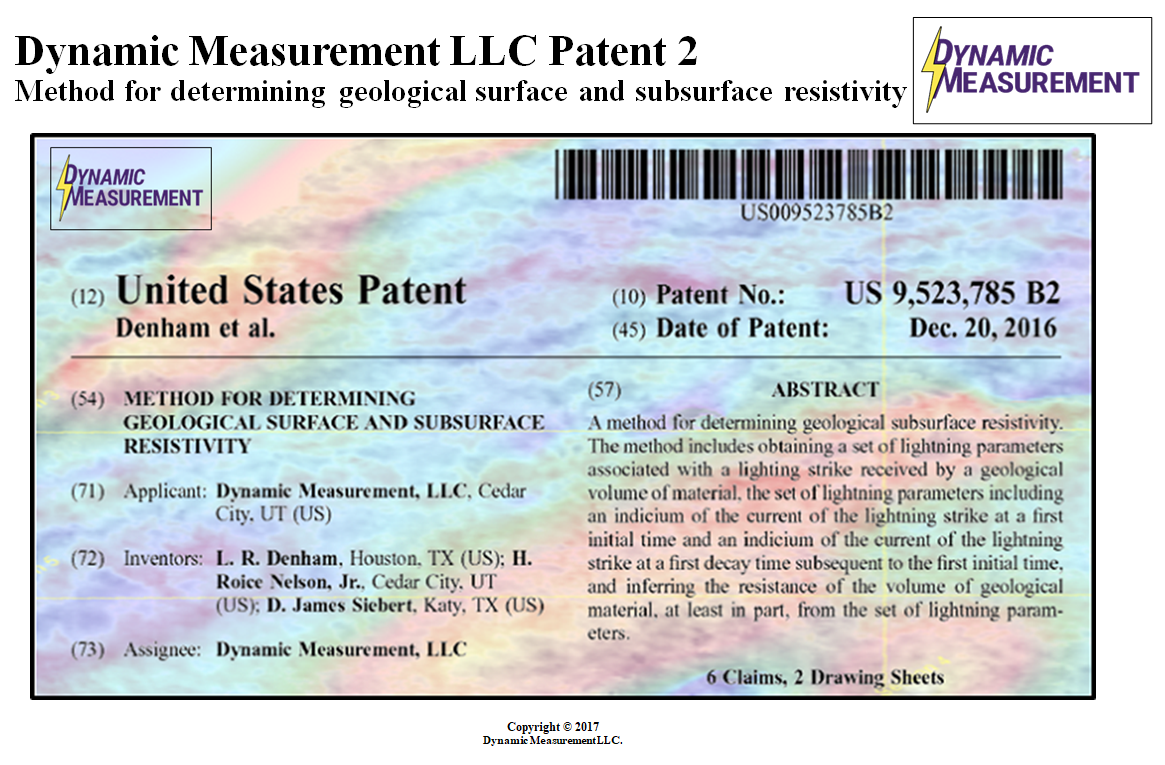 |
Inventing a new branch in the geophysical services industry happened one step at a time. Les Denham has been the primary software architect and implementer. Les used the Infinite Gridsm to organize millions of lightning strikes and make maps. Les developed assumptions and 3-D interpolation software enabling creation of volumes. Les came up with the mathematics for calculating rock properties apparent resistiviy and apparent permitivitty from lightning databases. Dynamic Measurement applied for a U.S. patent, which was issued 20 December 2016. Volumes are now routinely calculated and interpreted. | |
| Projects | Projects | 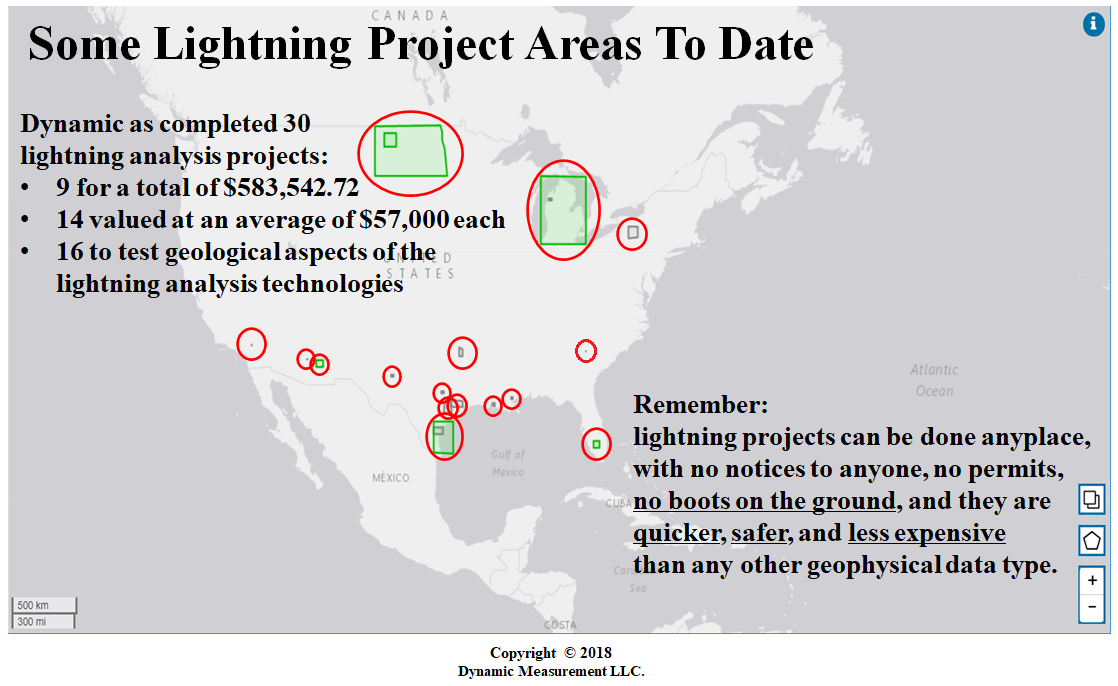 |
Dynamic's first two projects were in Steubens County, New York and Colorado County, Texas. Then a project was done for ConocoPhillips in North Dakota, and regional and subset projects in Houston, Michigan, and South Texas. Additionally there have been projects in Arizona, California, British Columbia, Florida, Louisiana, Nevada, North Carolina, Oklahoma, at least 7 projects in Texas, and 3 projects in Utah. The projects in Nevada and 2 projects in Arizona were focused on mining. The most complete databases are the NLDN, CLDN, and NALDN, and Dynamic can do projects anywhere in the U.S. or Canada. | |
| Technology | NLDN | 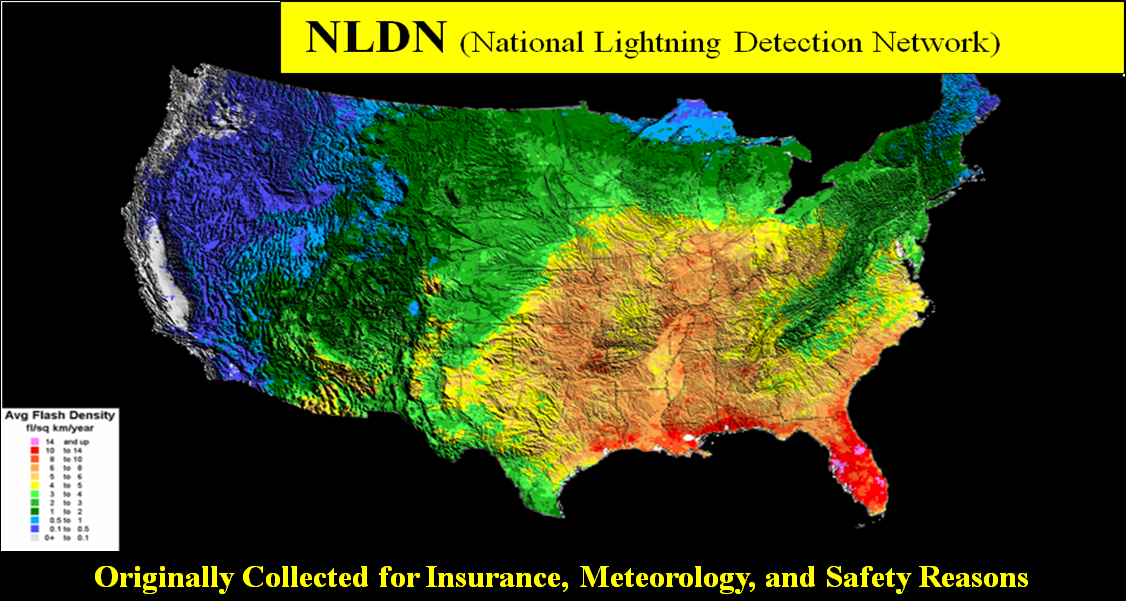 |
The NLDN database was largely built for insurance. When Dr. Richard Orville first measured lightning strike locations in 1982, 60% of houses claimed to have been burned down by lightning were misclassified. Vaisala's main business areas have been insurance, safety (golf courses and airports), and television meteorologists, like Dr. Jim Siebet. Looking at the map link to the image, you can see geological fingerprints like the Mojave Desert and the Snake River Plains volcanic flows. Most storms in the U.S. come down between the Rockies and the Appalachians, or from either side of Florida. | |
| Technology | Calculating Rock Properties from Lightning Databases | 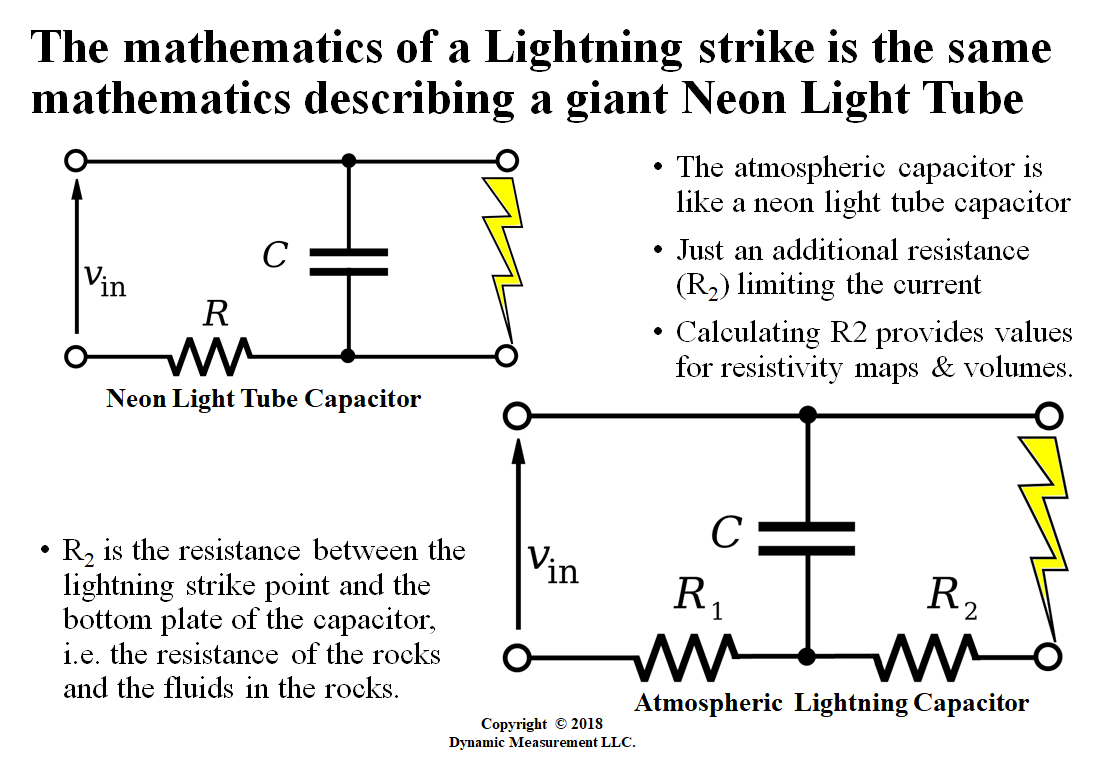 |
Calcualtion of rock properties (apparent Resistivity and apparent permittivity) from lightning databases is one of Dynamic's biggest breakthroughs. Schlumberger, Halliburton, as well as other large geophysical contractors have largely built their business on the ability of downhole tools to measure rock properties, specifically resistivity, a few inches from the wellbore. Dynamic's measurements are anyplace. Dynamic's measurements are lower frequency than downhole tools. However, they fill the gaps between wells and other geophysical or geological control. |
![]()