 |
 |
 |
 |
 |
 |
 |
 |
 |
 |
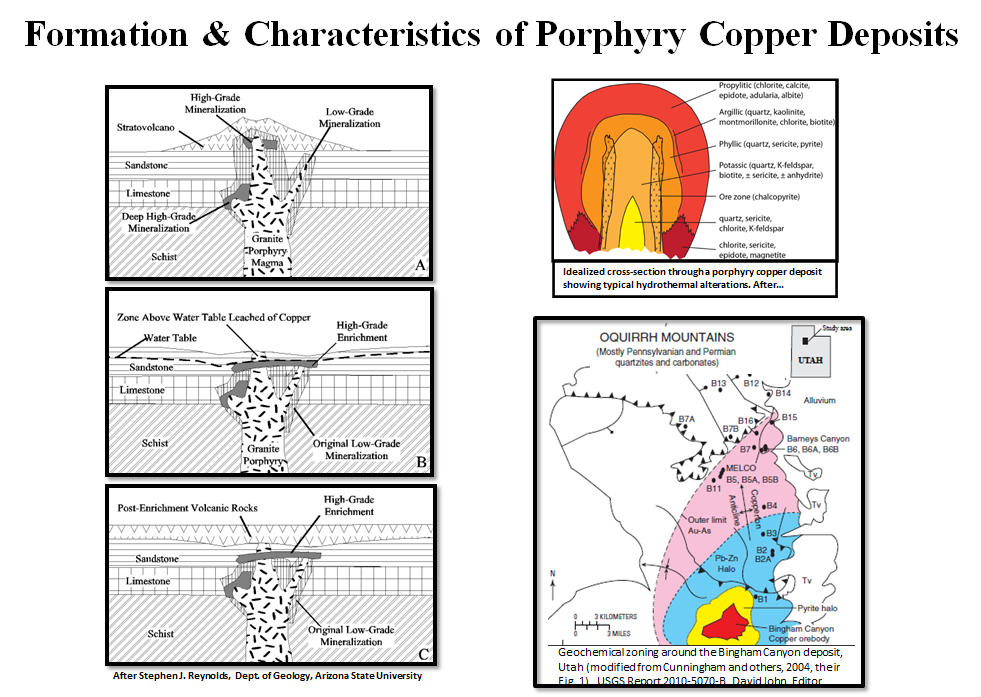
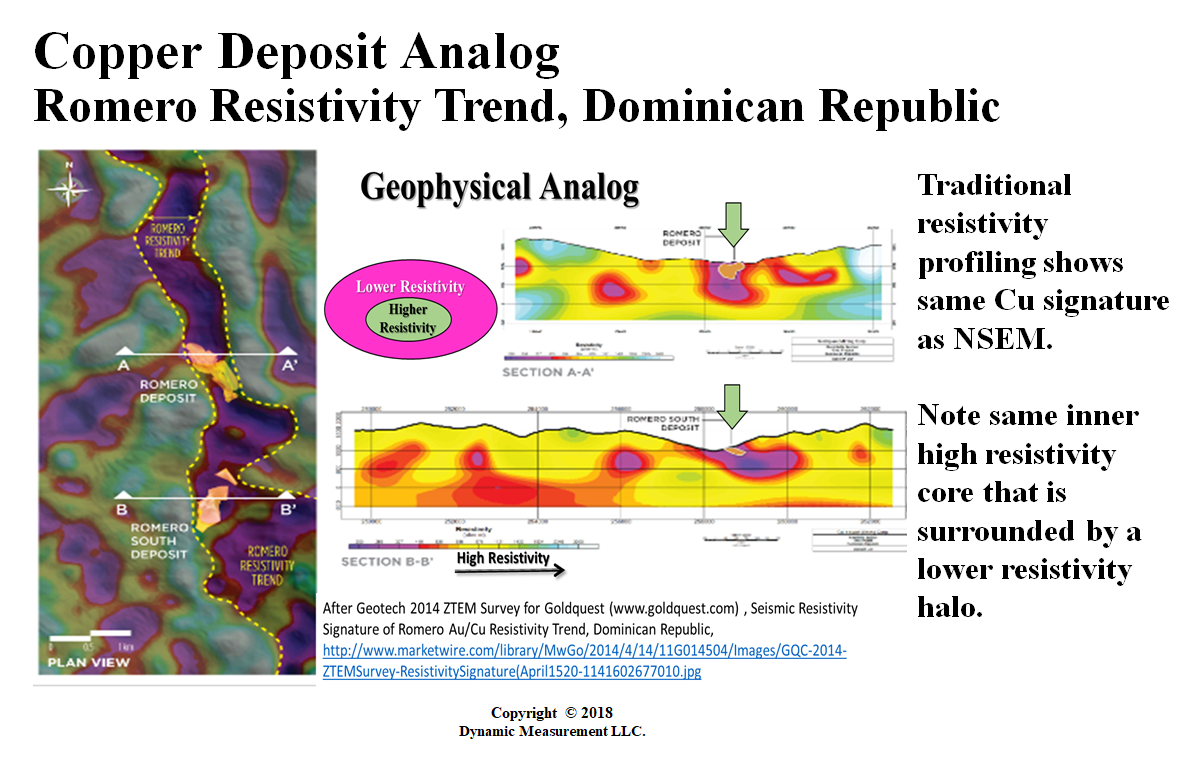
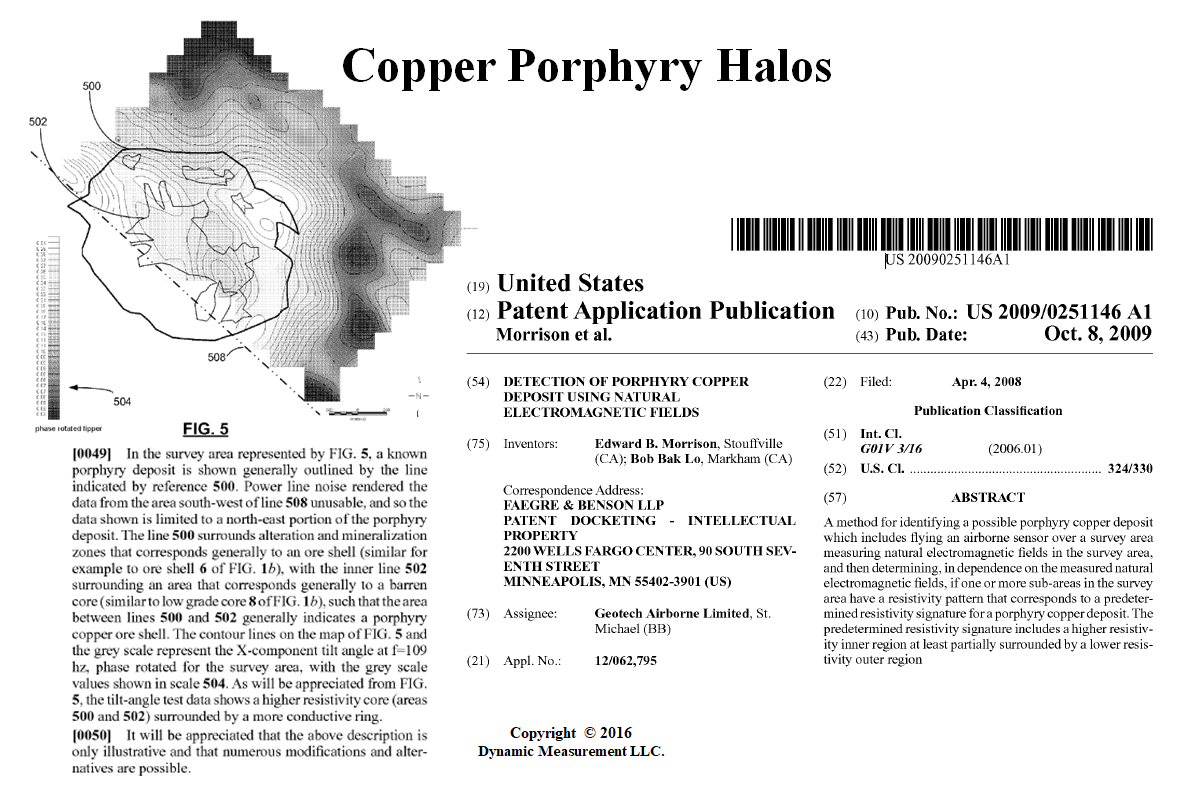
| Formation & Characteristics of Porphyry Copper Deposits | Copper Deposit Analog, Romero Resistivity Trend, Dominican Republic |
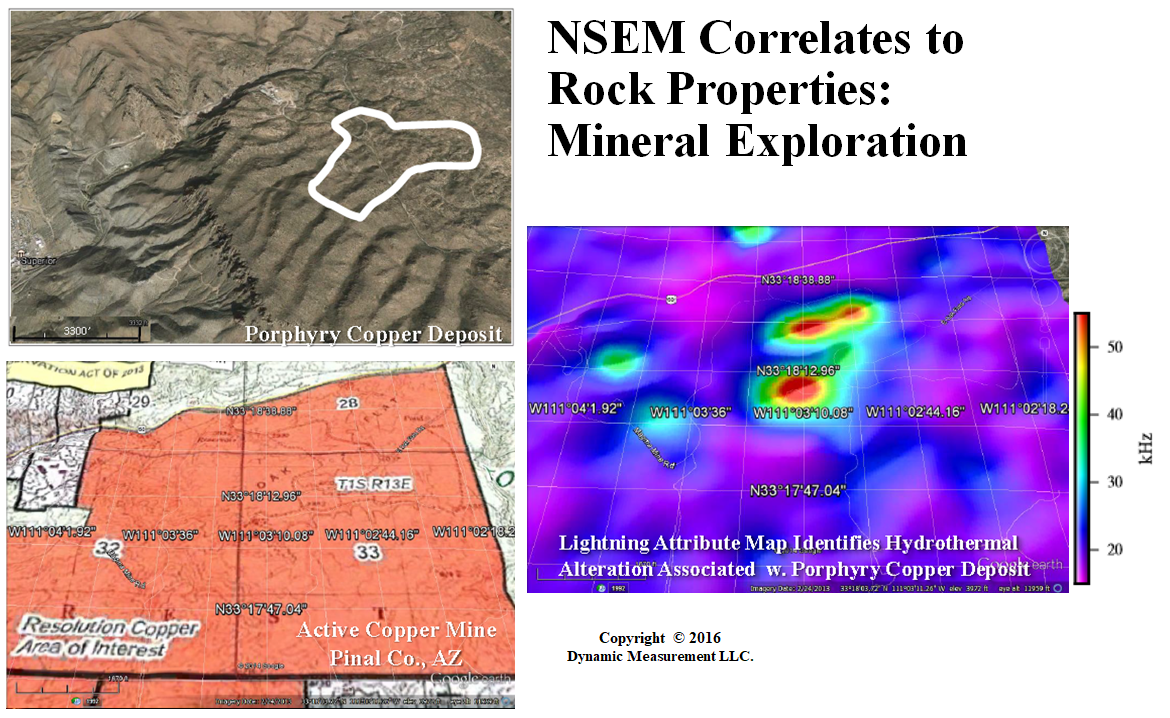
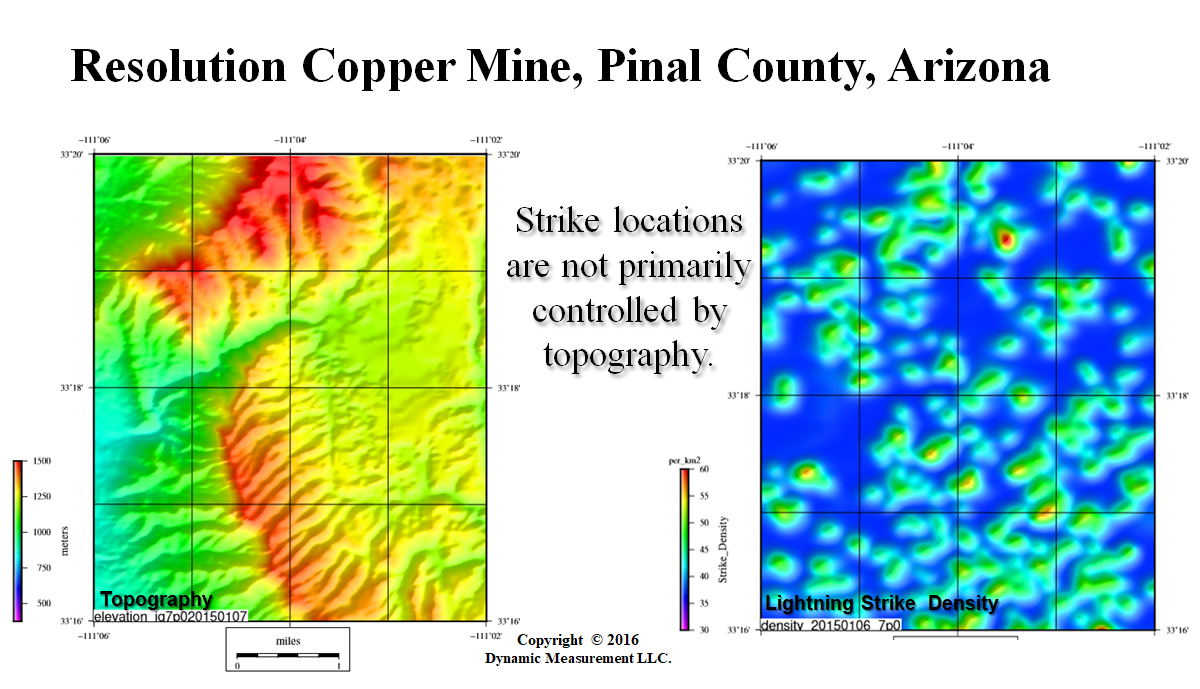
NSEM Correlates to Rock Properties at Resolution Copper Mine, Superior, AZ | Topography and initial Lightning Strike Density Map |
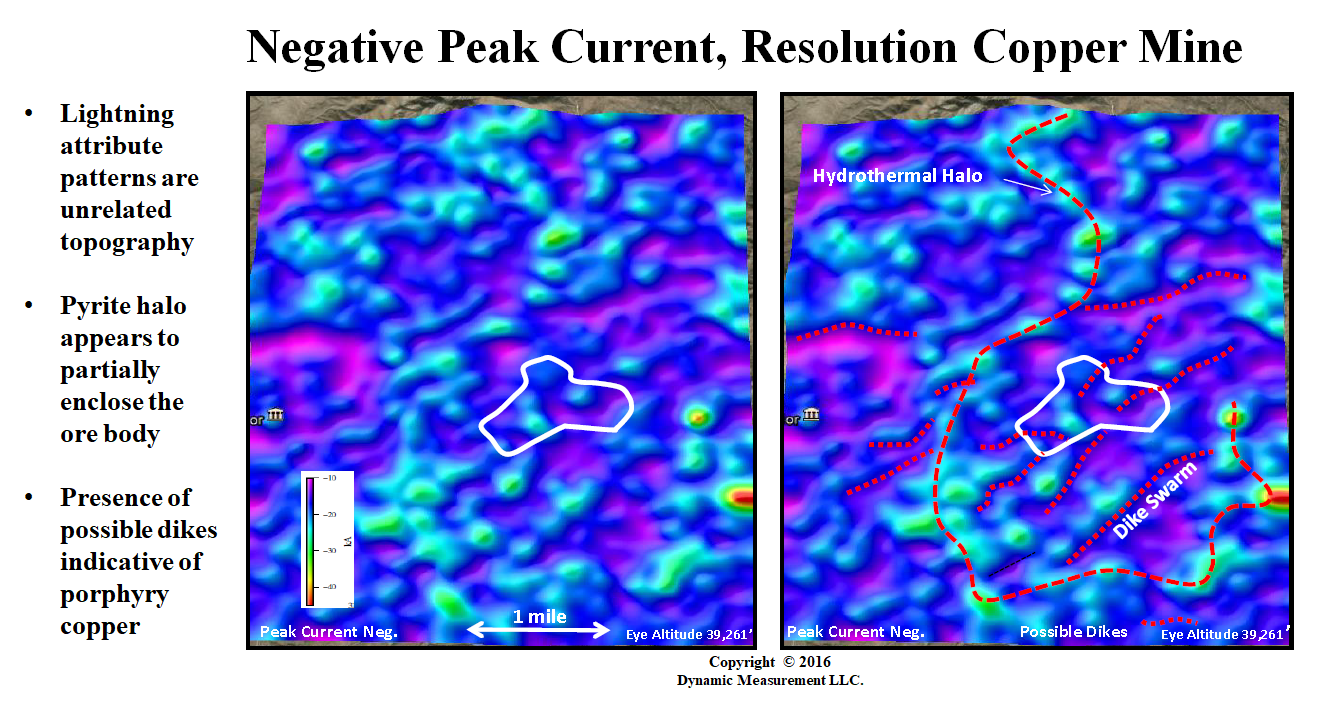
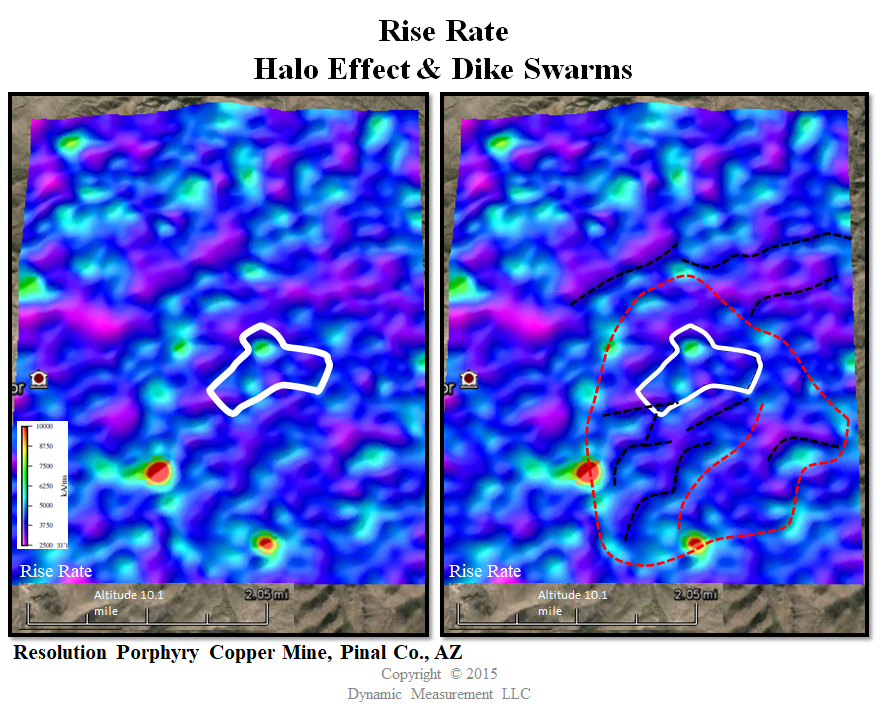
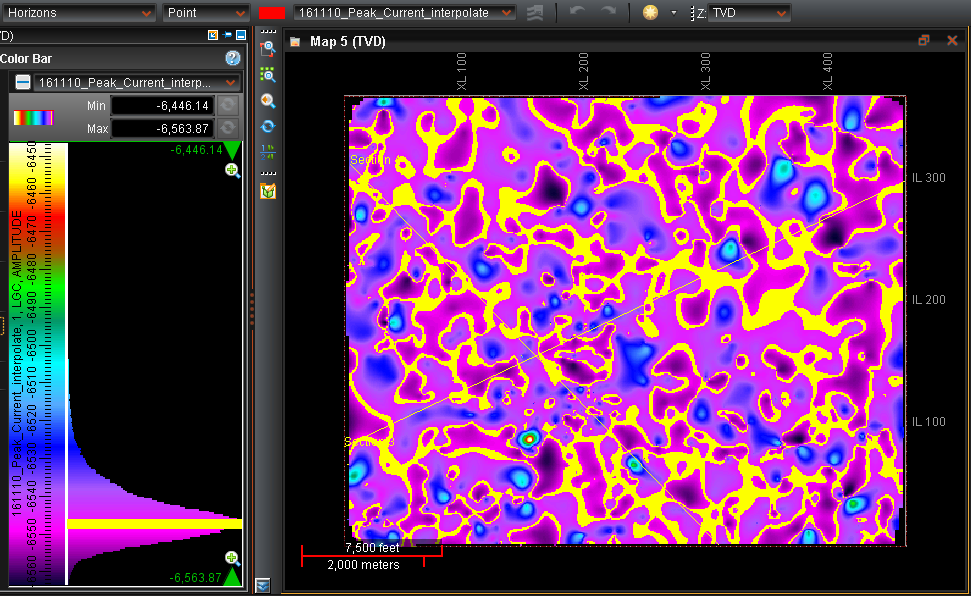
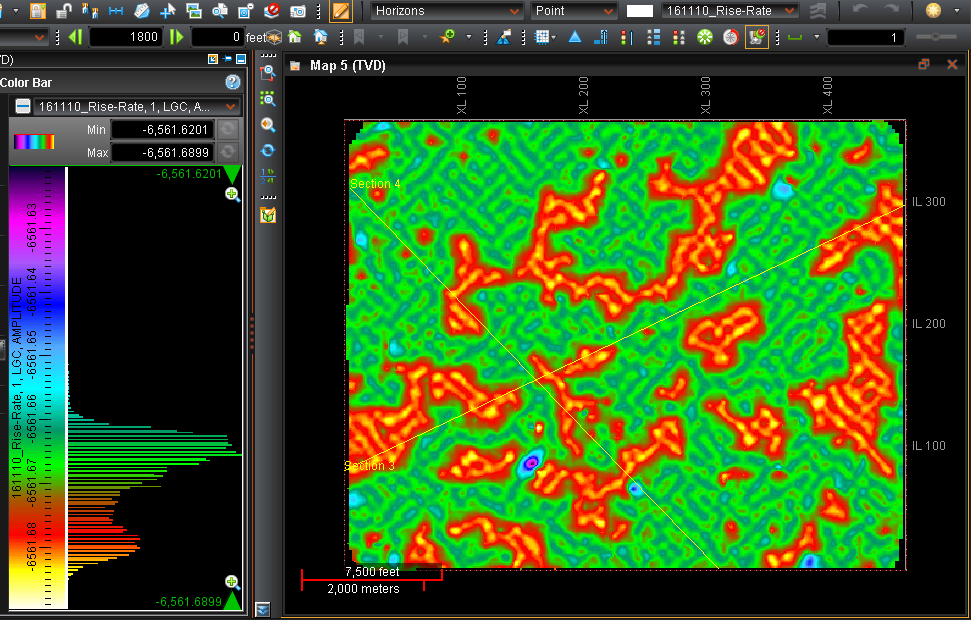
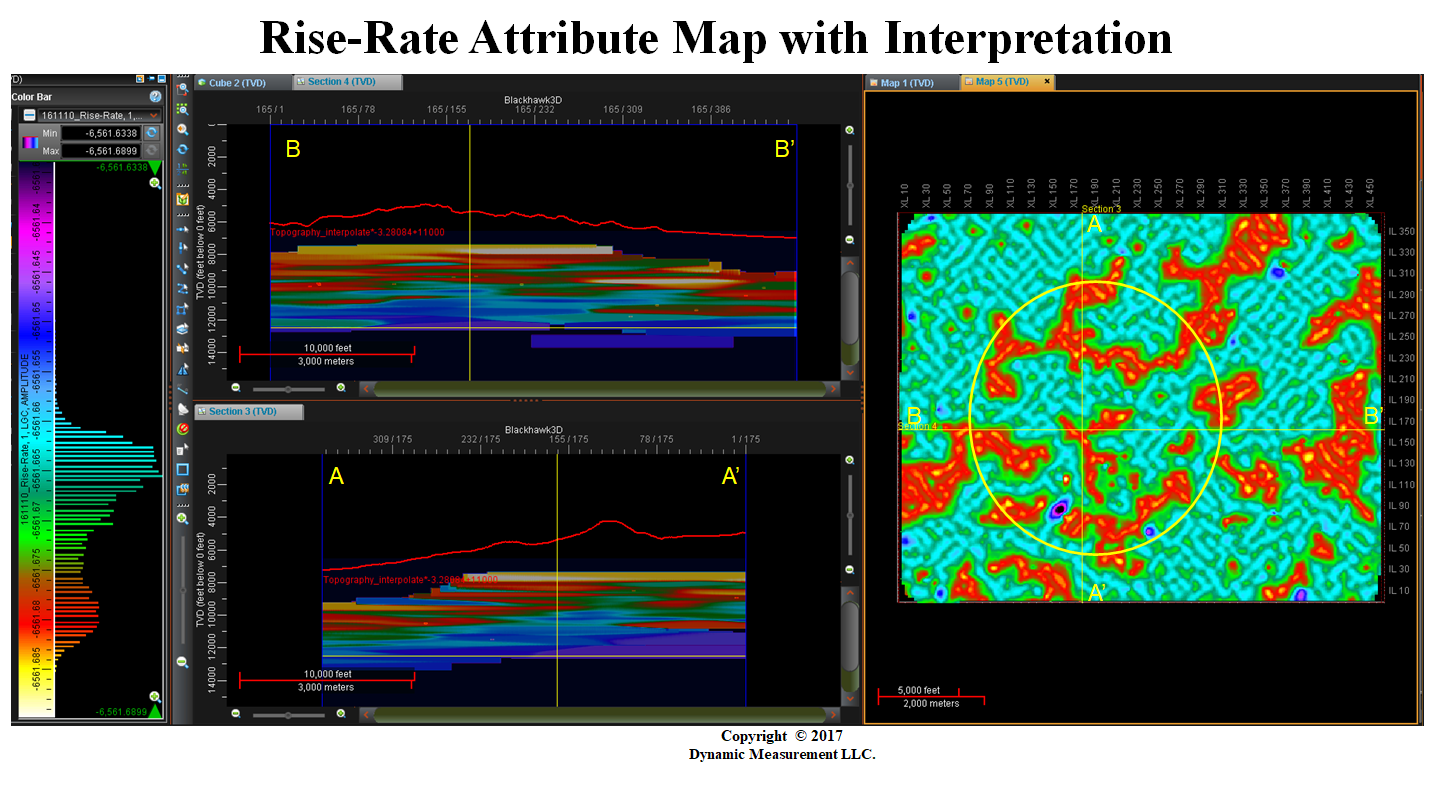
Negative Peak Current, mine outline white, halo & red dike interpretation | Rate of Rise-Time lightning attribute with mine & halo & possible dikes |
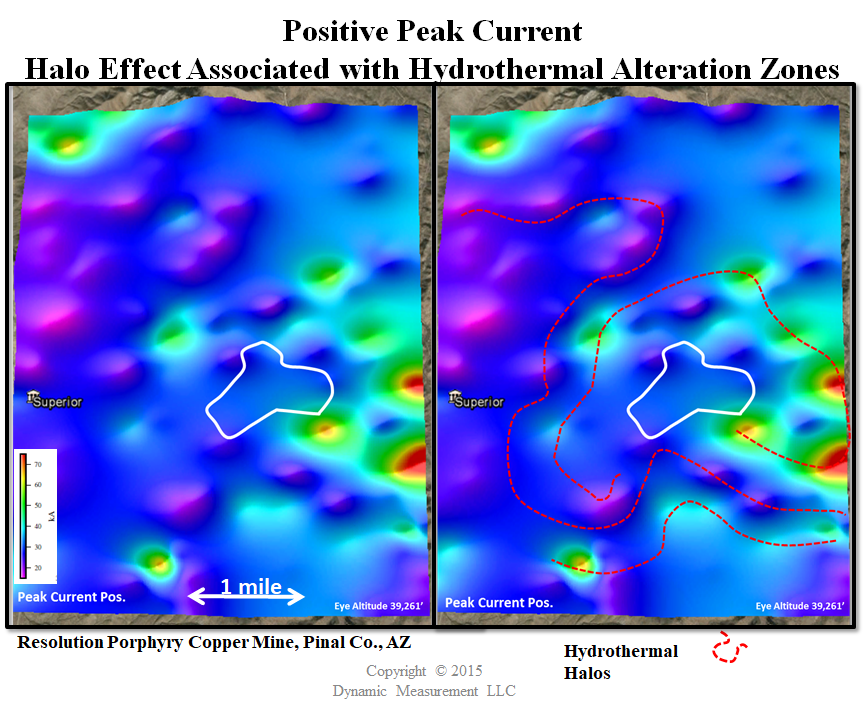
Positive Peak Current, red halo effect hydrothermal alteration zones | Copper porphyry lightning signature and other possible deposits |
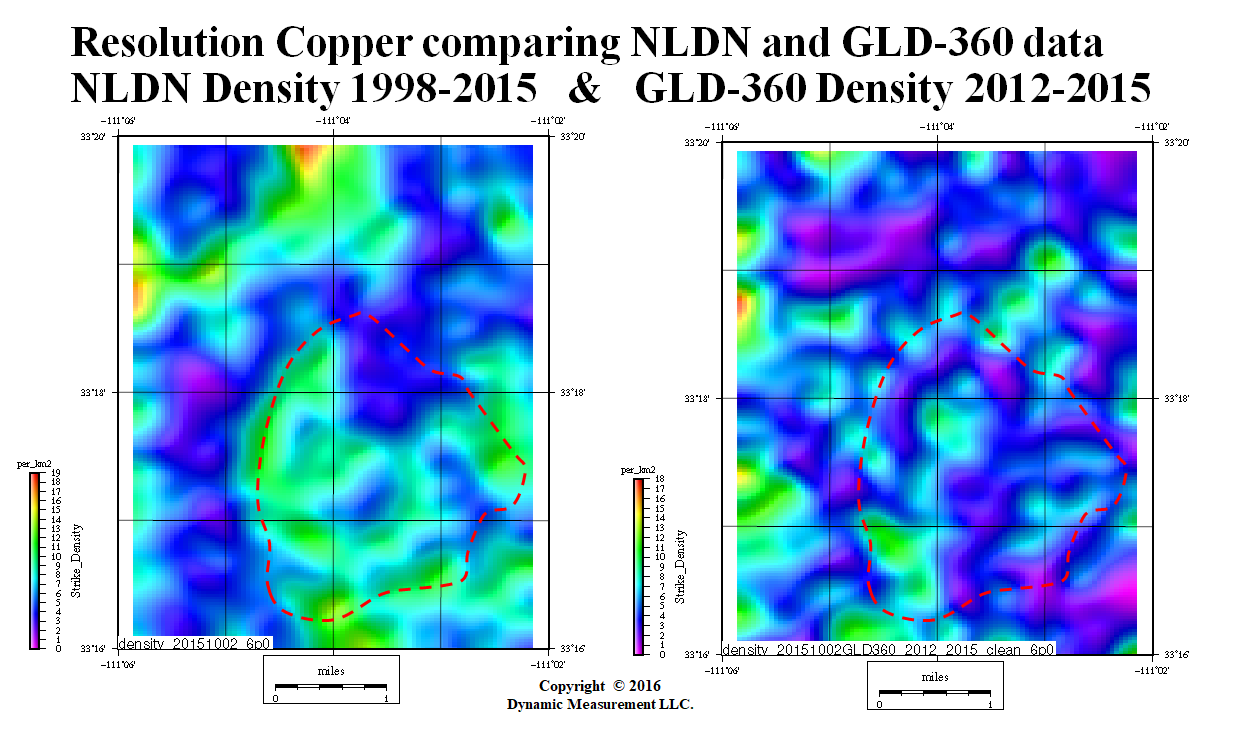
Aeromag patent electromagnetic identification of possible porpyry copper deposits | Comparision lightning density from NLDN and GLD-360 databases |
 |
 |
 |
 |
 |
 |
 |
 |
 |
 |
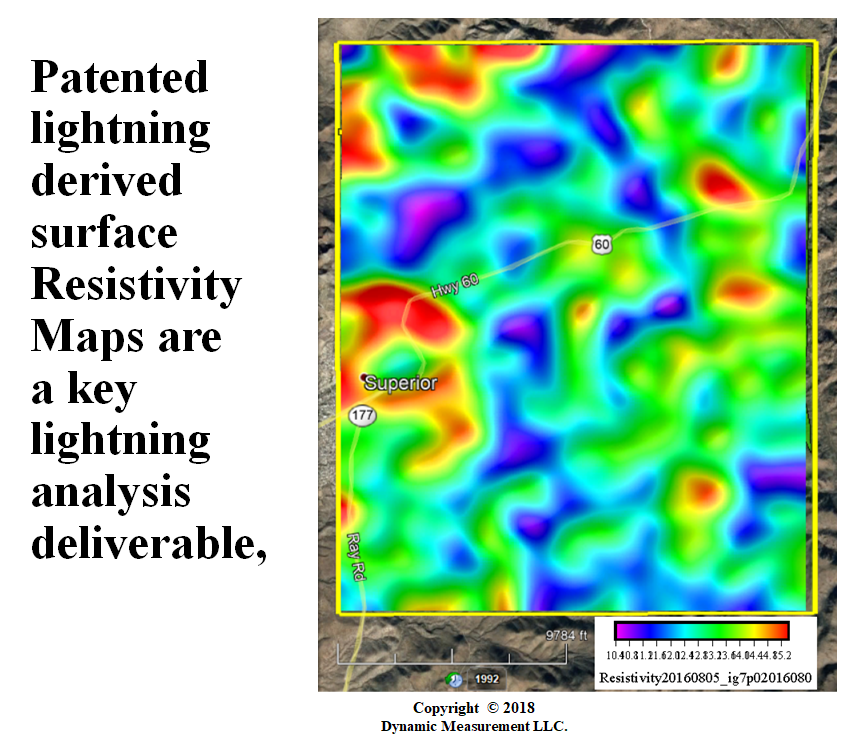
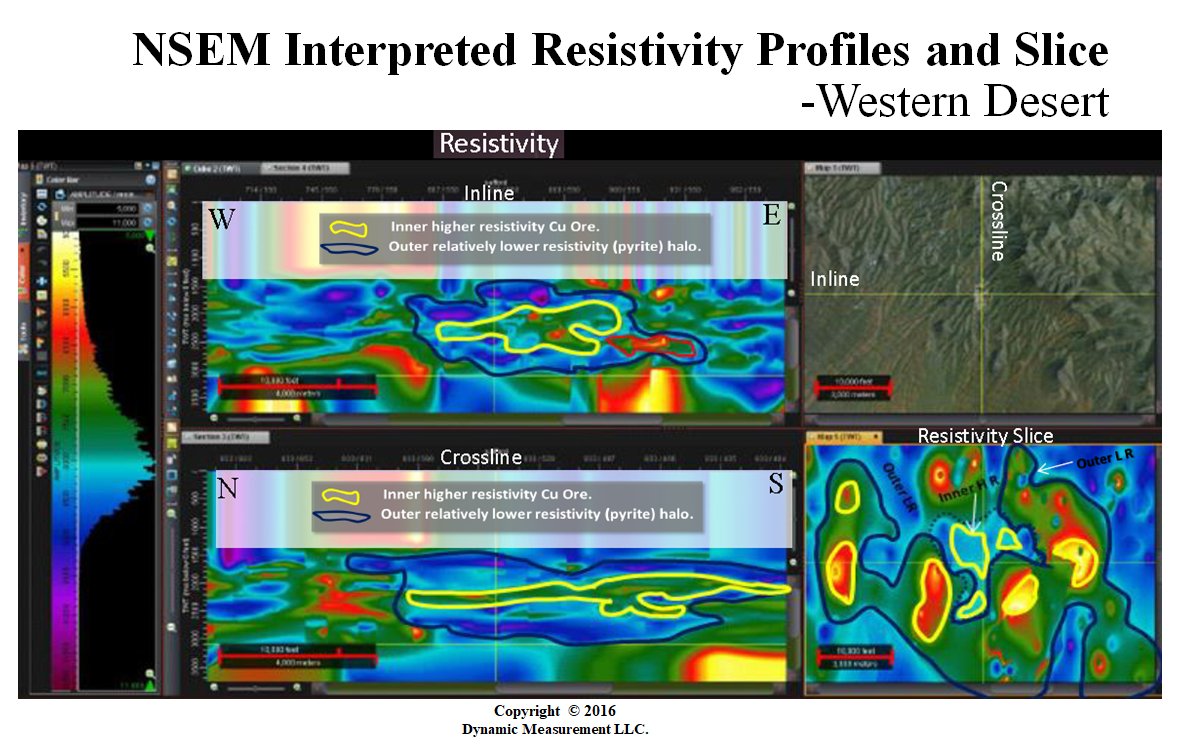
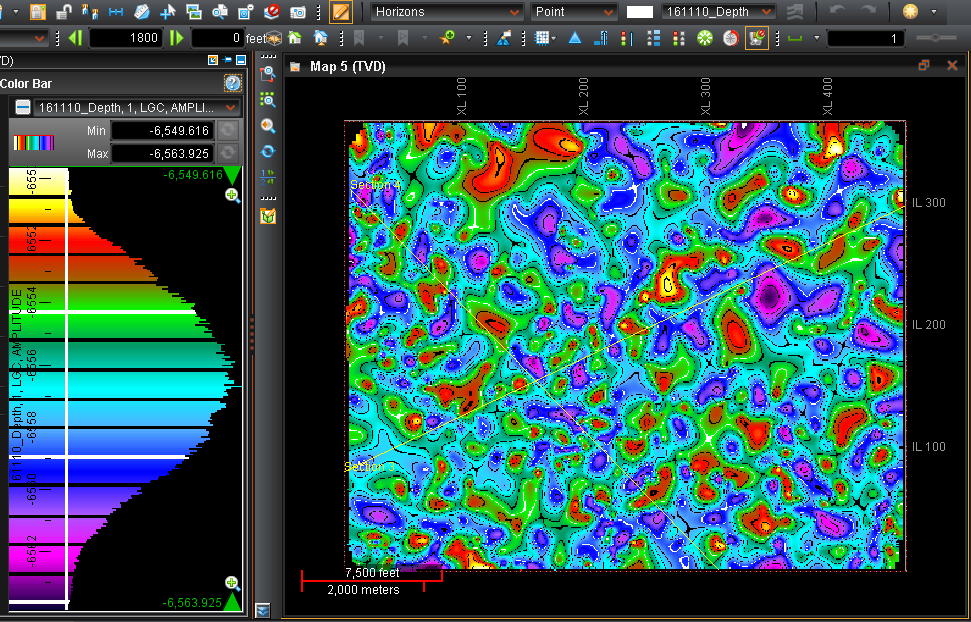
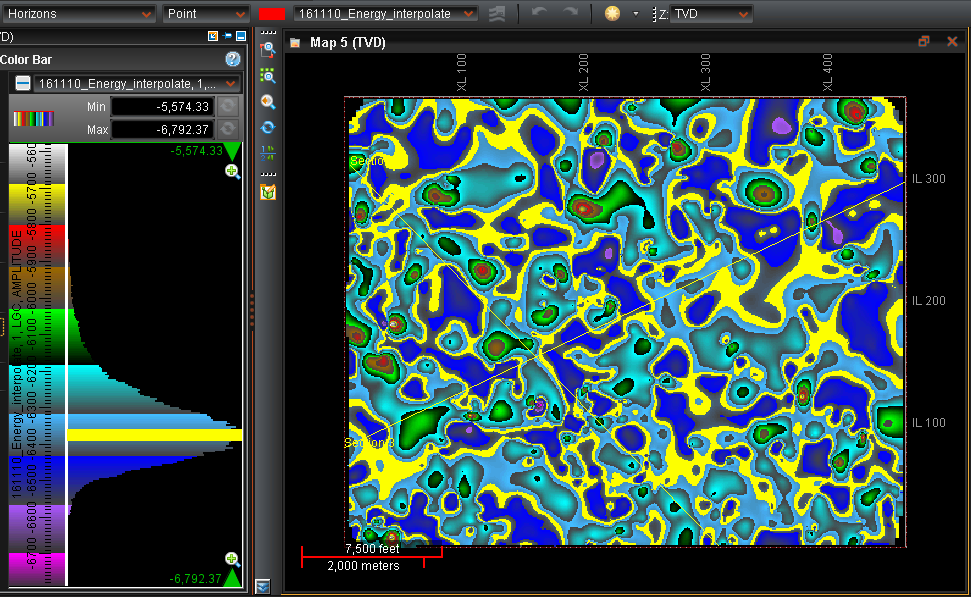
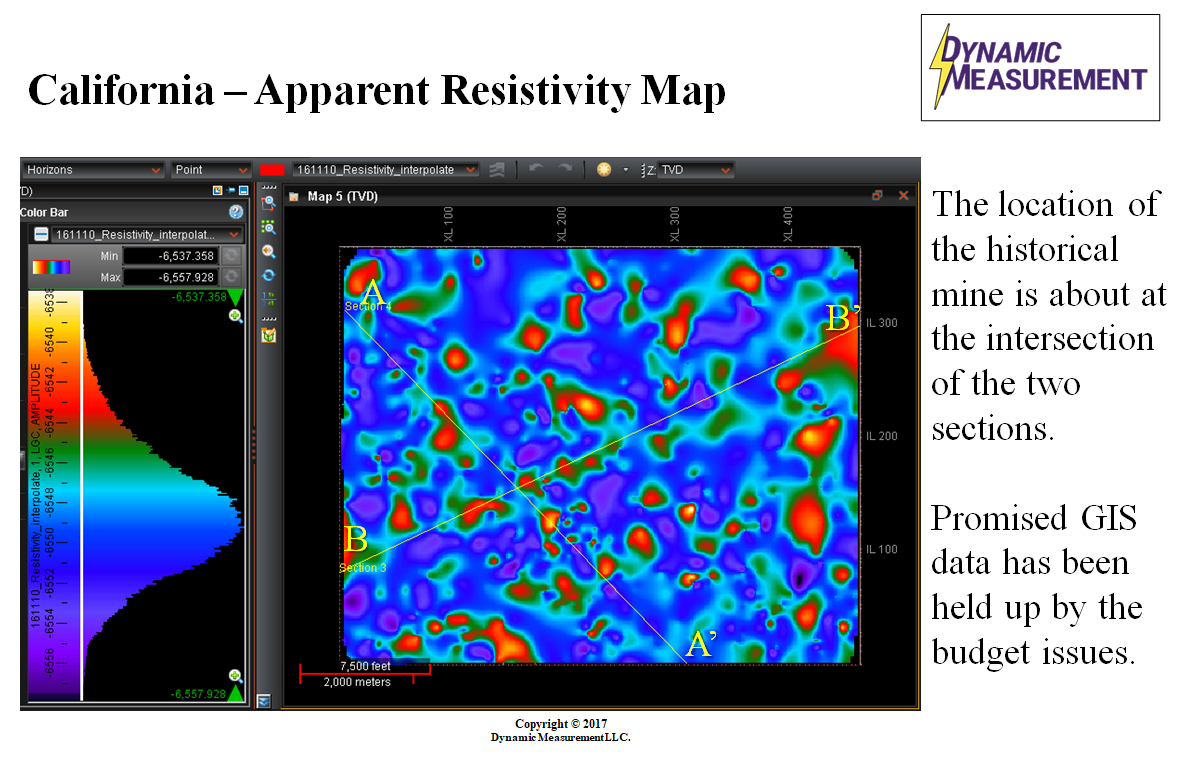
| Resistivity Map (note: "Maps" used and only one map shown ...) |
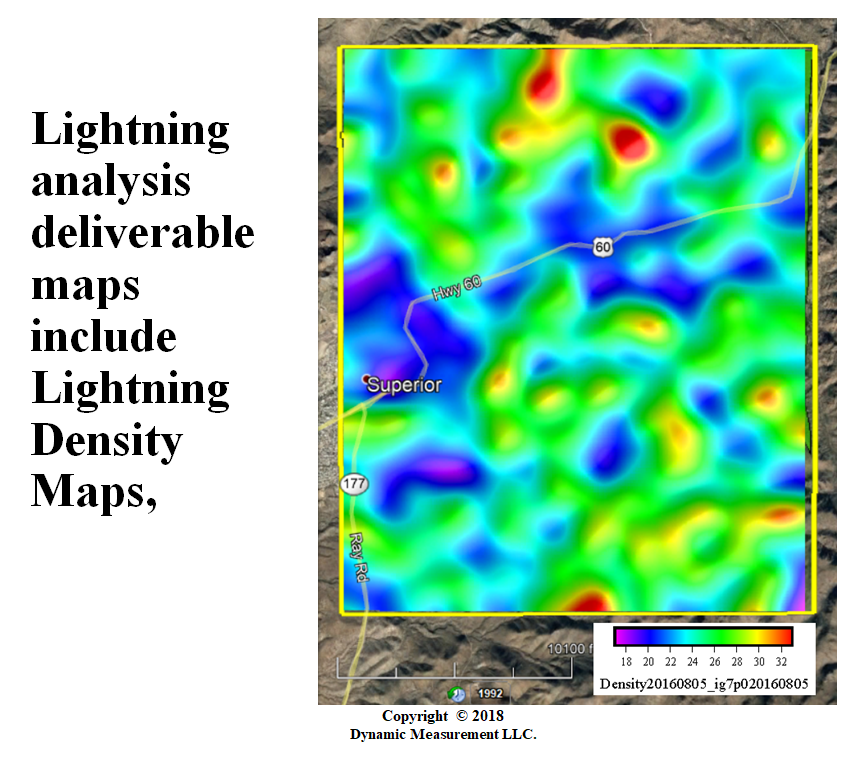
Density Map (... other maps in this series ...) |
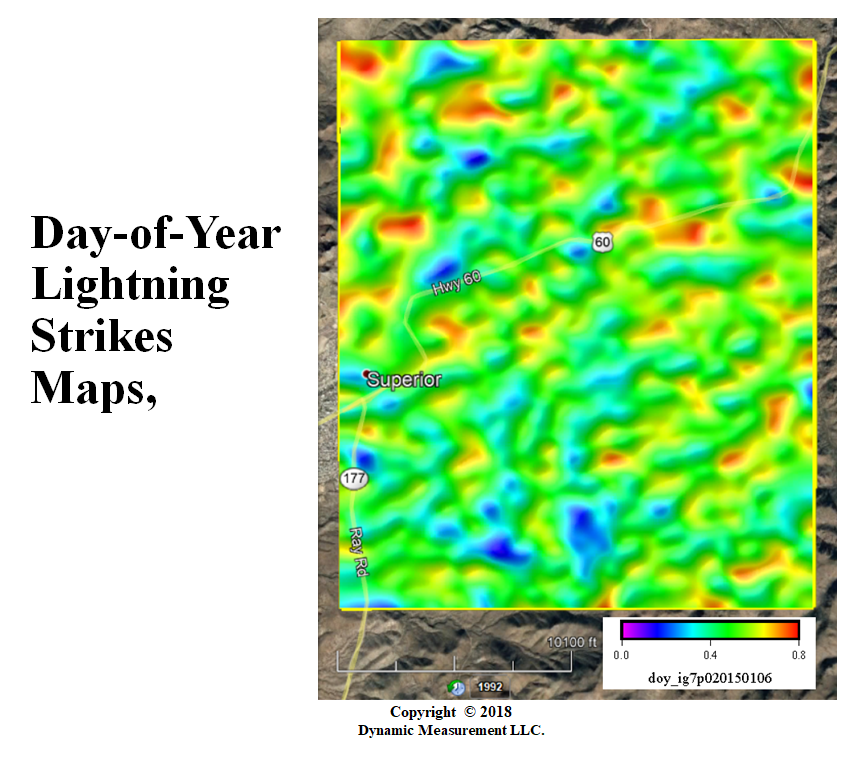
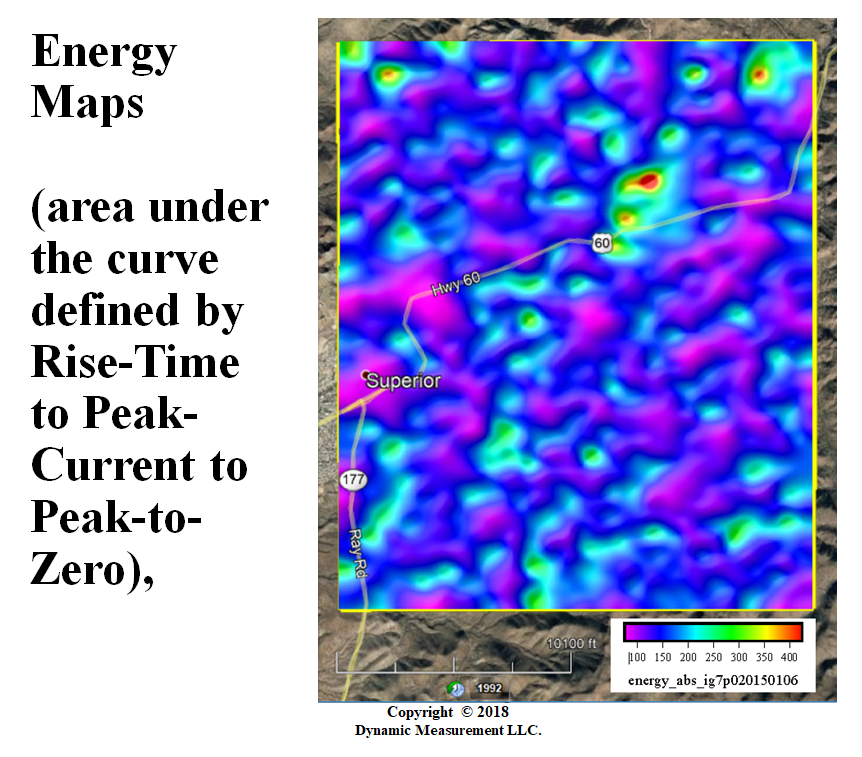
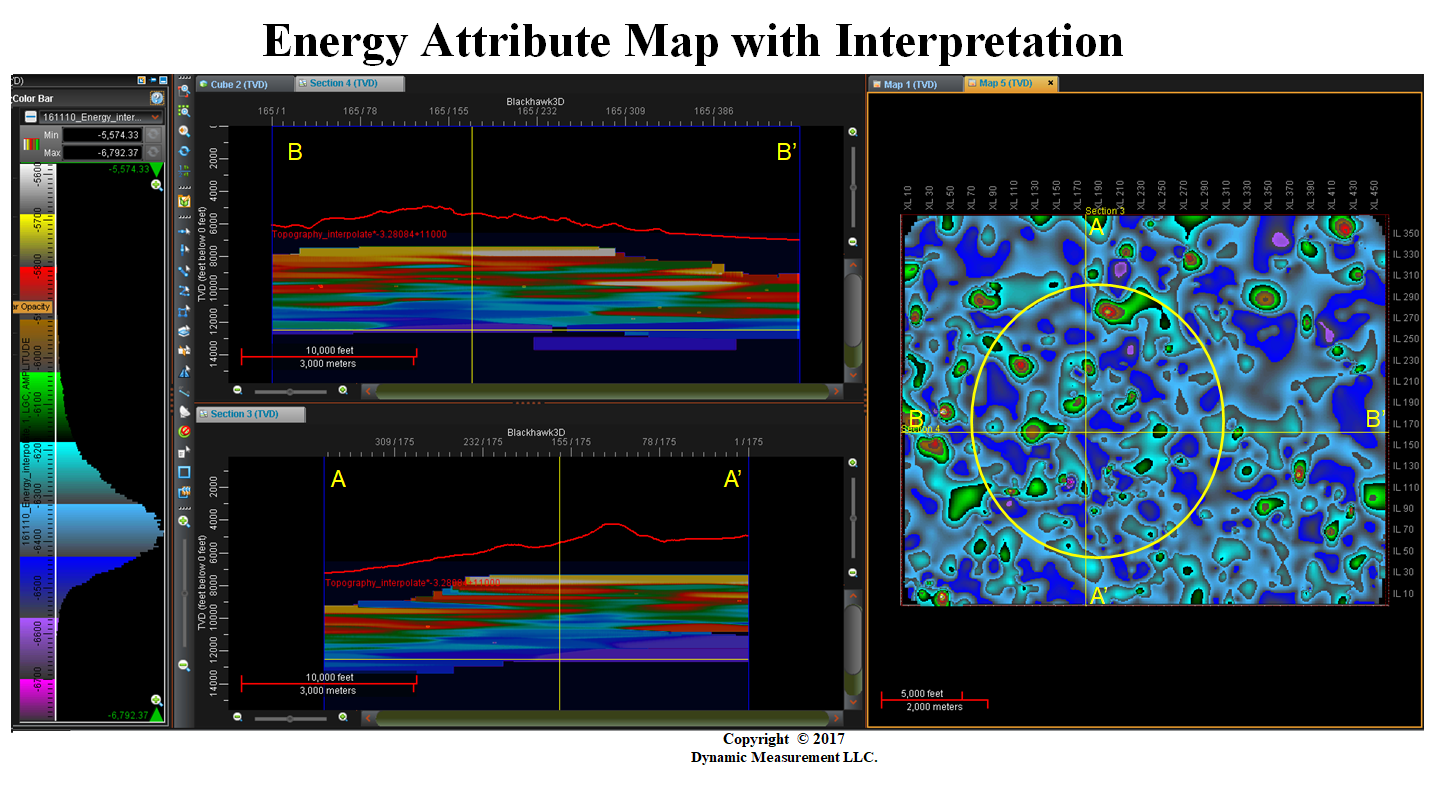
Day-of-Year Map (... had information priorprietary to ...) | Energy Map (... potential customer Rio Tinto ...) |
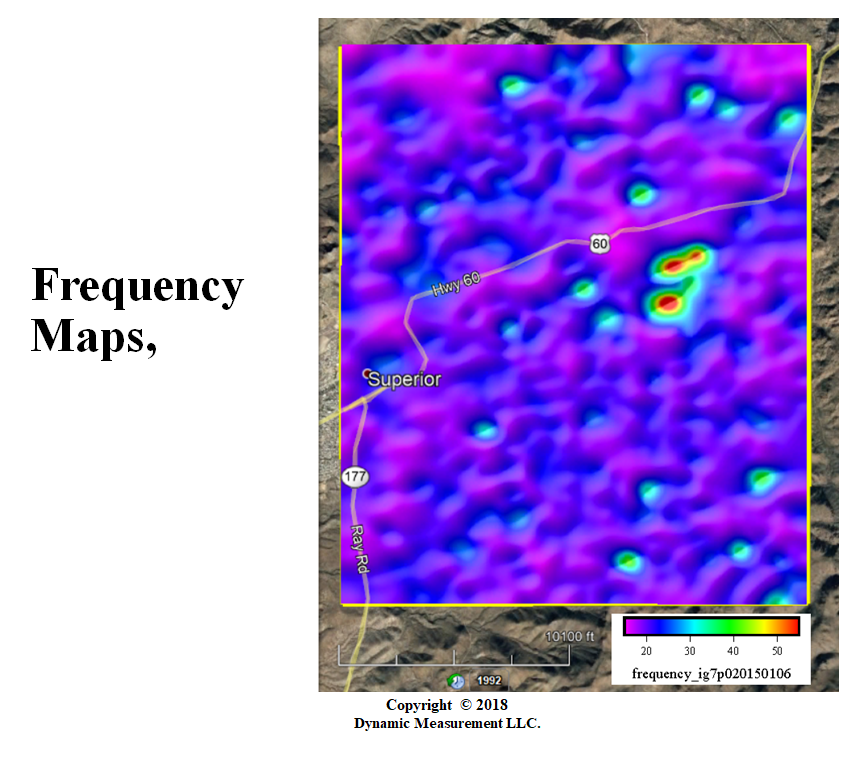
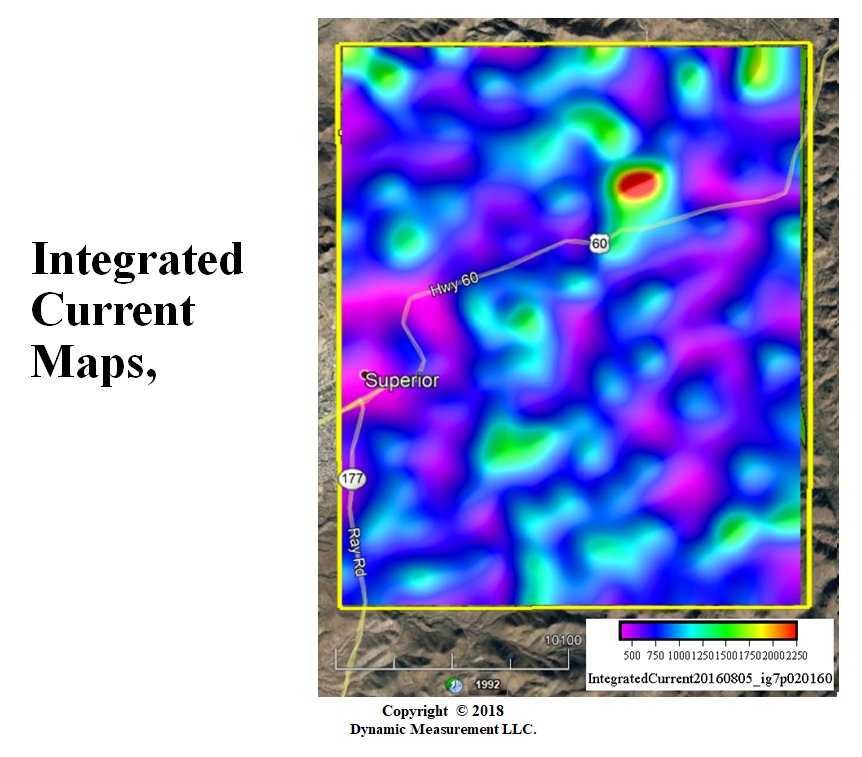
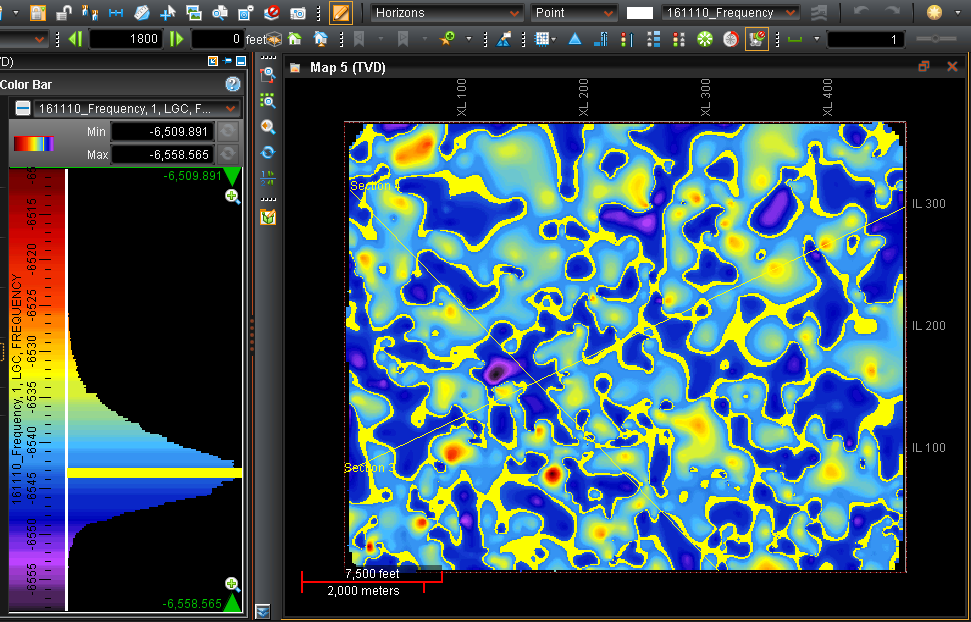
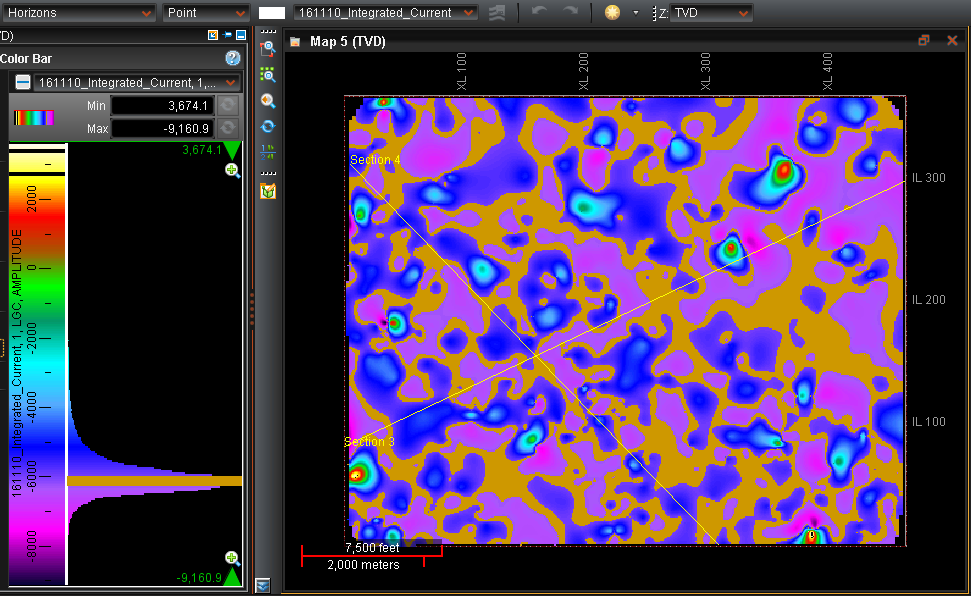
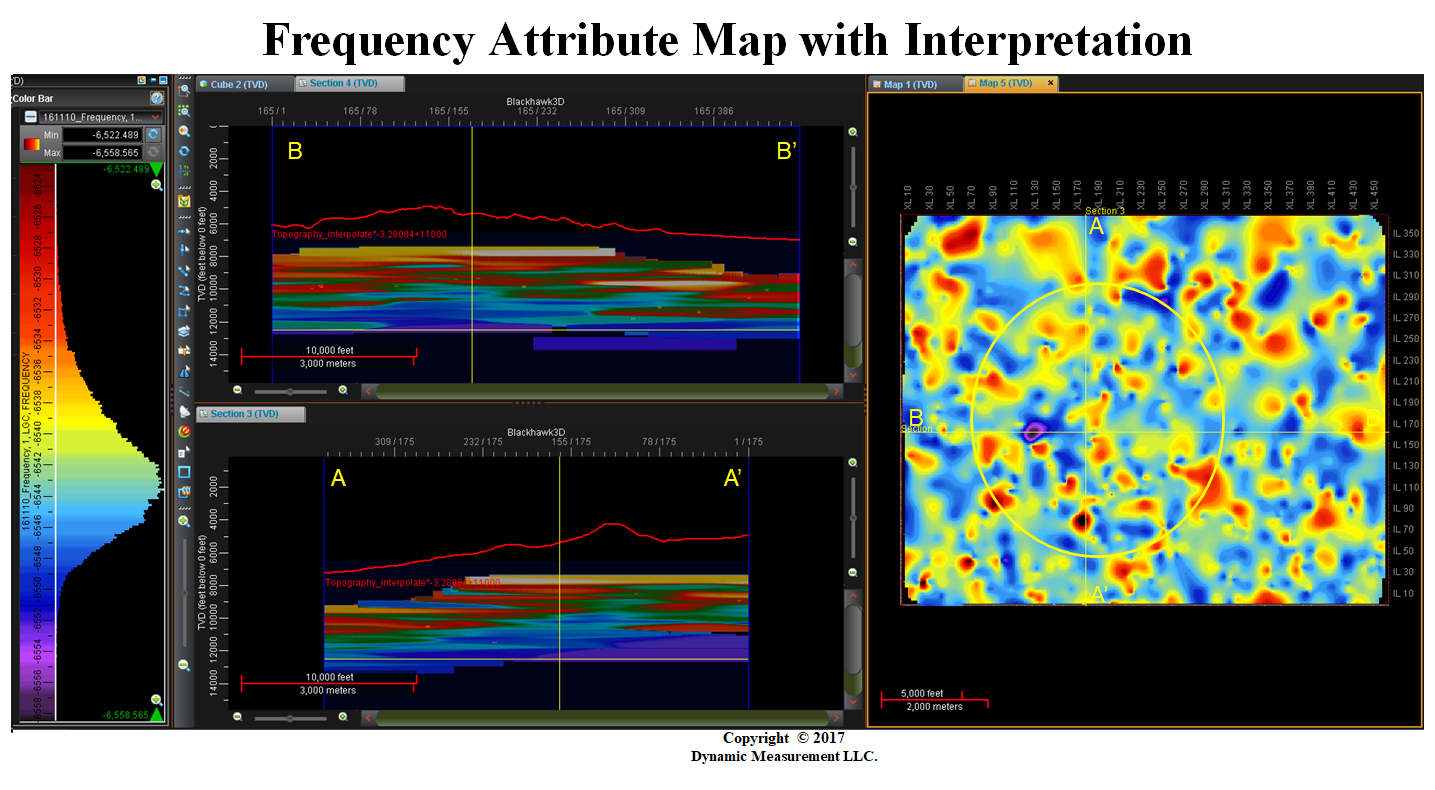
Frequency Map (... who owns Resolution Copper.) | Integrated Current Map, note how well this and the next attribute ... |
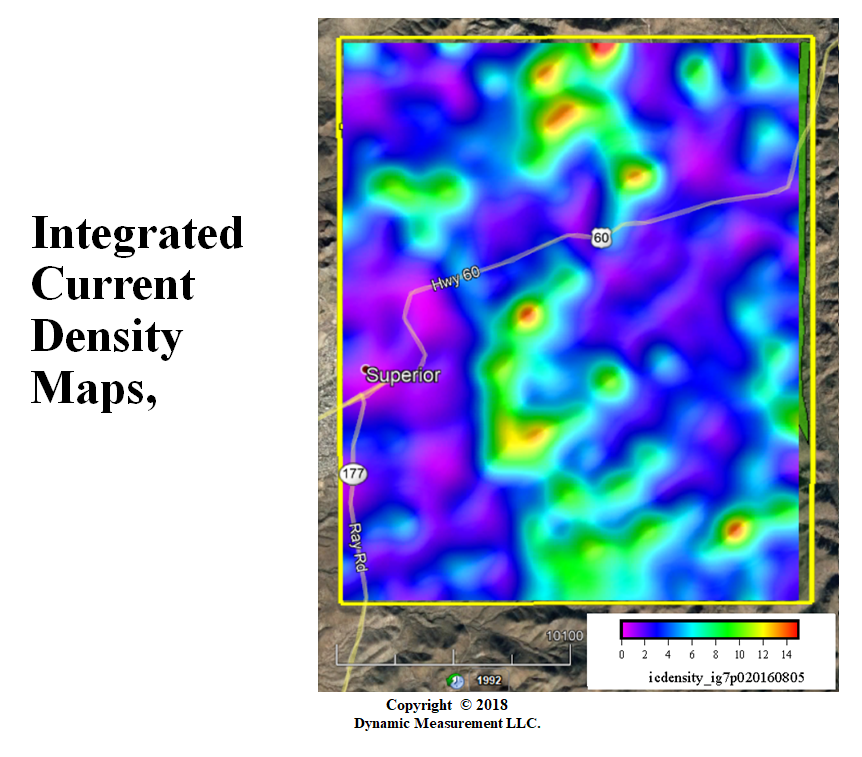
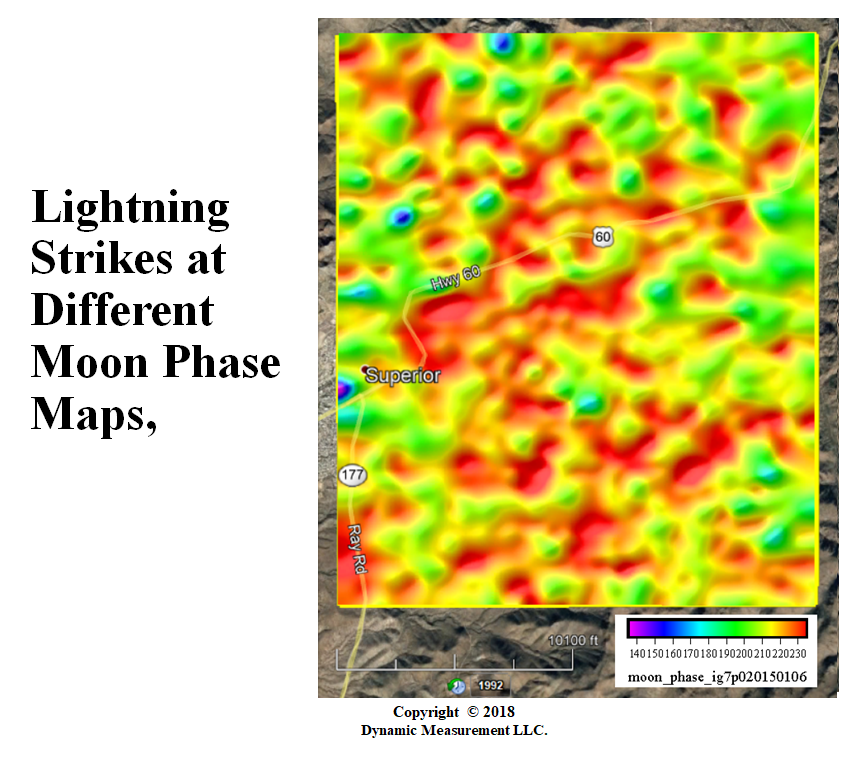
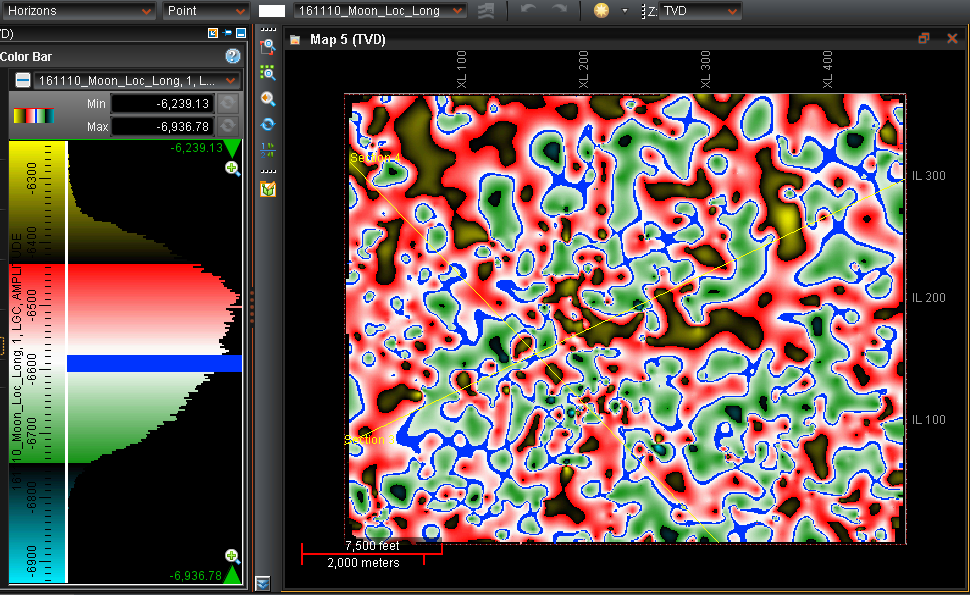
Integregrated Current Density Map, ... identify Apache Ridge | Lightning Strikes at different phases of the Moon |
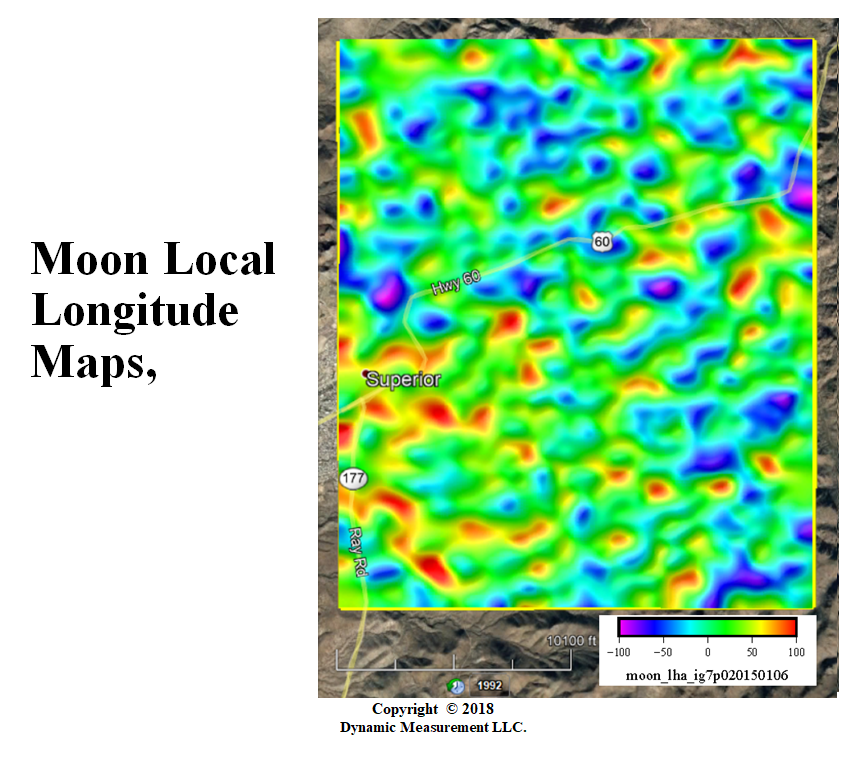
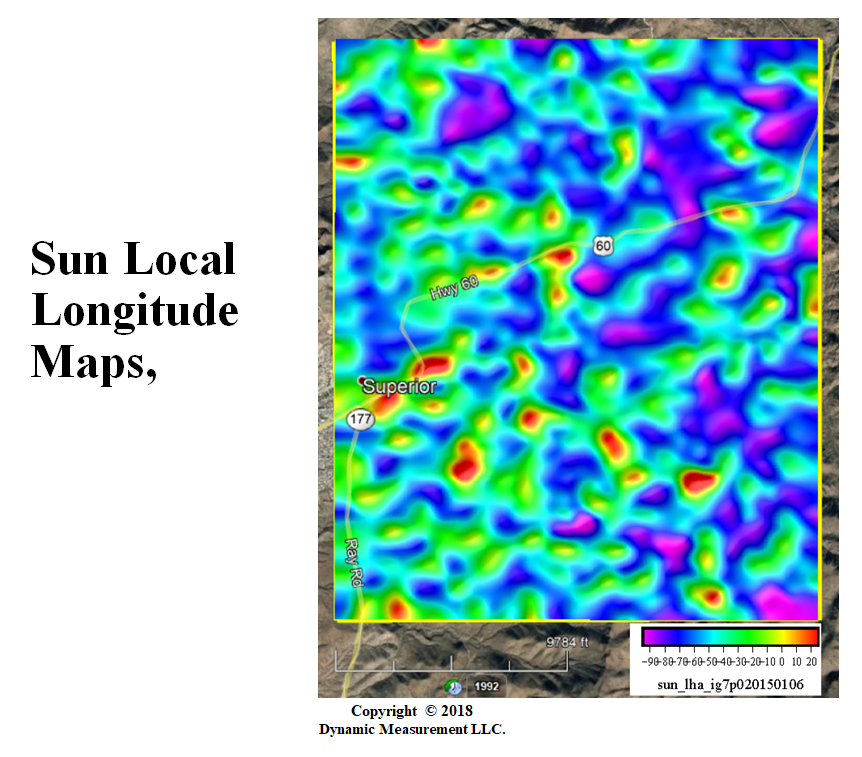
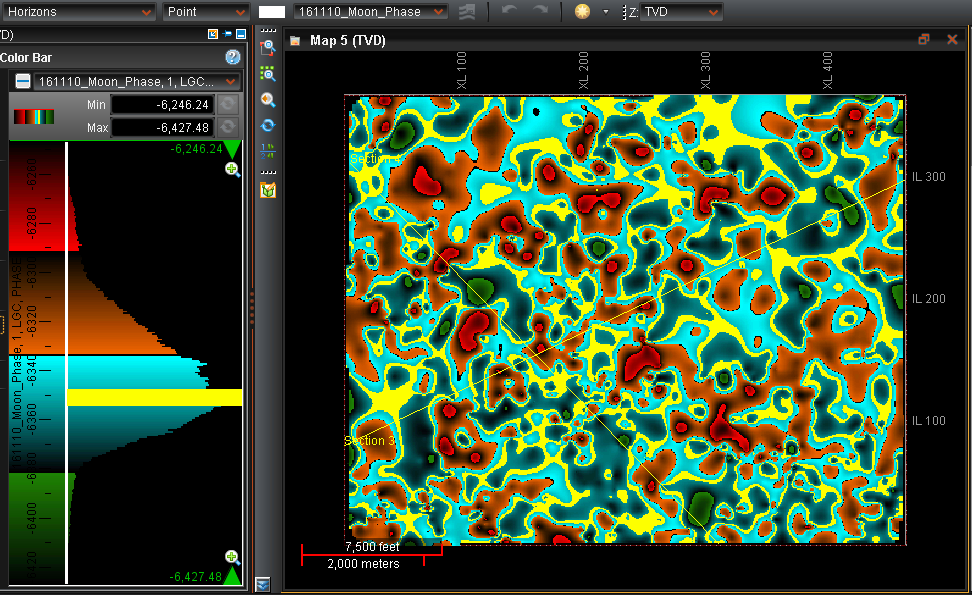
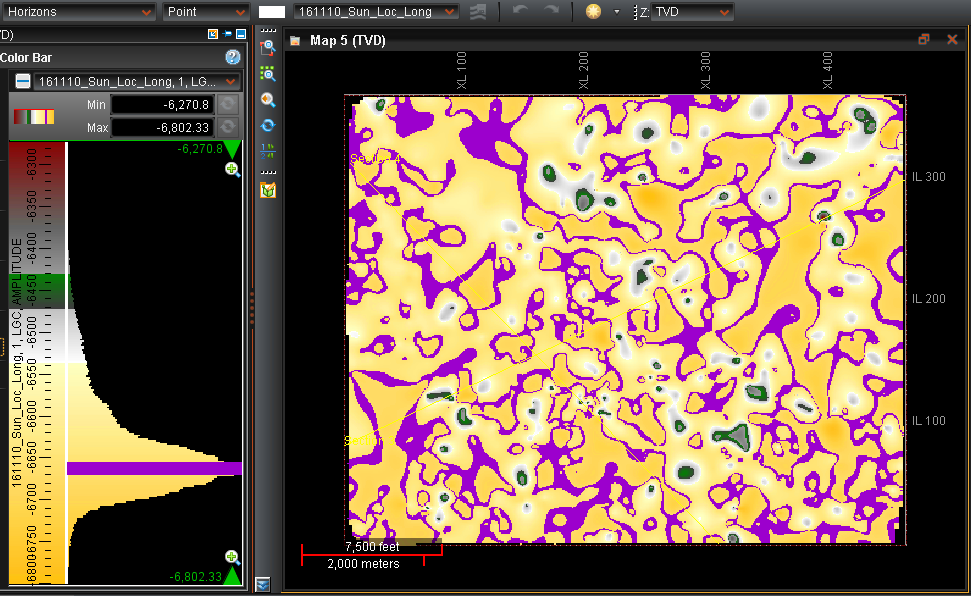
Lightning Strikes when Moon at different Local Longitudes | Lightning Strikes when Sun at different Local Longitudes |
 |
 |
 |
 |
 |
 |
 |
 |
 |
 |
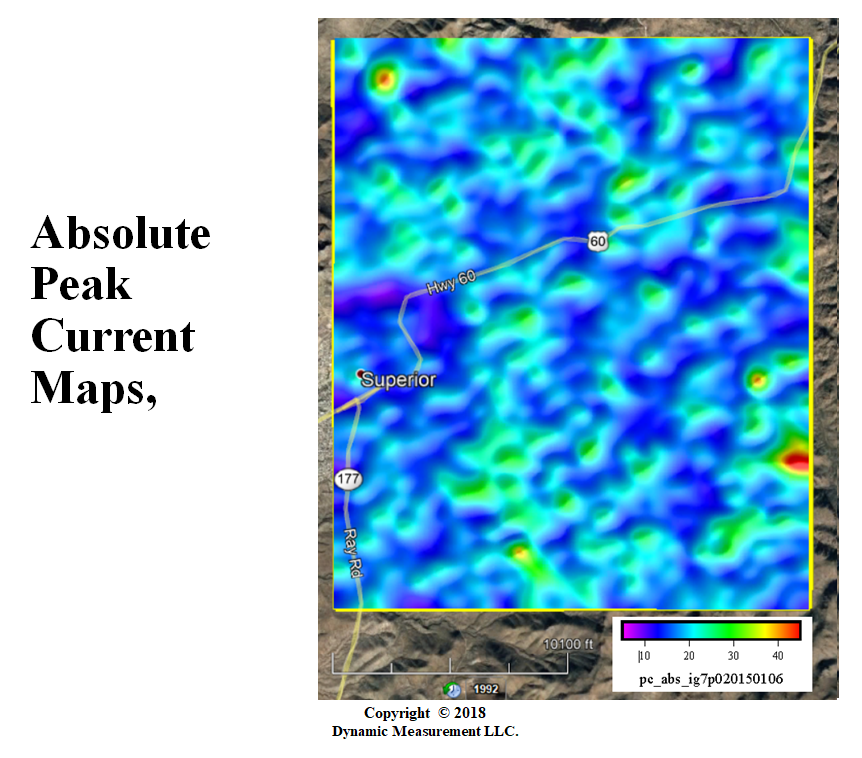
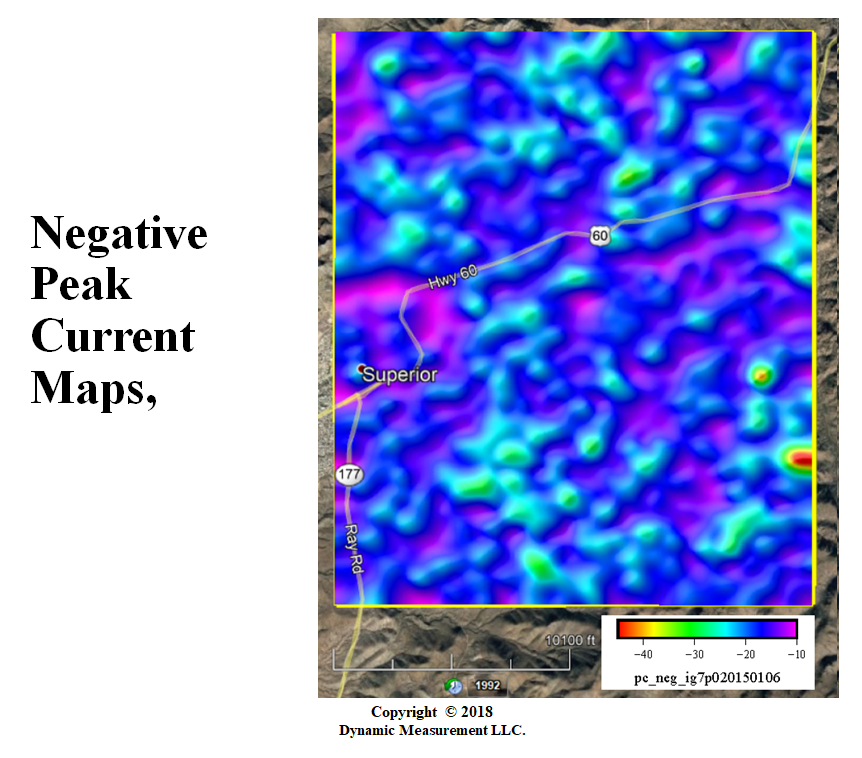
| Absolute Peak Current Map | Negative Peak Current Map |
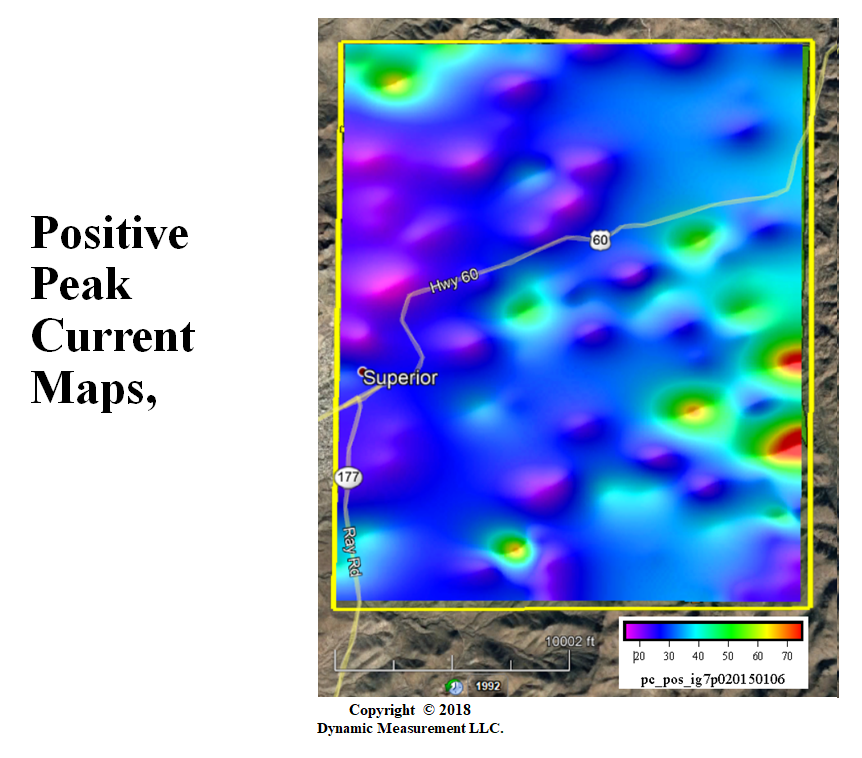
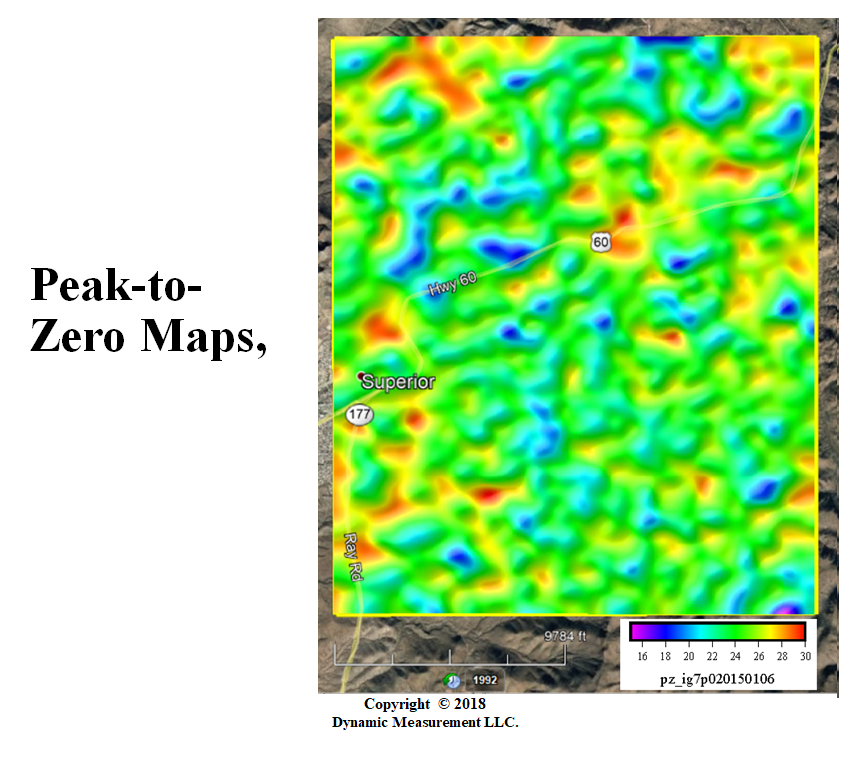
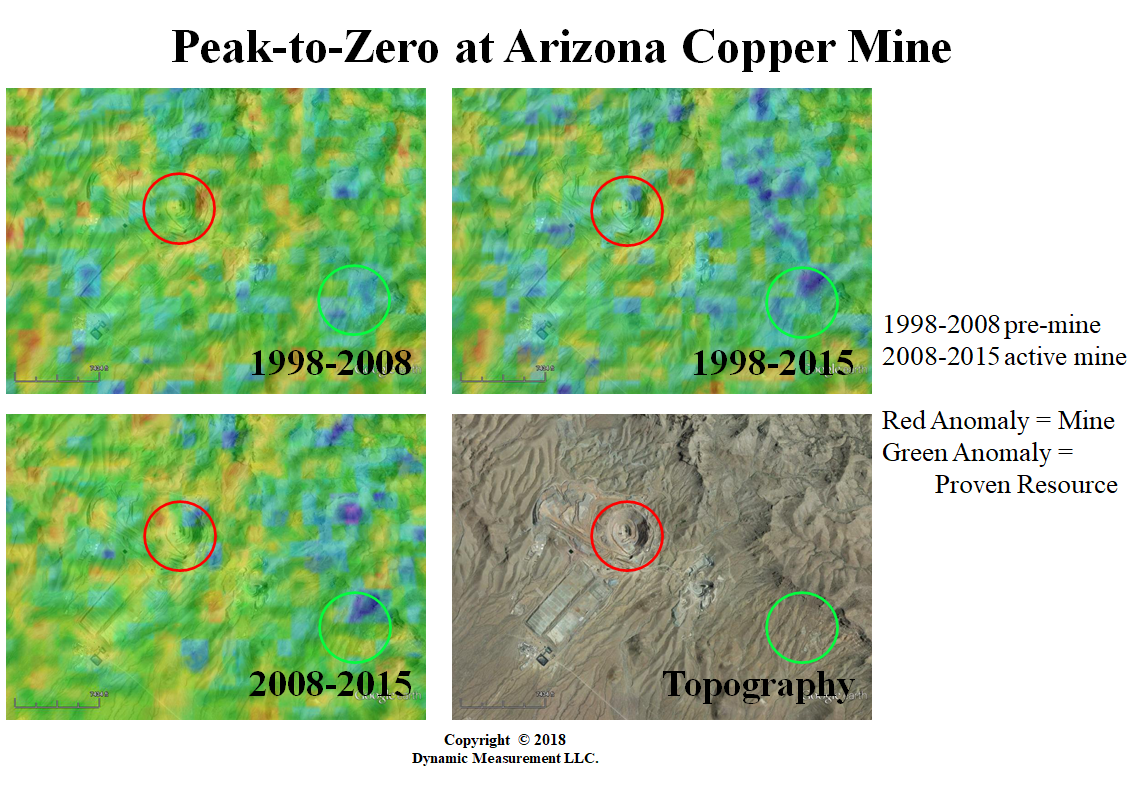
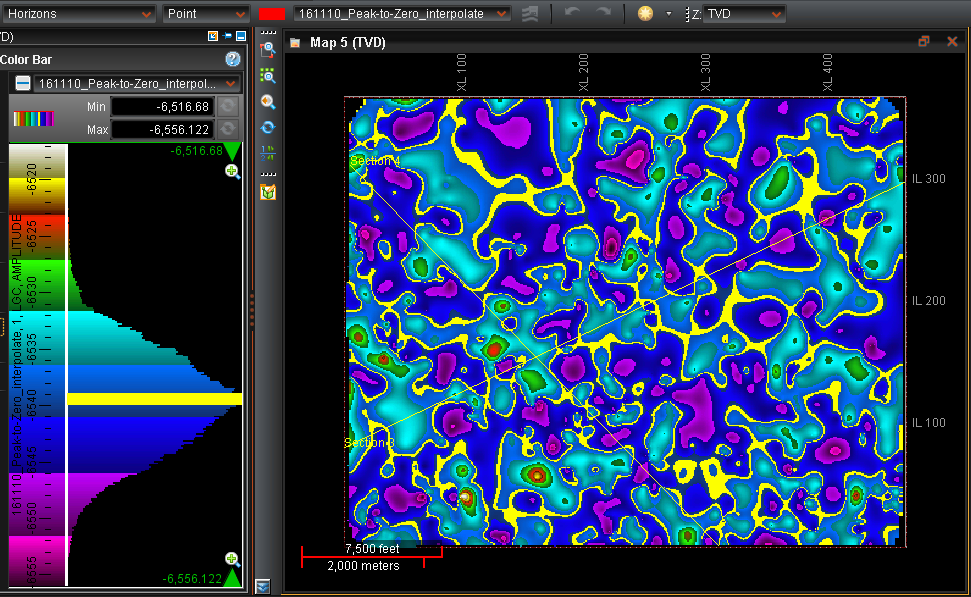
Positive Peak Current Map | Peak-to-Zero Map |
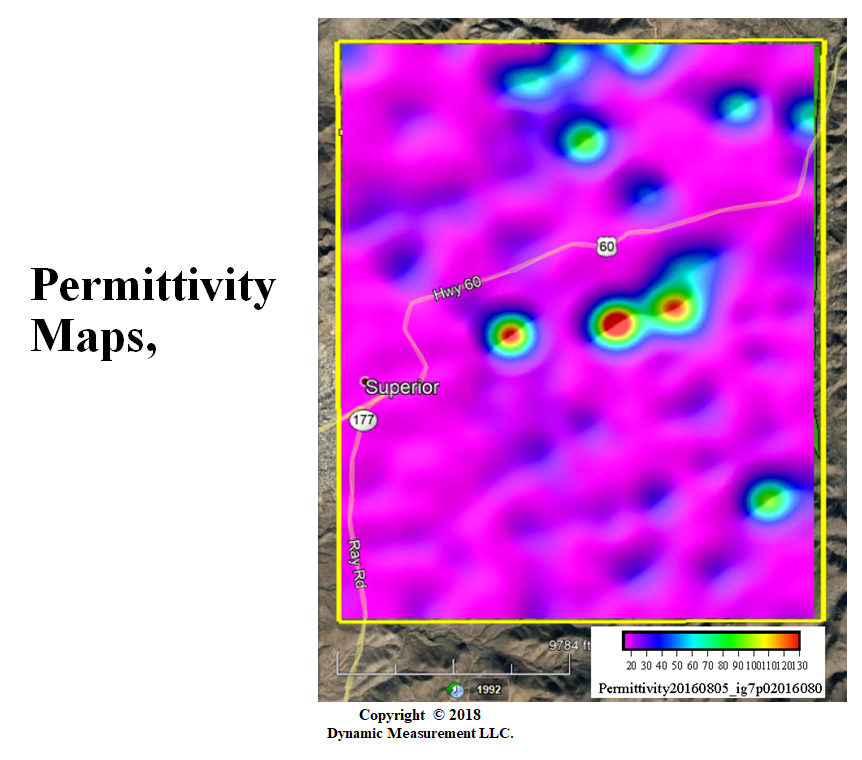
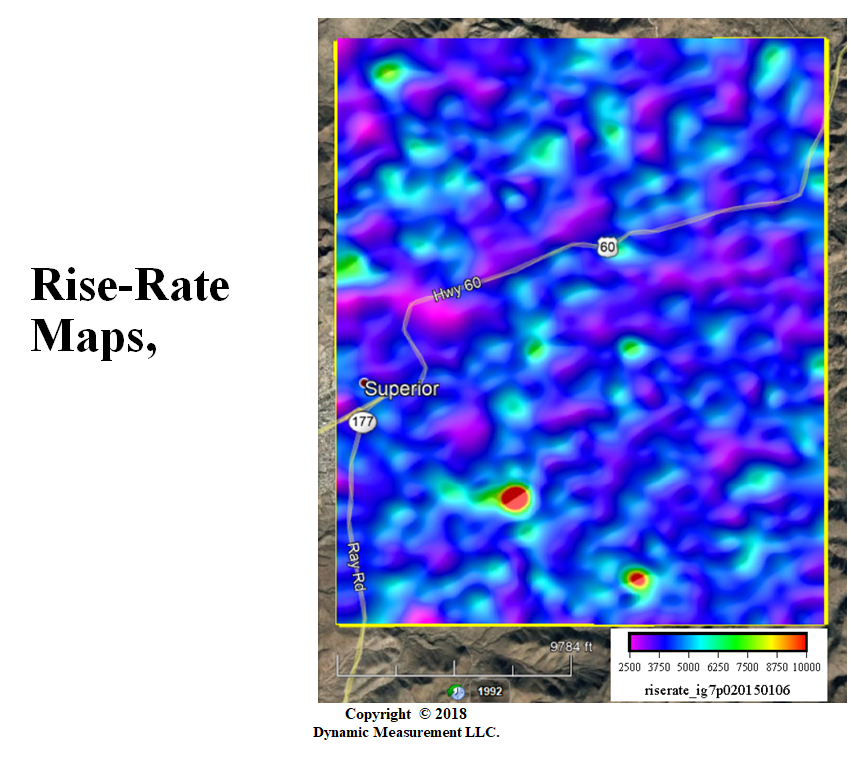
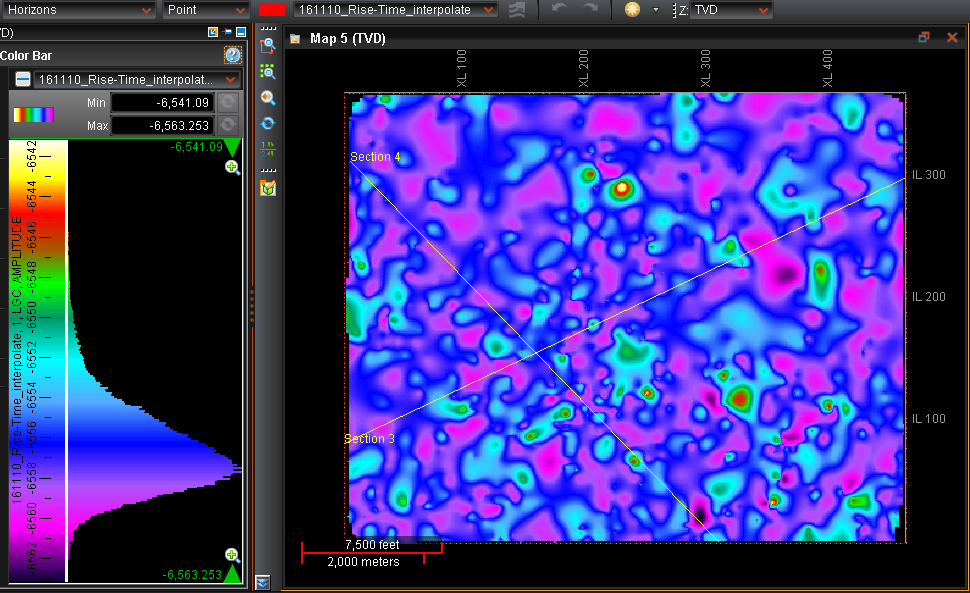
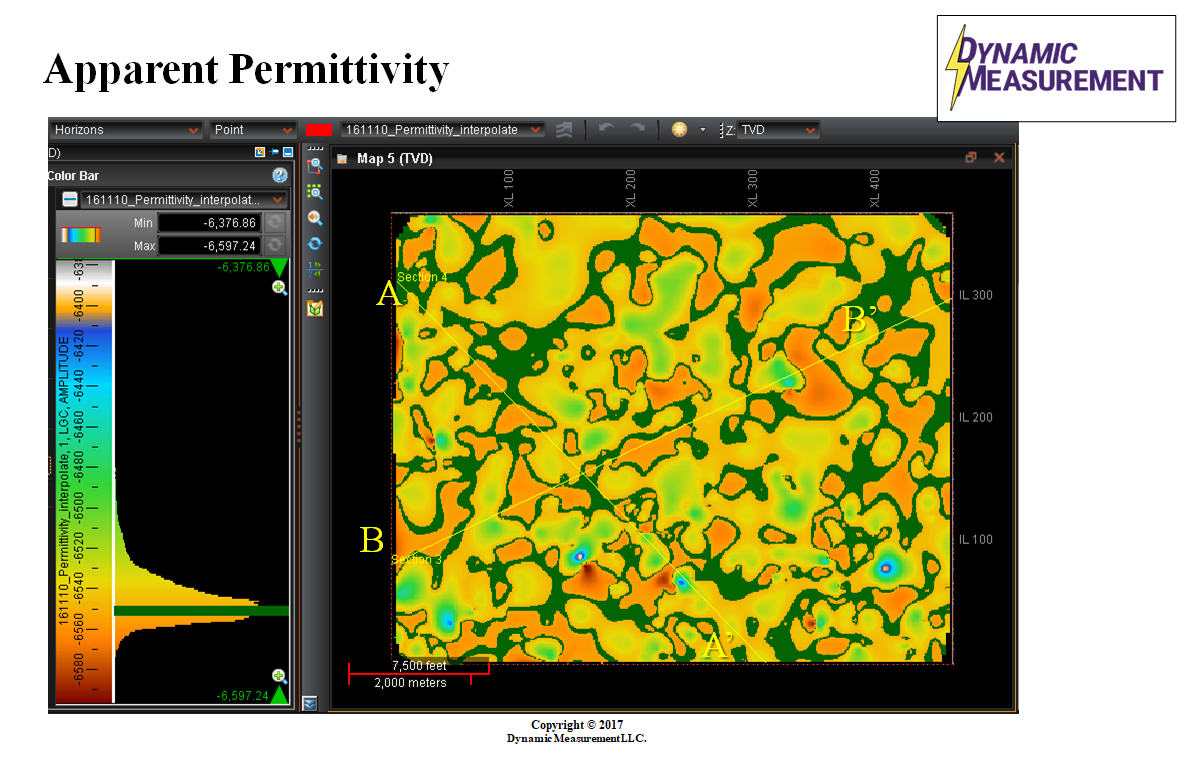
Permitivity Map | Rate of Rise-Time Map |
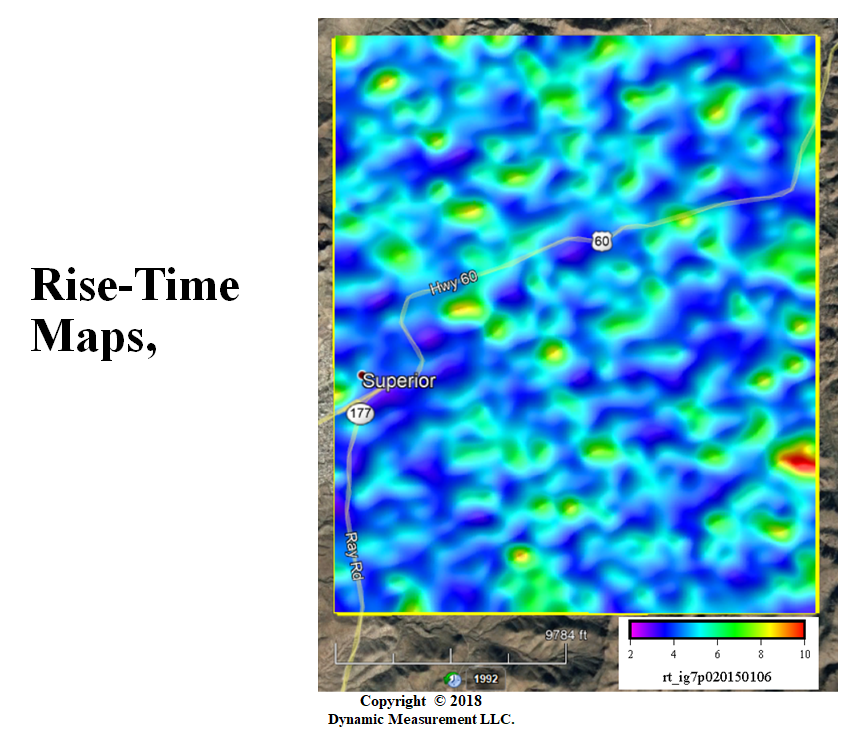
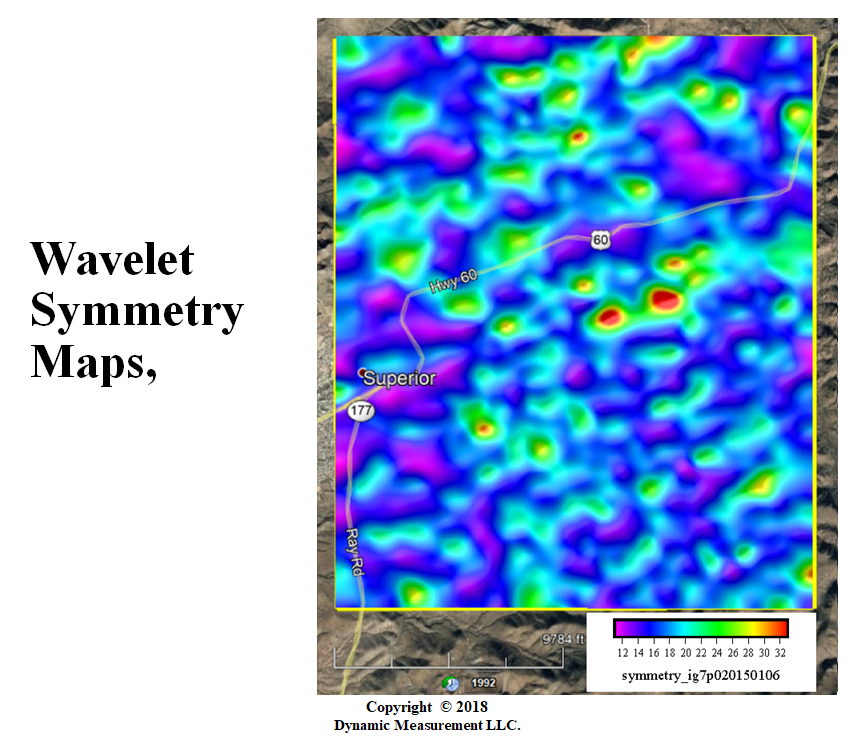
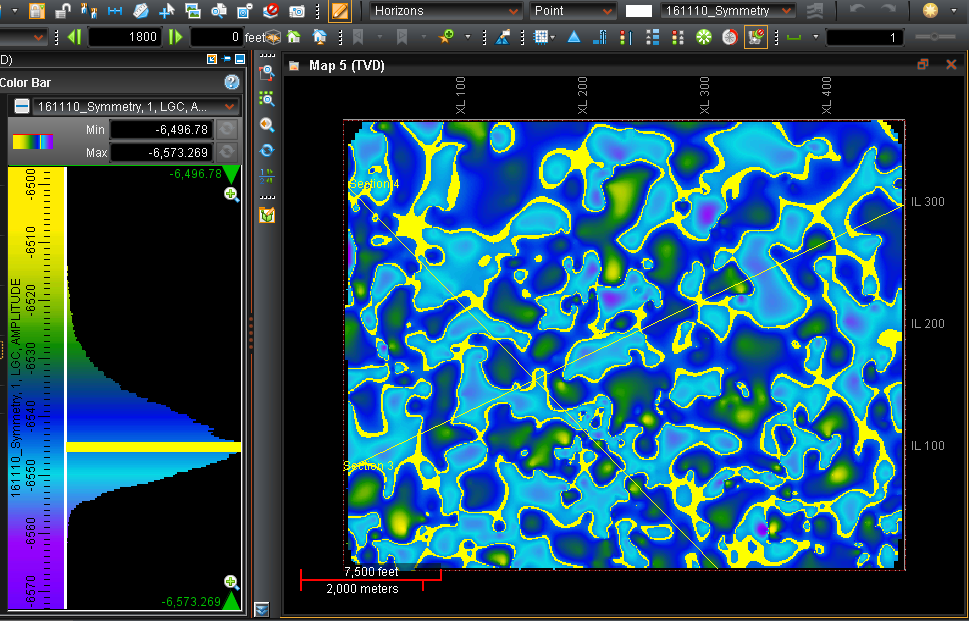
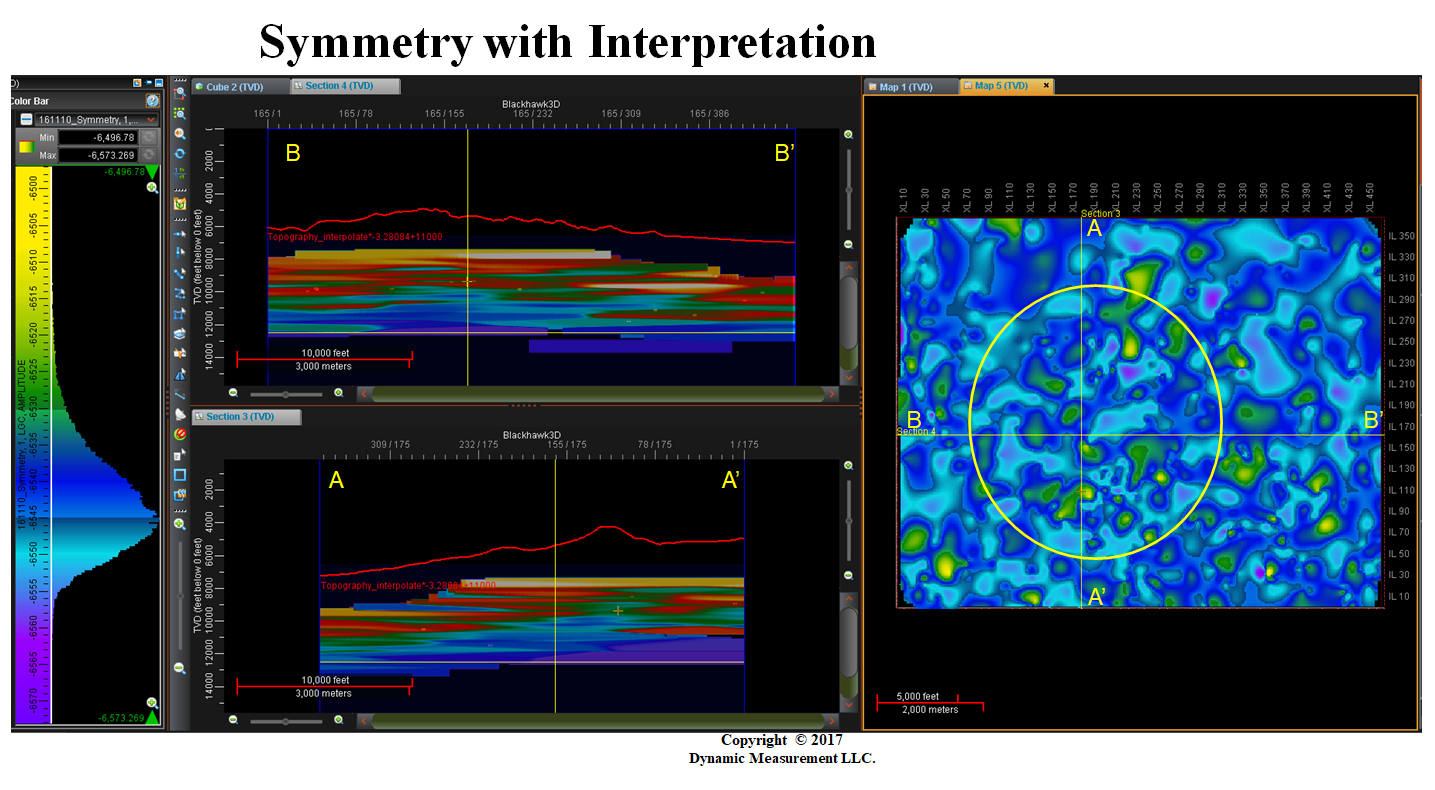
Rise-Time Map | Wavelet Symmetry Map |
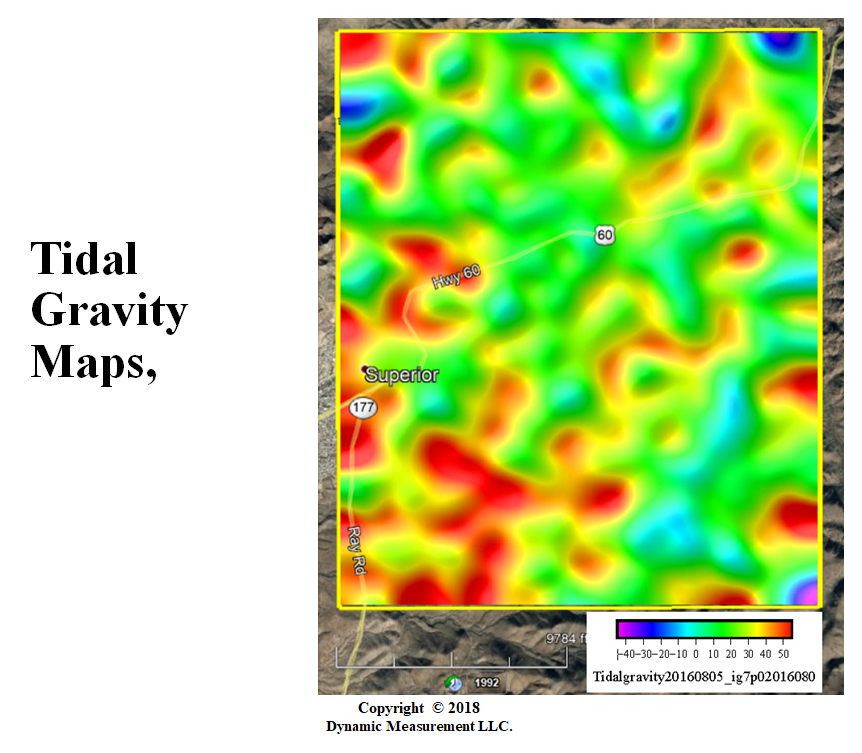
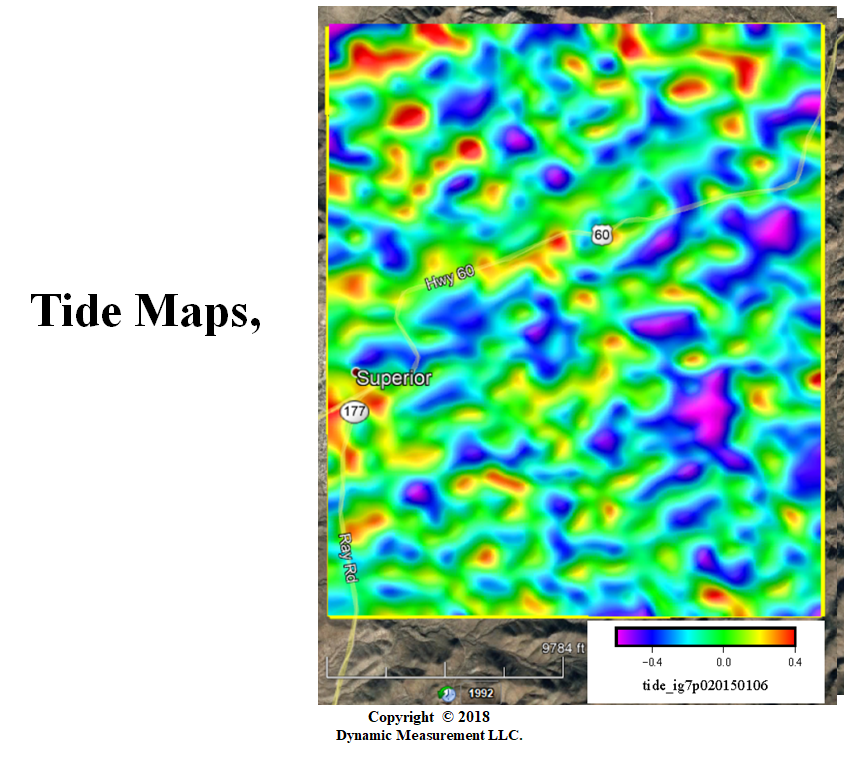
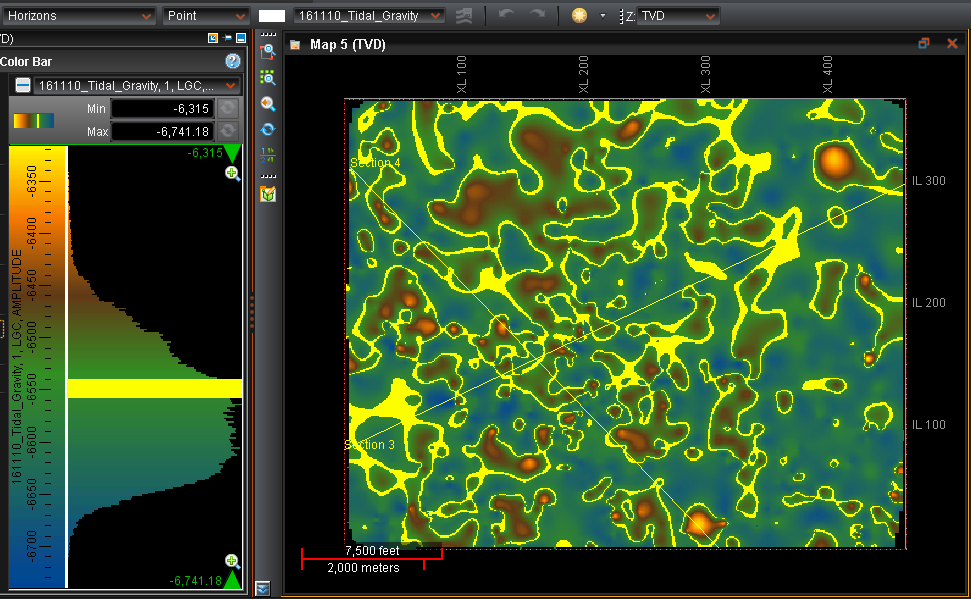
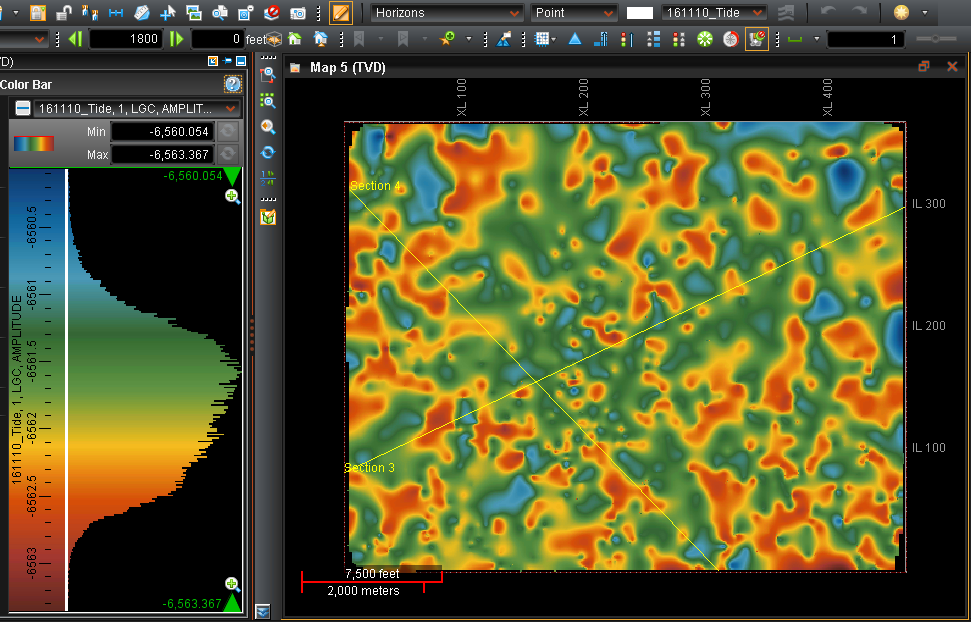
Tidal Gravity Map | Lightning Strikes at Moon Tides |
 |
 |
 |
 |
 |
 |
 |
 |
|
 |
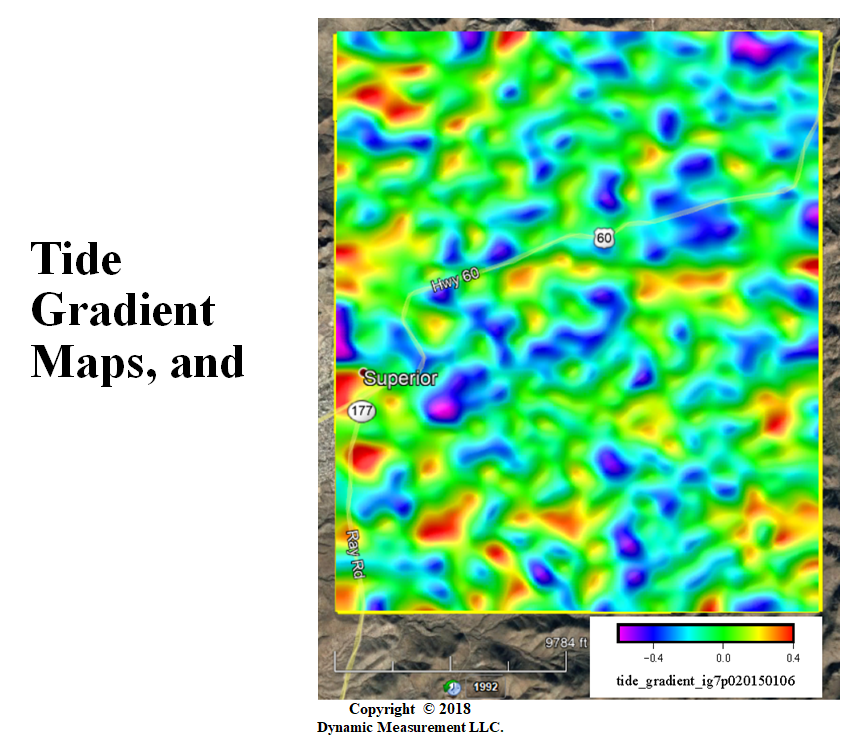
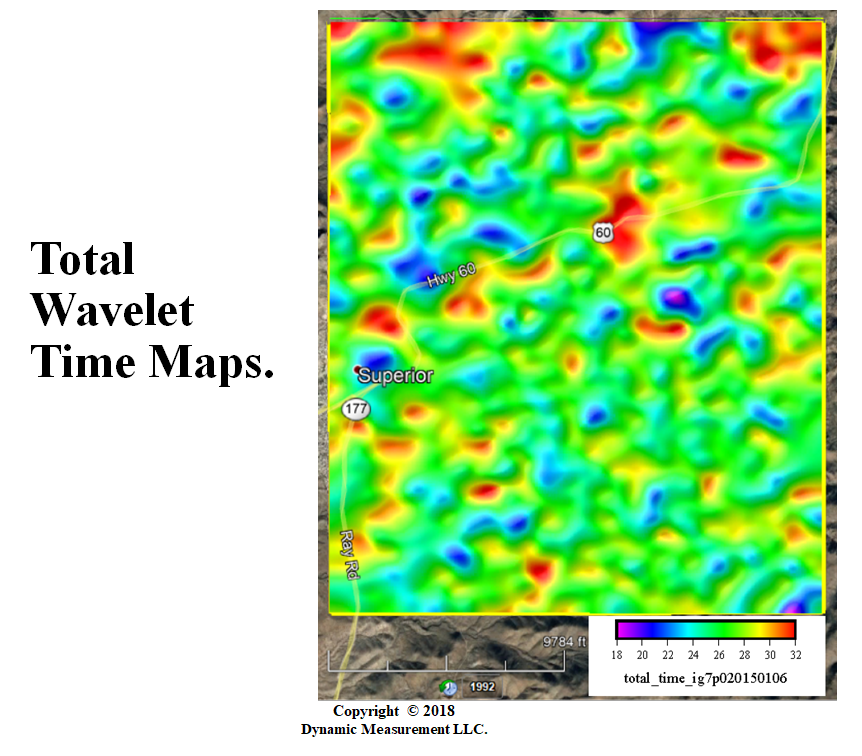
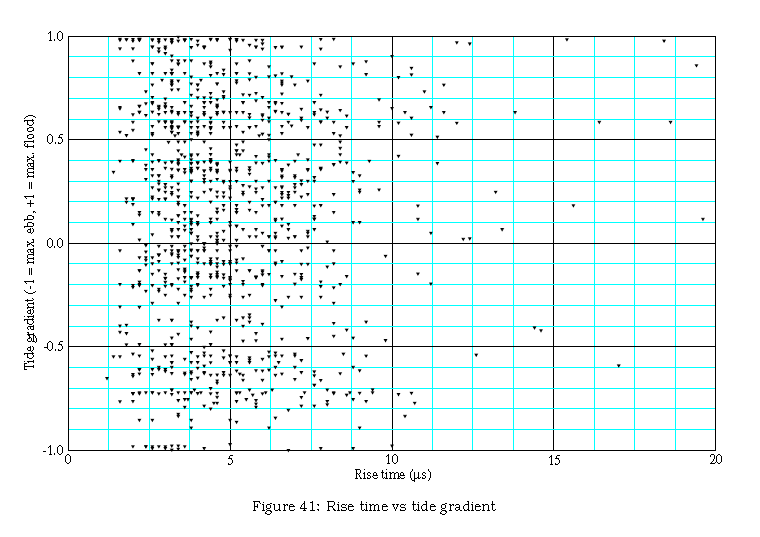
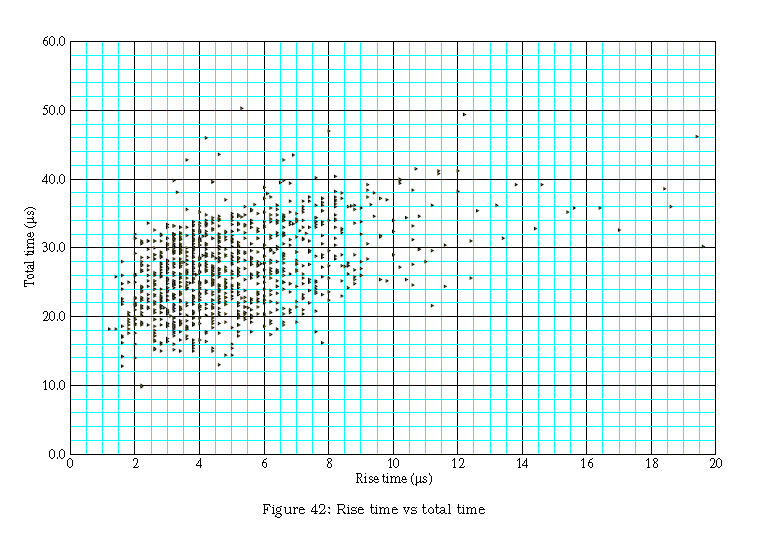
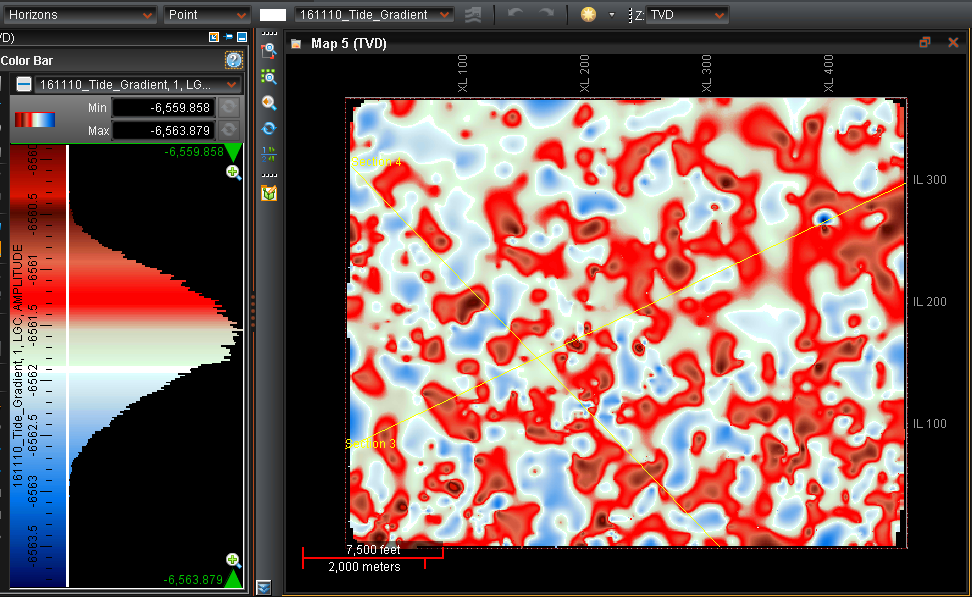
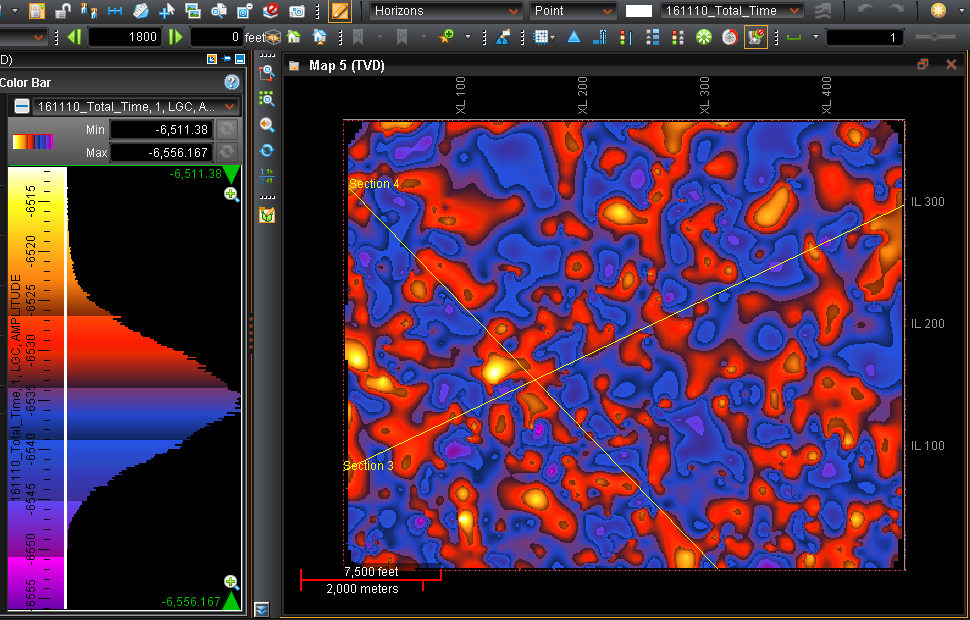
| Tide Gradient Map | Total Wavelet Time Maps |
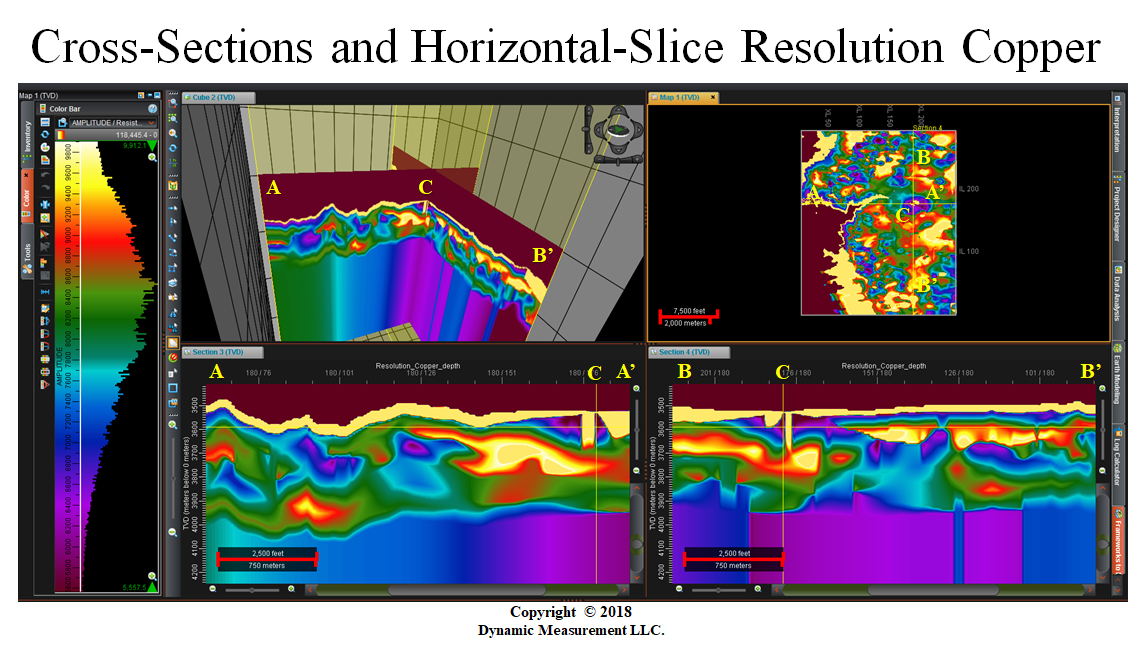
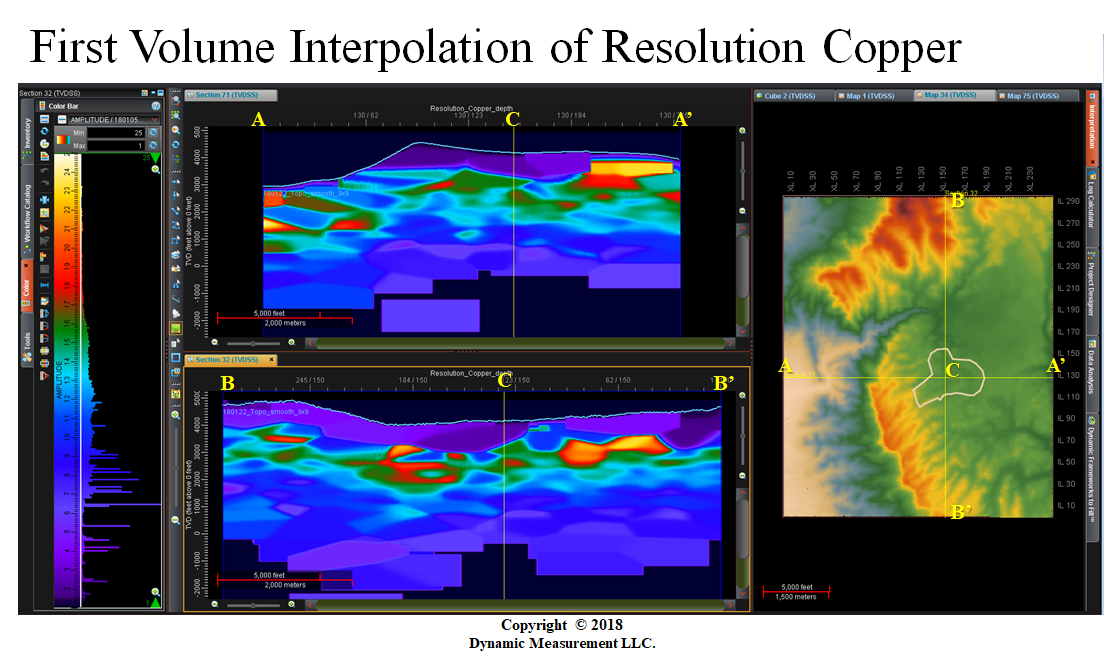
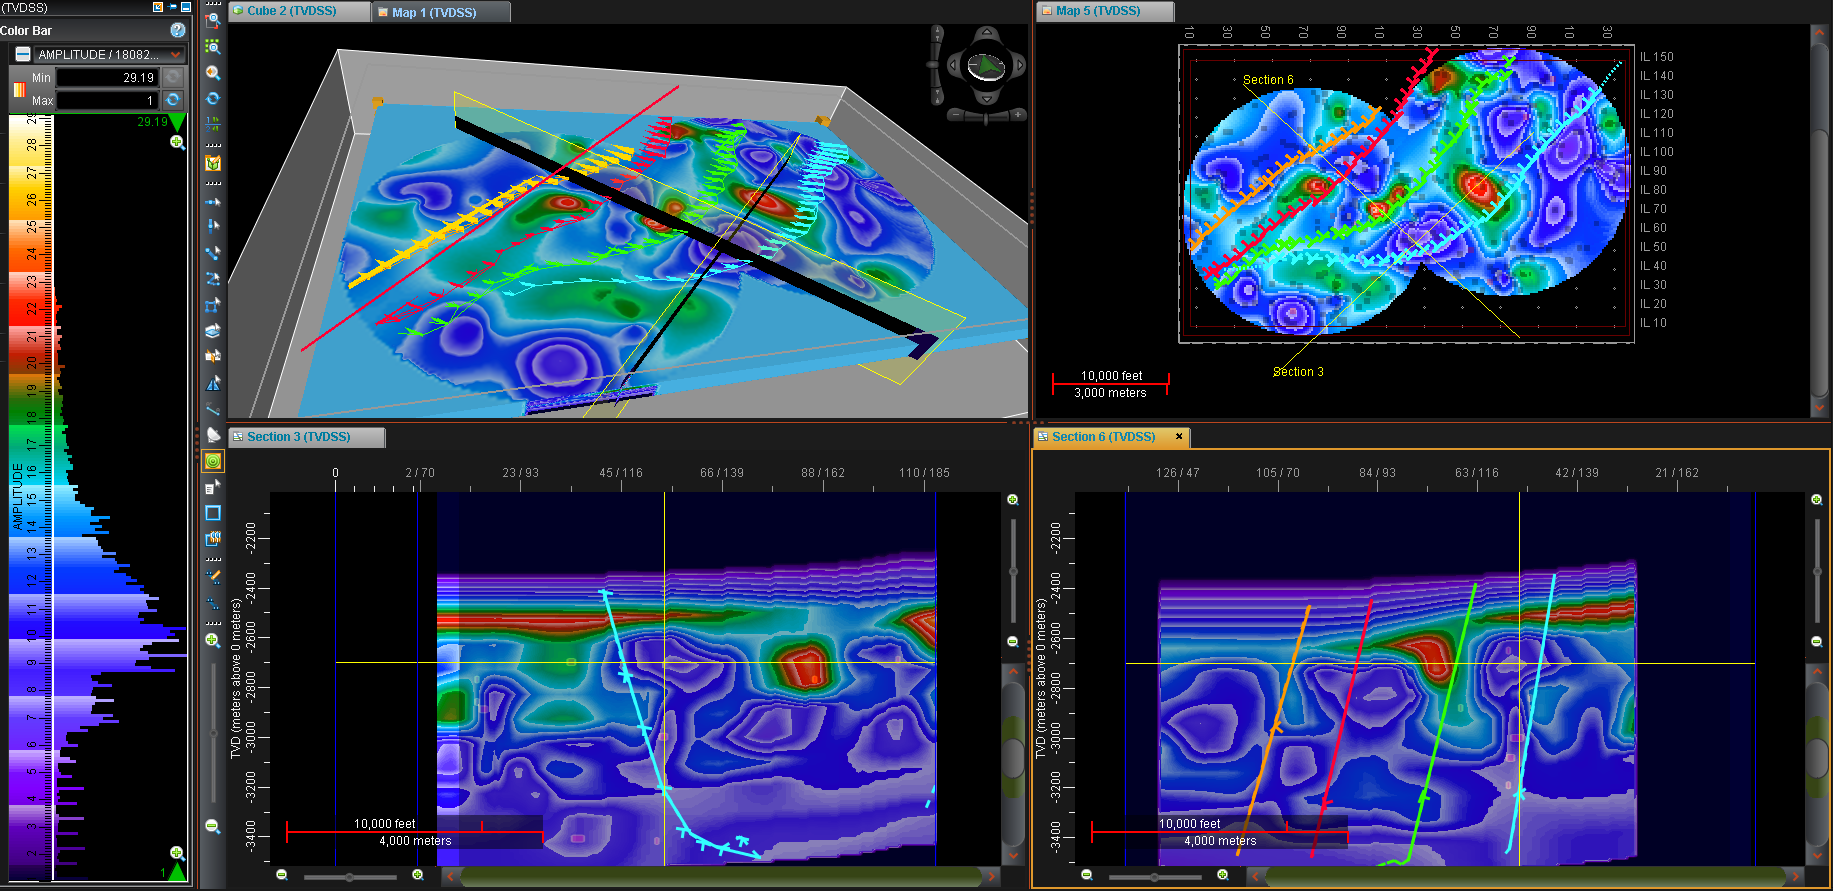
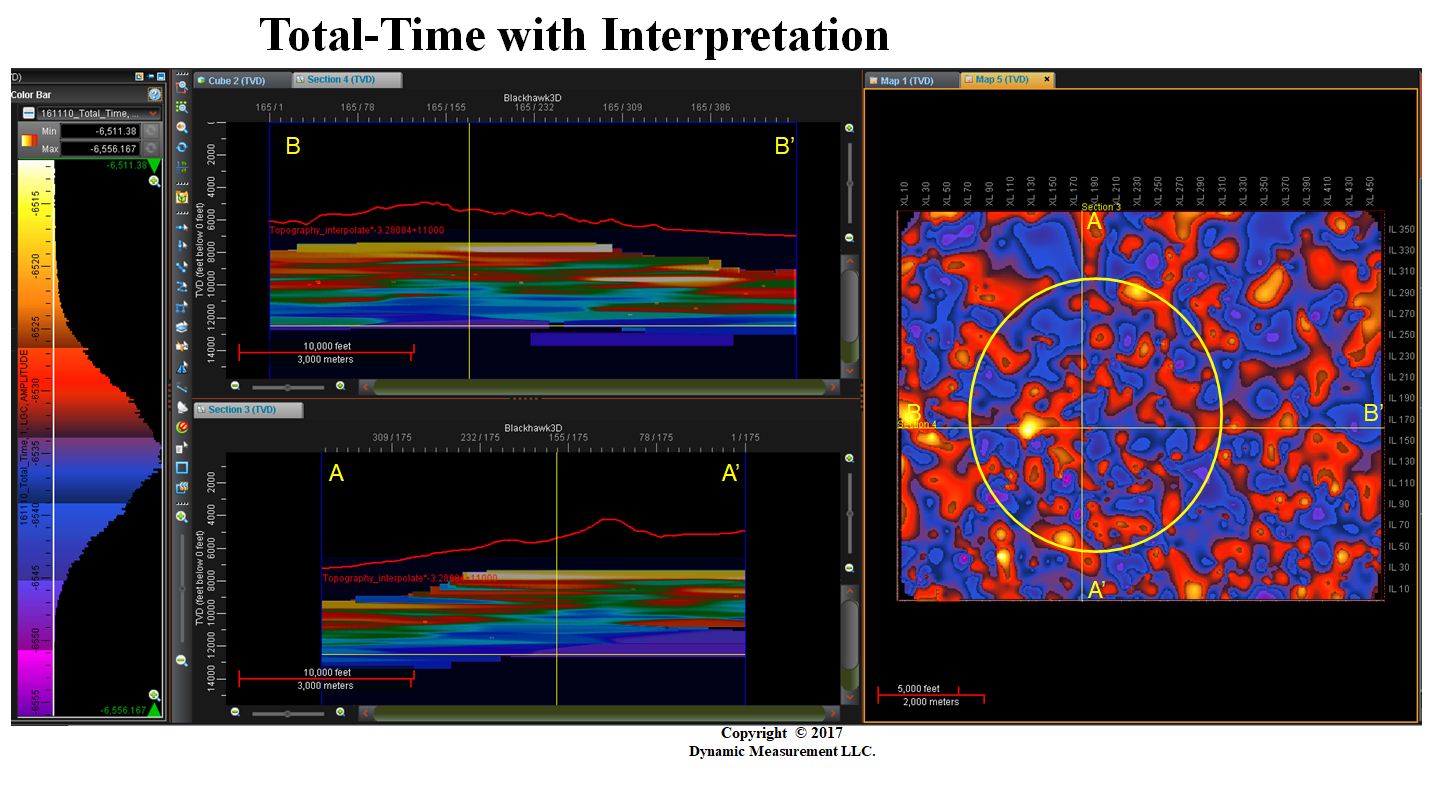
Cross-Sections & Horizontal-Slice through Mine | 1st Interpolation E-W and N-S Cross-Sections |
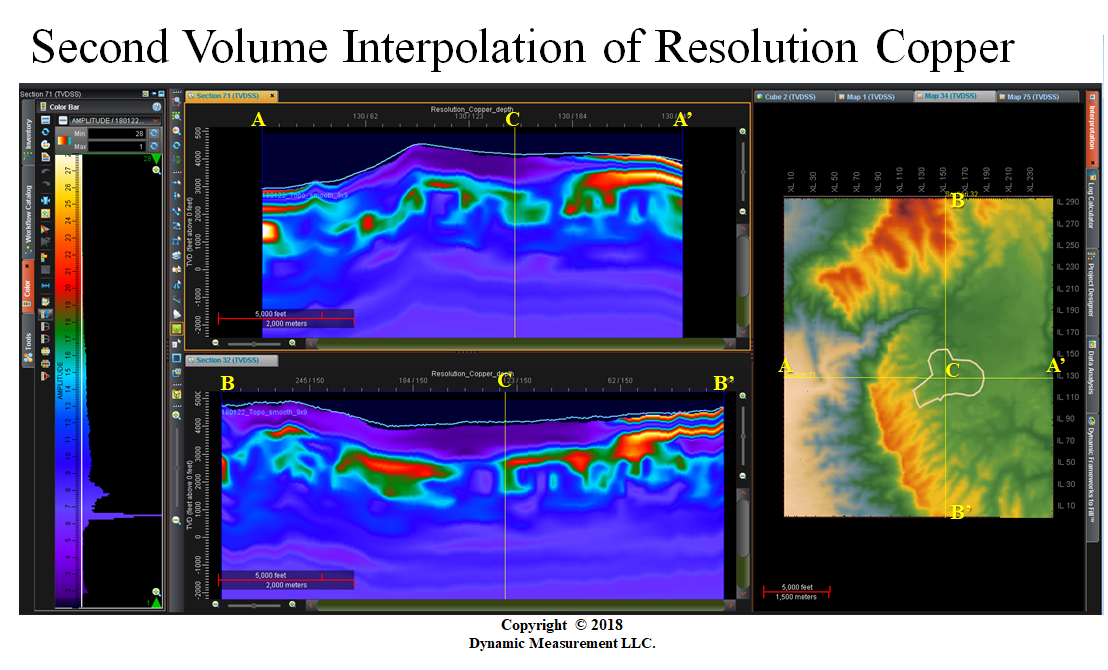
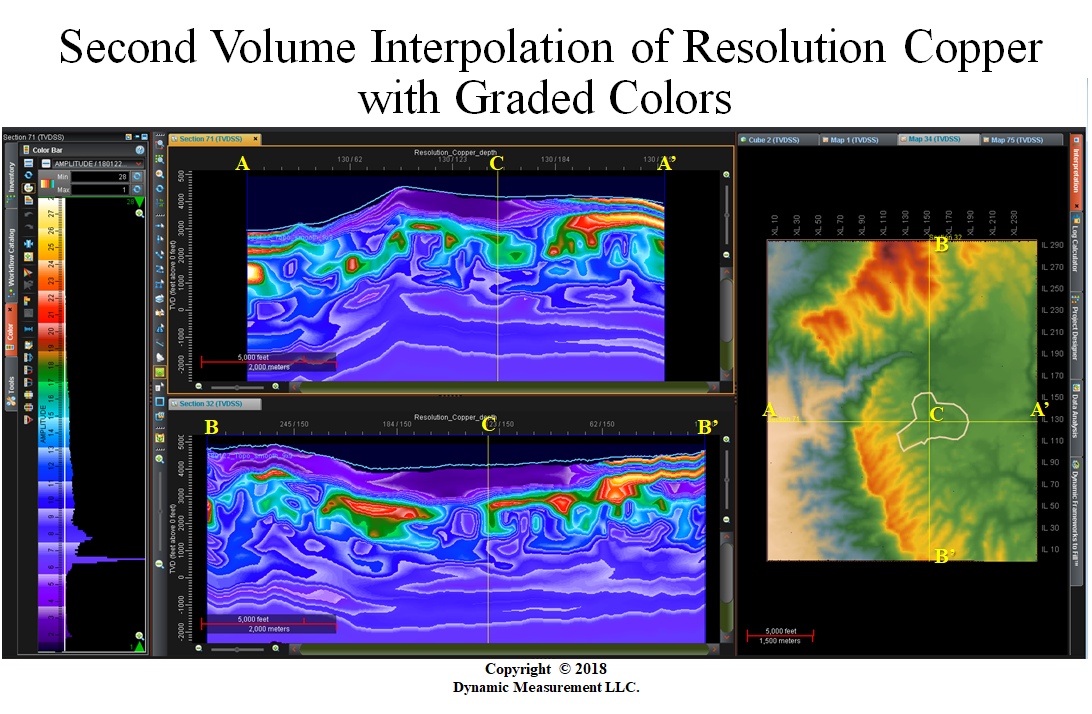
2nd Interpolation E-W and N-S Cross-Sections | 2nd Interpolation with Graded Colors |
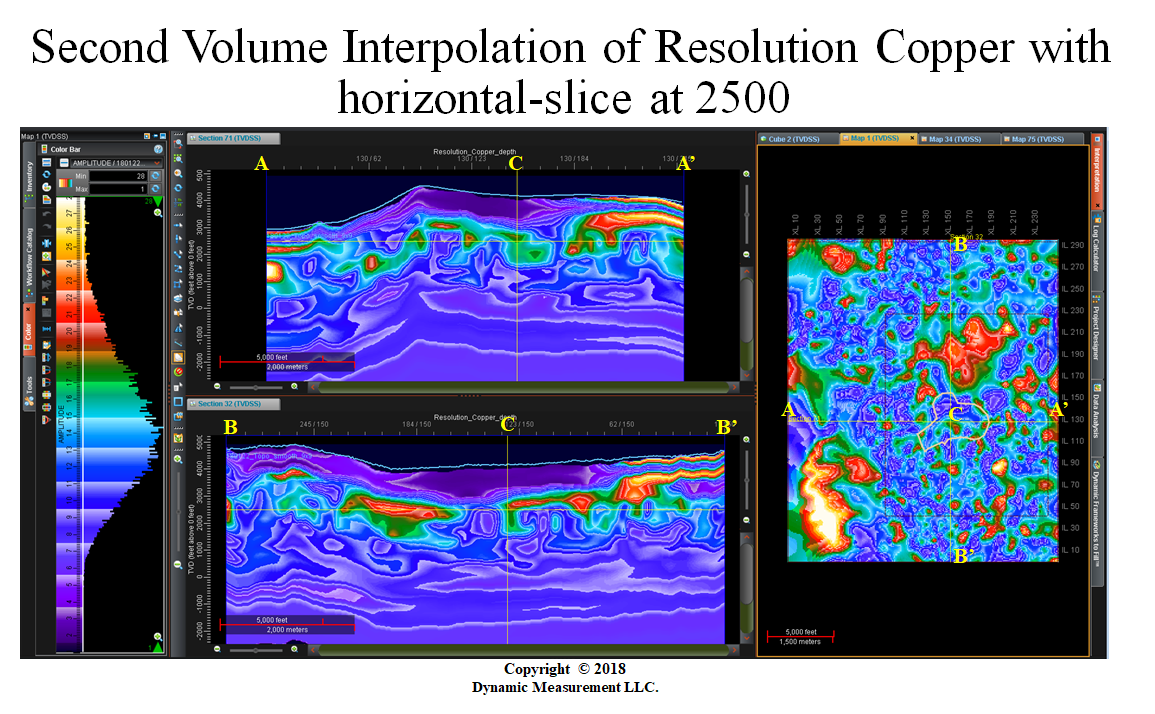
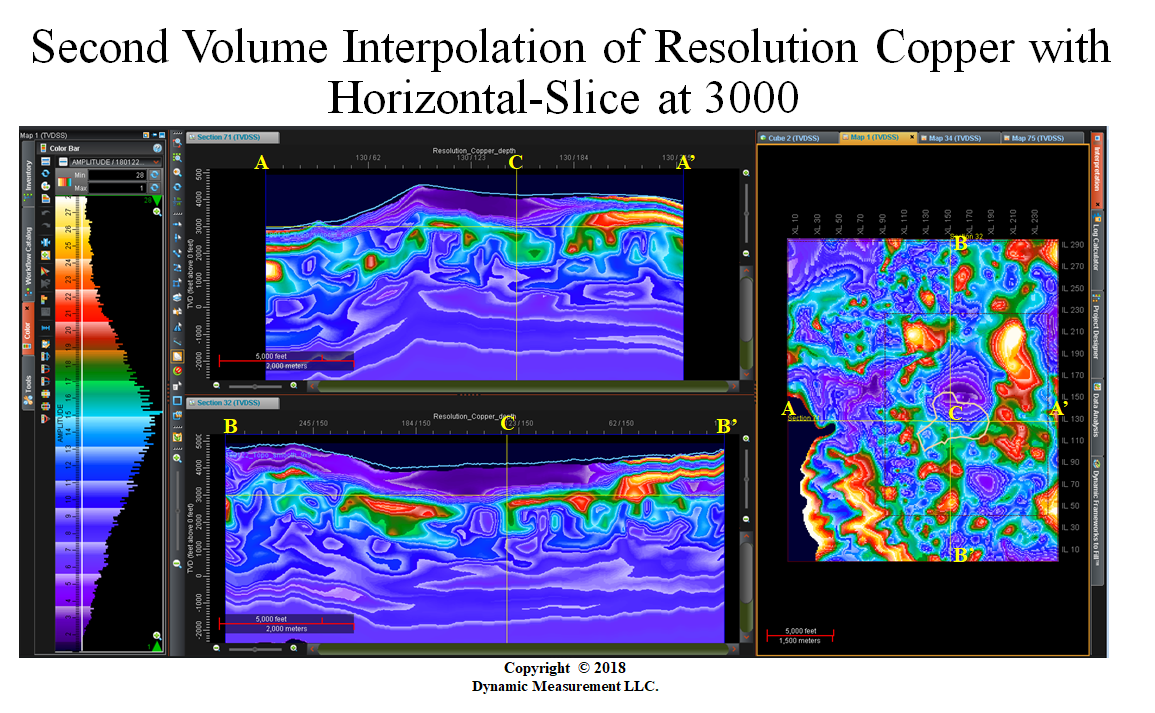
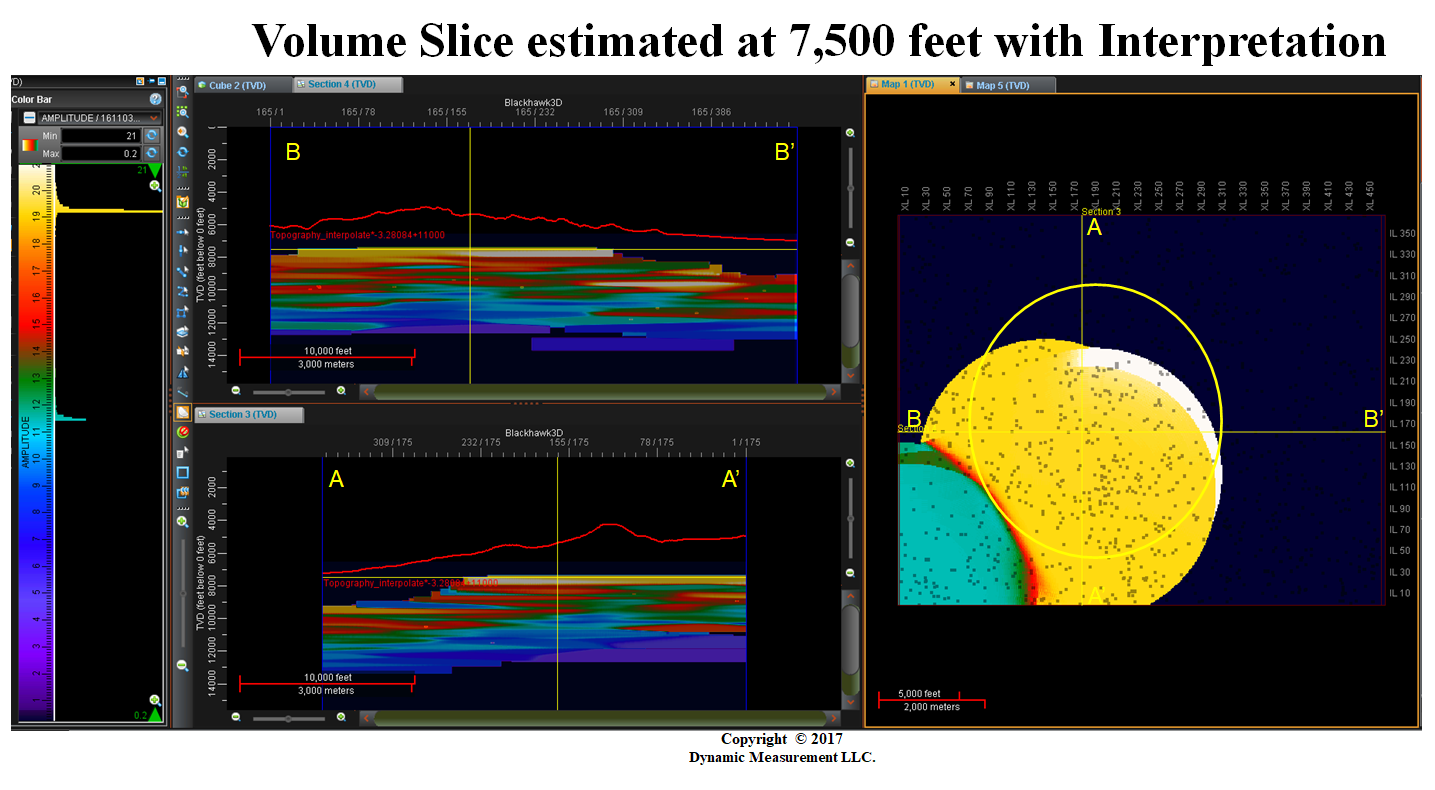
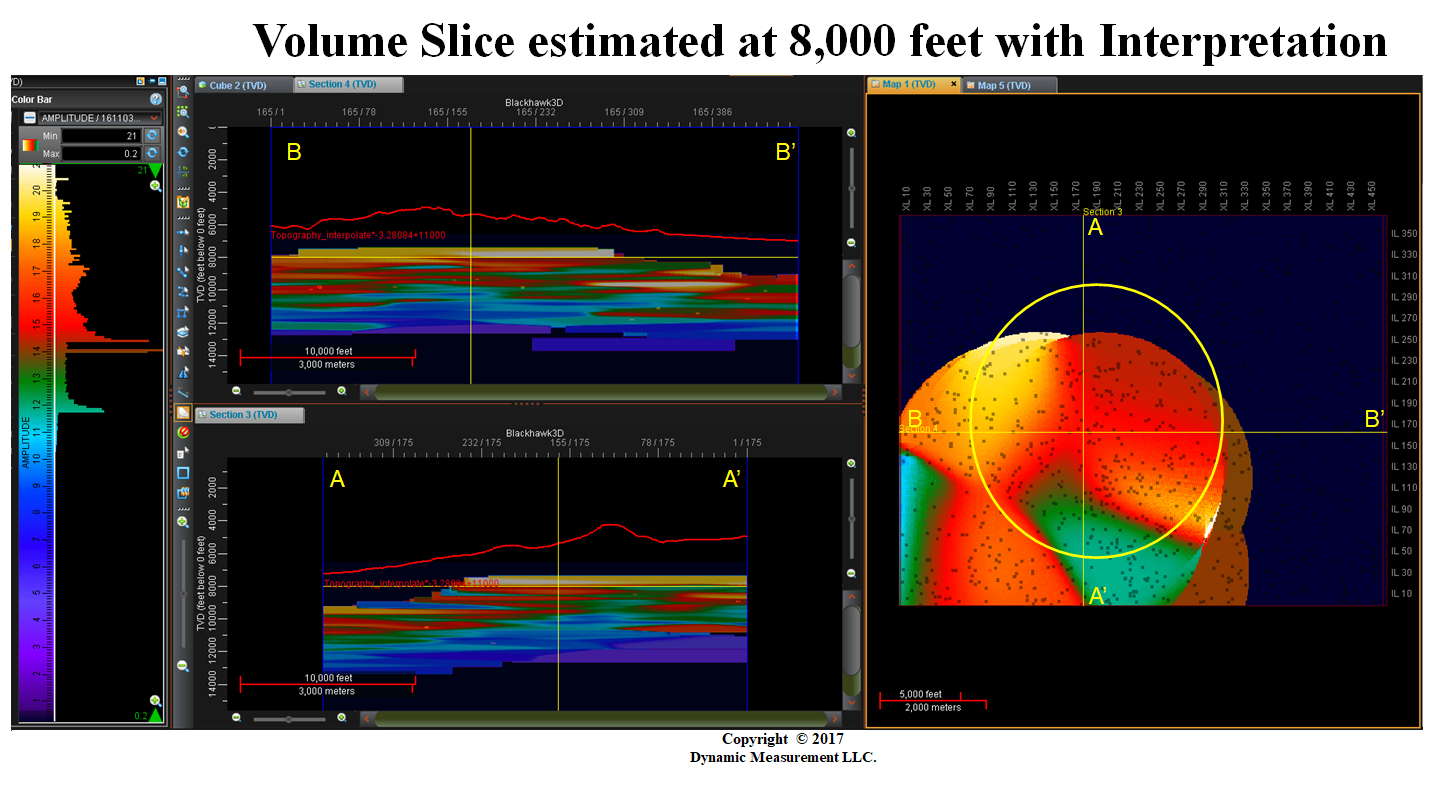
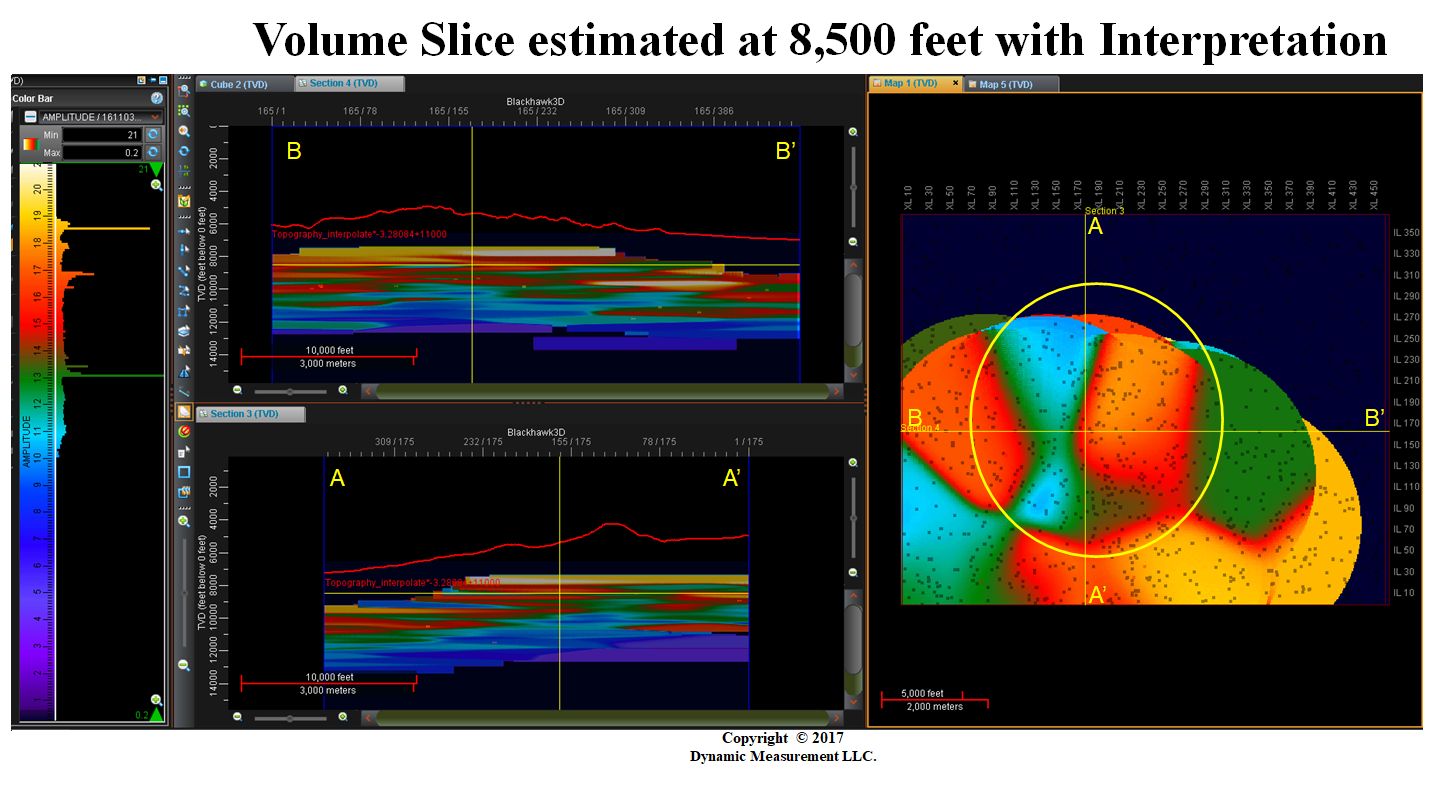
2nd with Horizontal-Slice at 2500 | 2nd Slice at 3000, note halo at and to north of mine |
| Background Lightning Image |
 |
 |
 |
 |
 |
 |
 |
 |
 |
 |
| The Duck Hunting experience was 8-years after DRC was formed. | DRC packages exploration opportunities and sells them. |
This involves integrating as much different data as possible. | Lightning Analysis was spun out of DRC as a service company. |
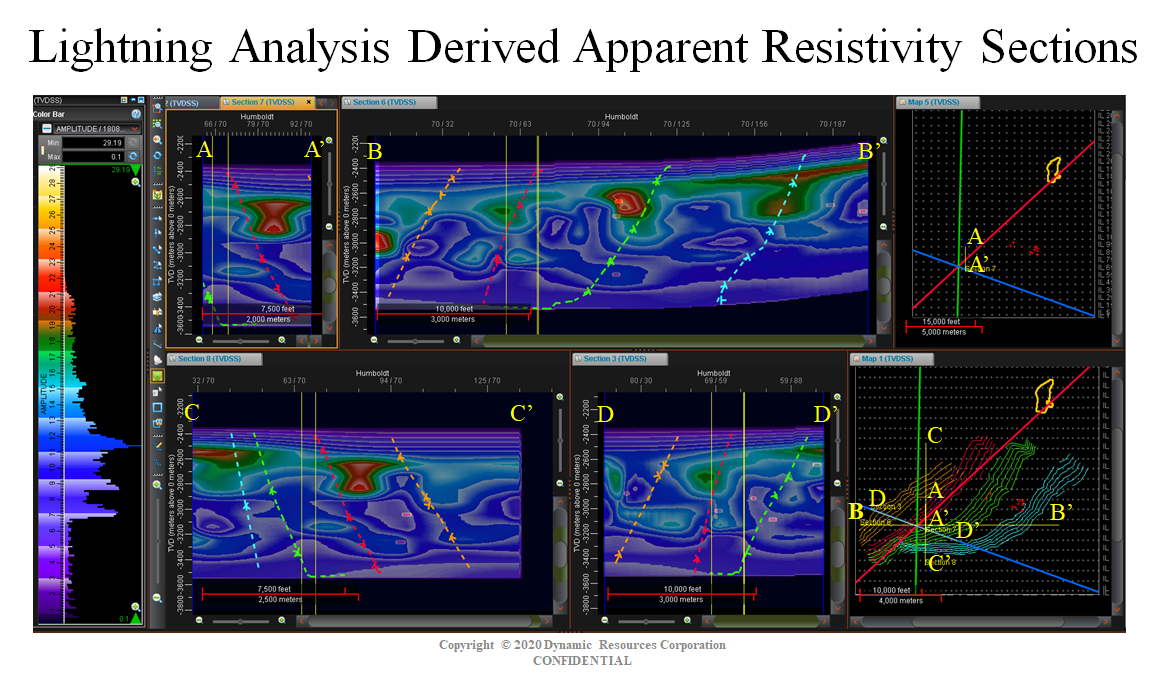
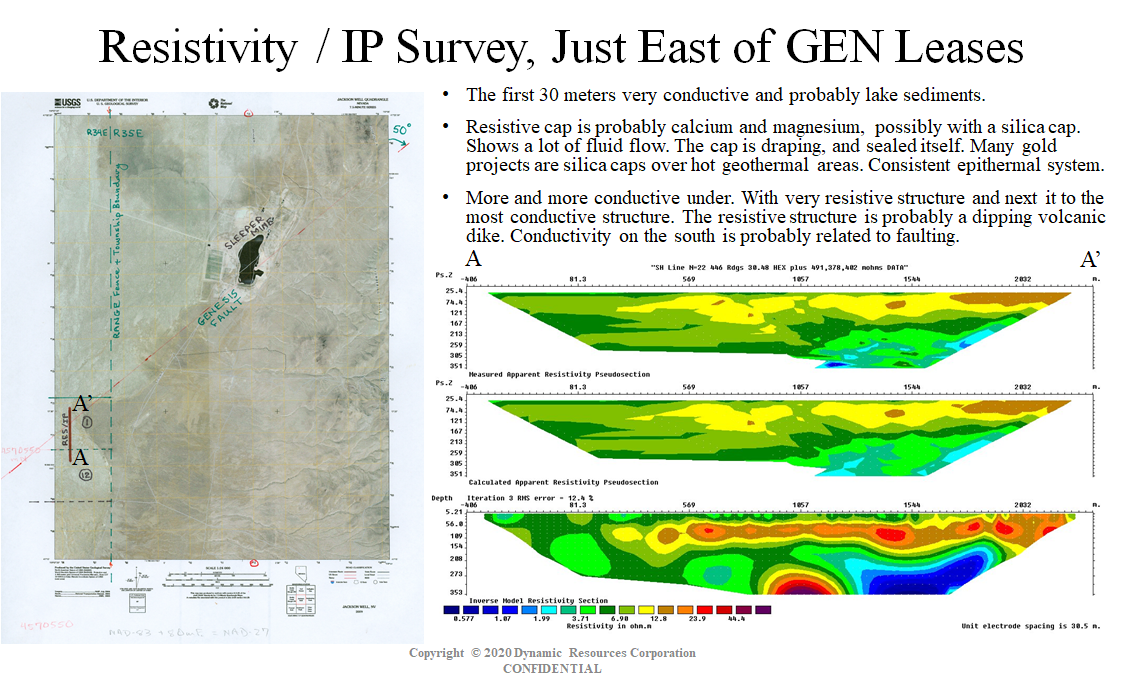
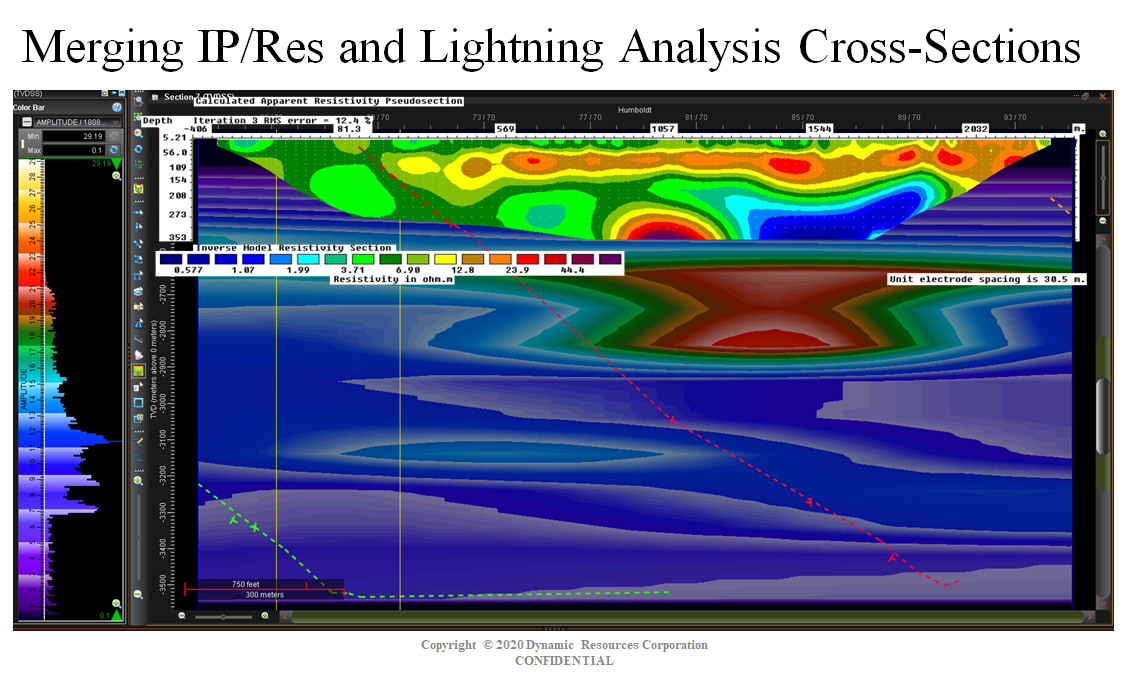
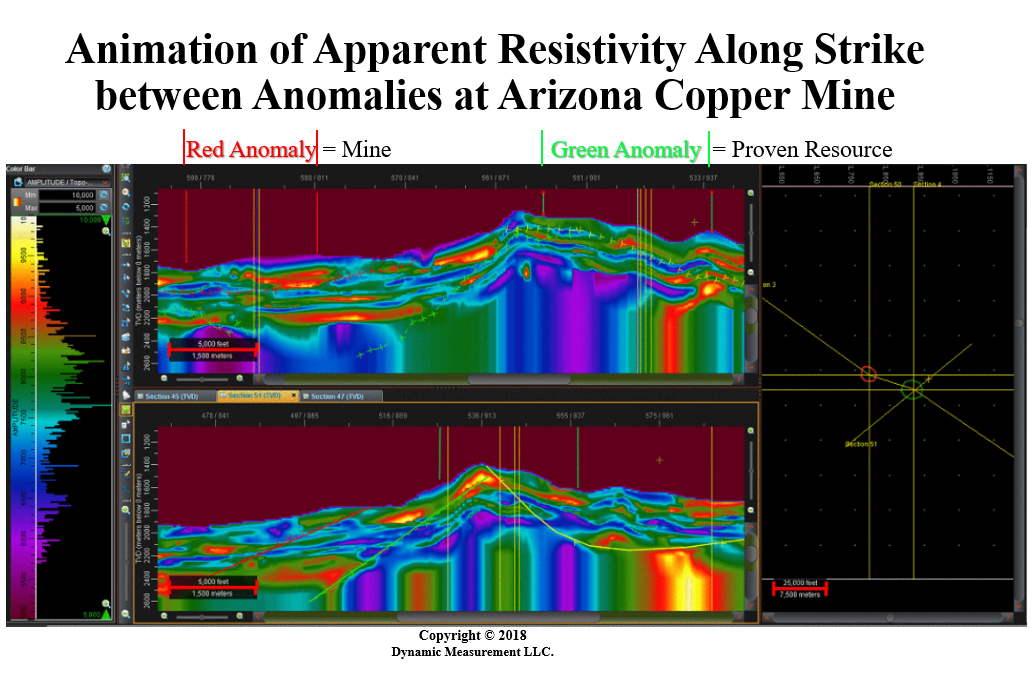
DRC uses data to look for new exploration opportunities. | Byron Arnason's Res/IP Survey ties DML's resistivity cross-section. |
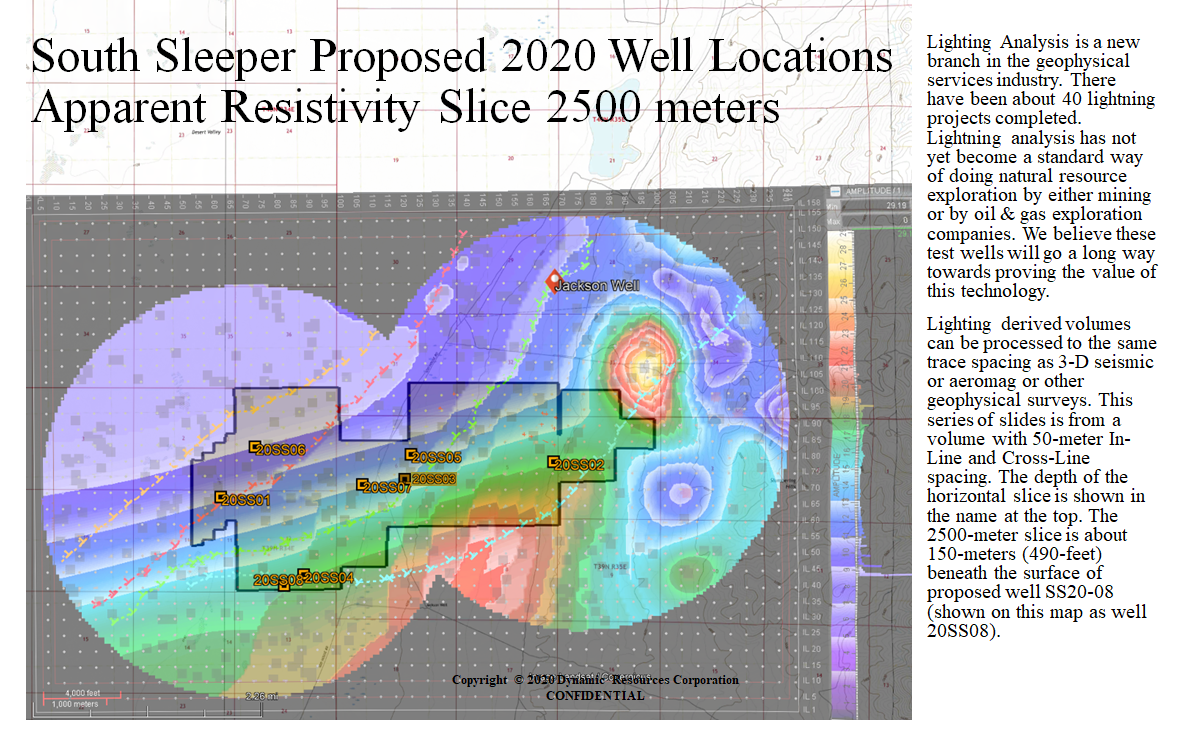
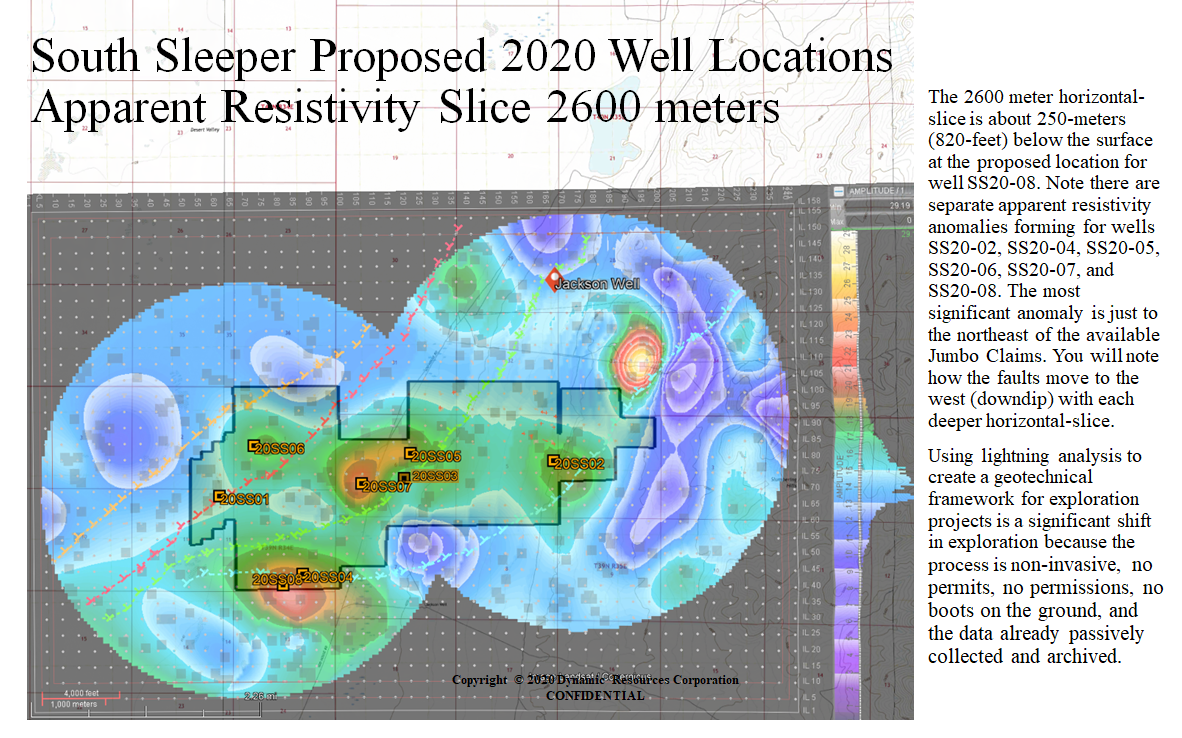
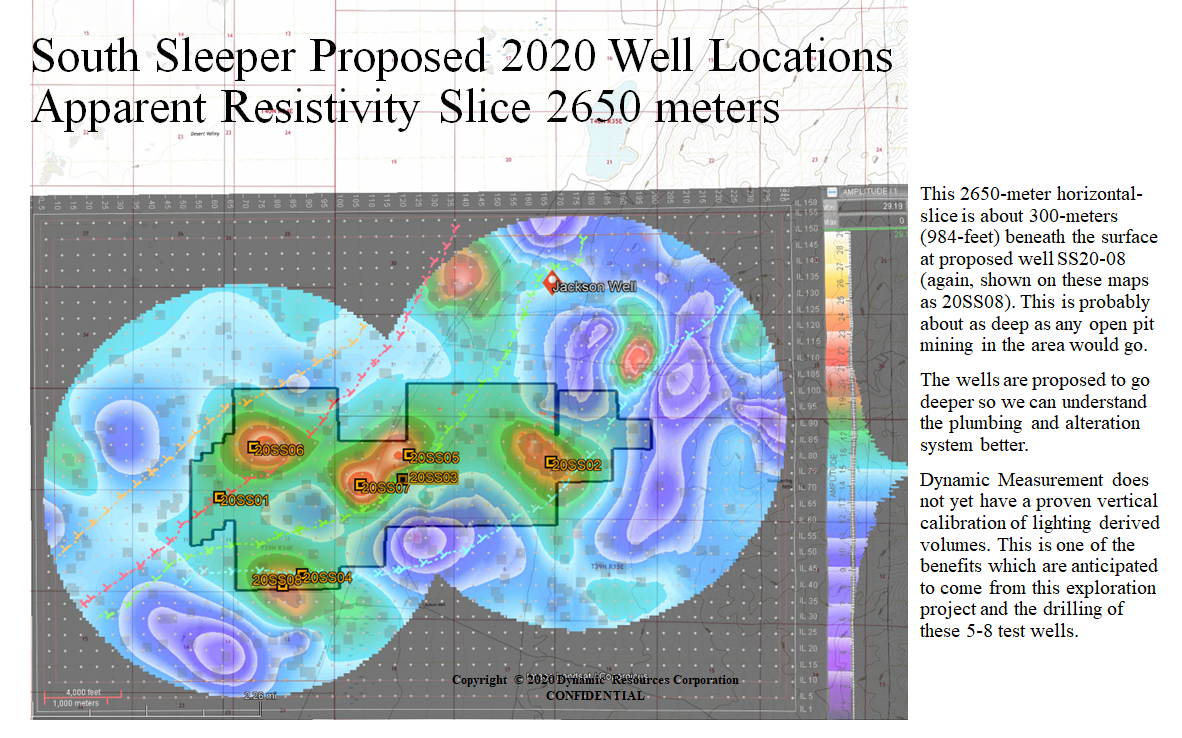
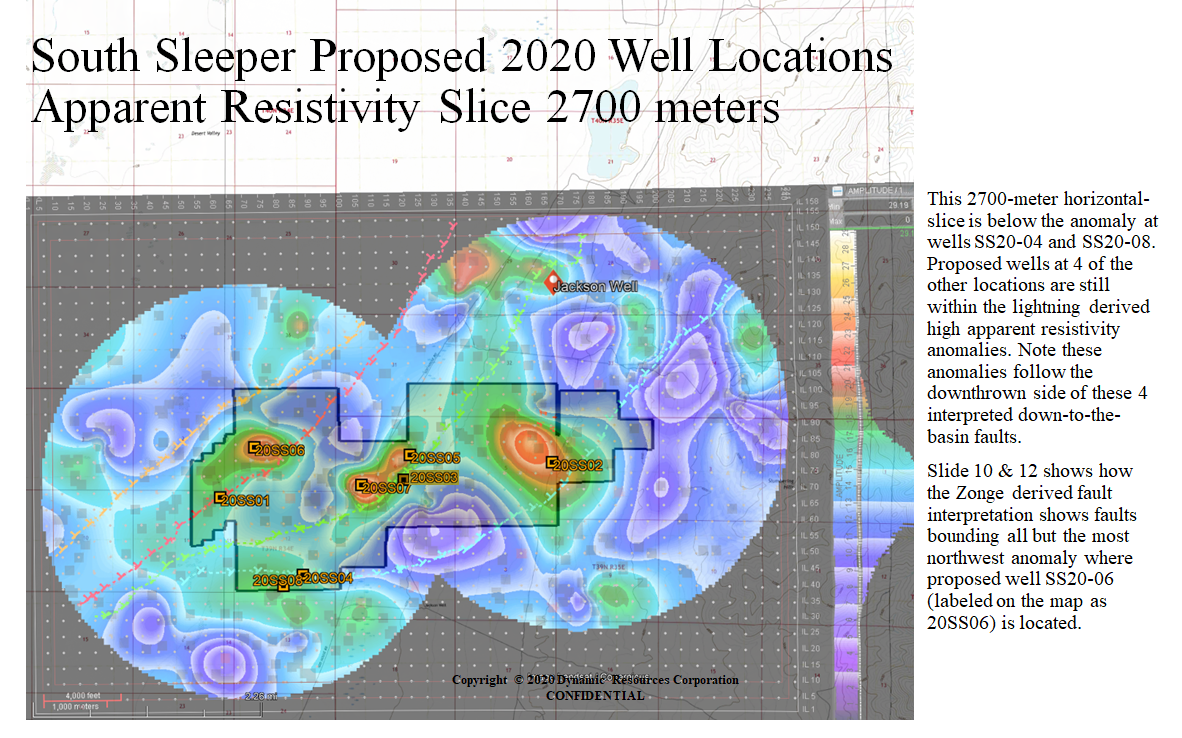
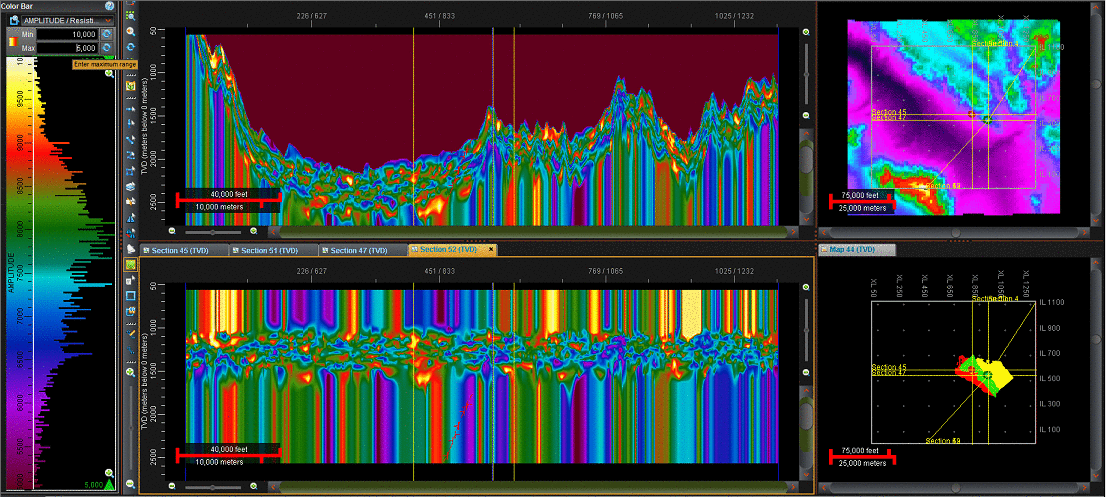
Stacking 20+ years of lightning strike data and derived attributes | allows creation of lightning attribute and rock property maps and volumes |
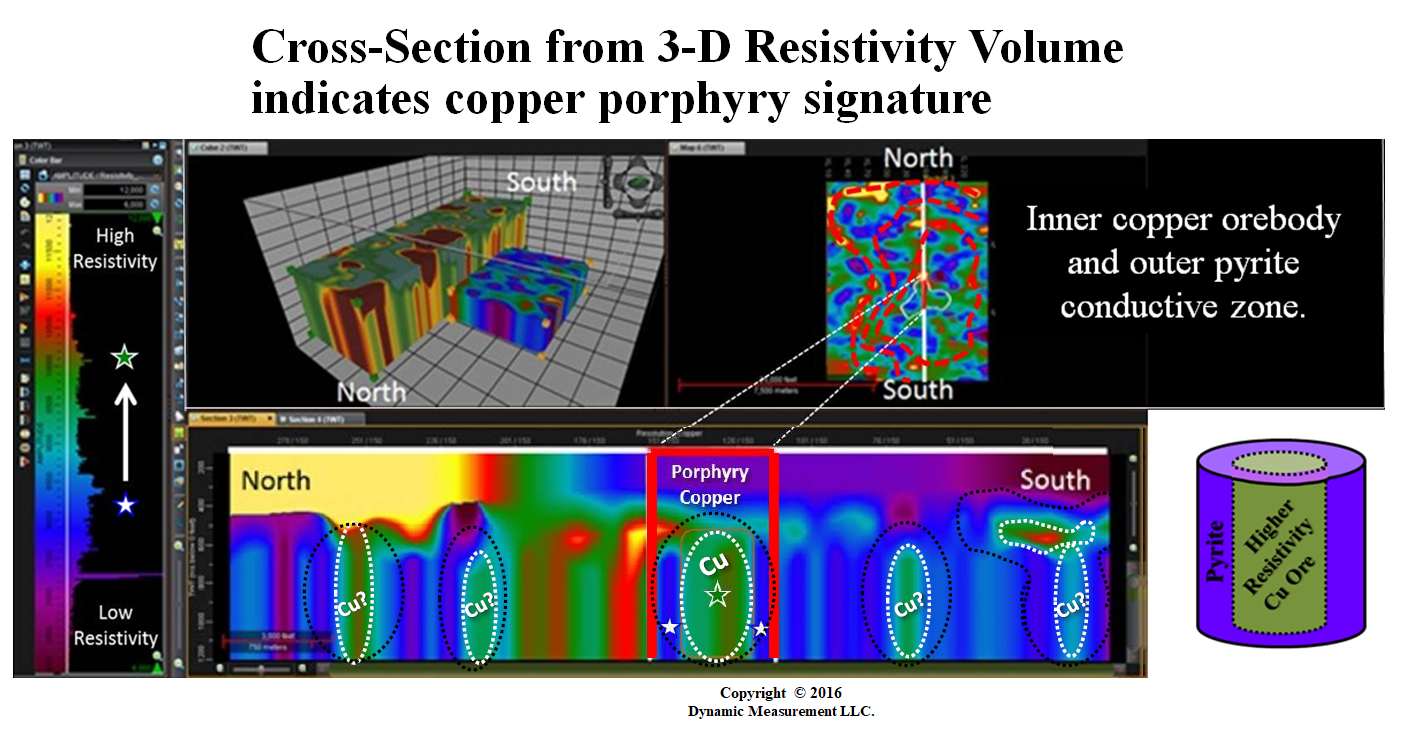
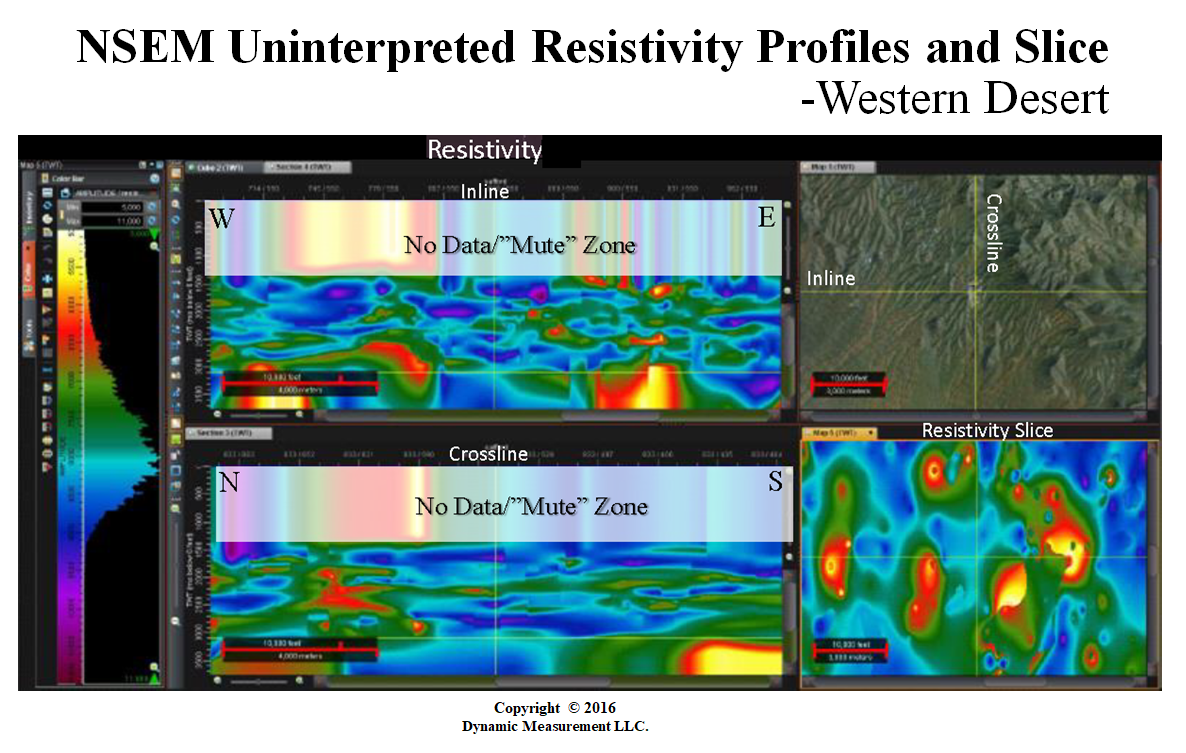
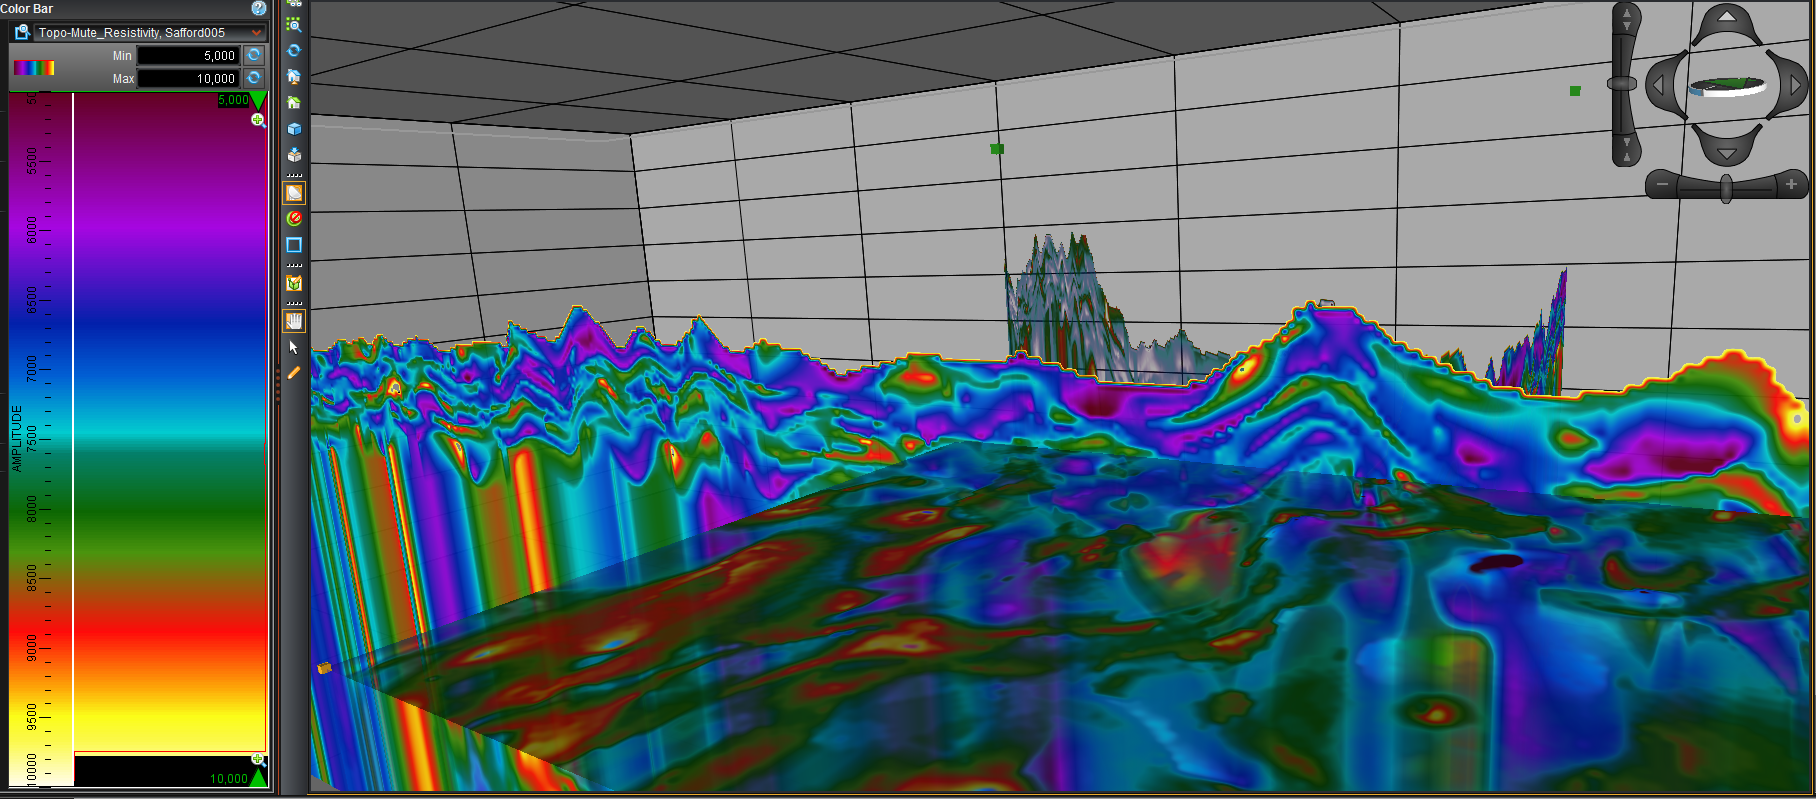
like this apparent resistivity volume, interpreted like 3D seismic data. | Other data, like from the Sleeper Mine, provides context for DRC. |
 |
 |
 |
 |
 |
 |
 |
 |
 |
 |
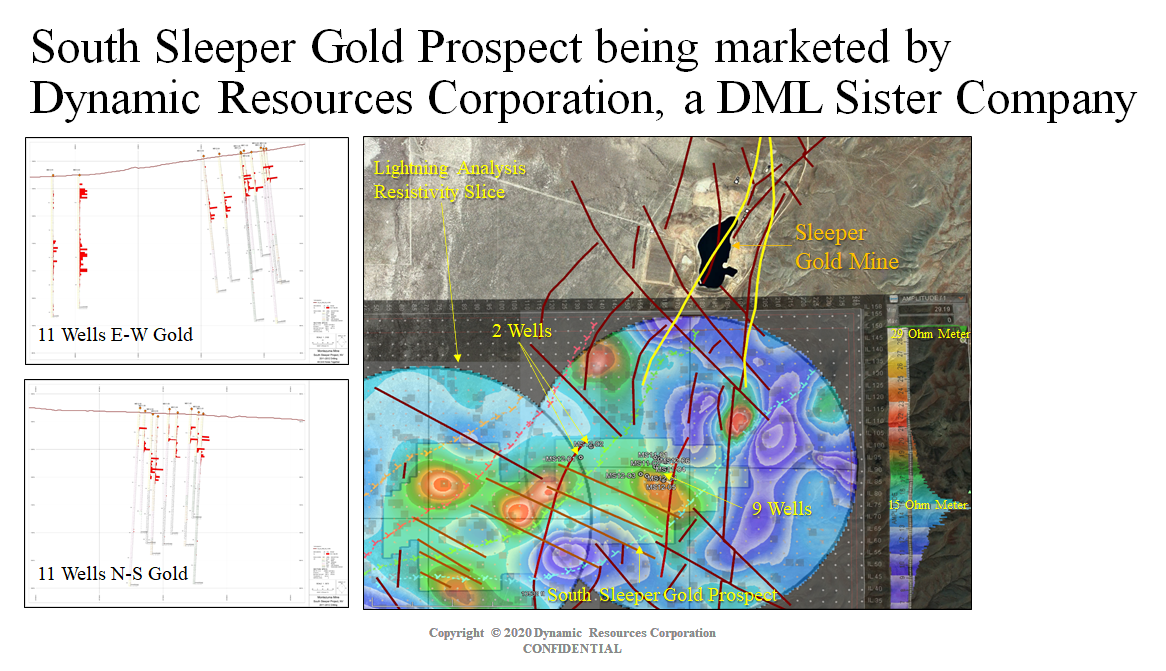
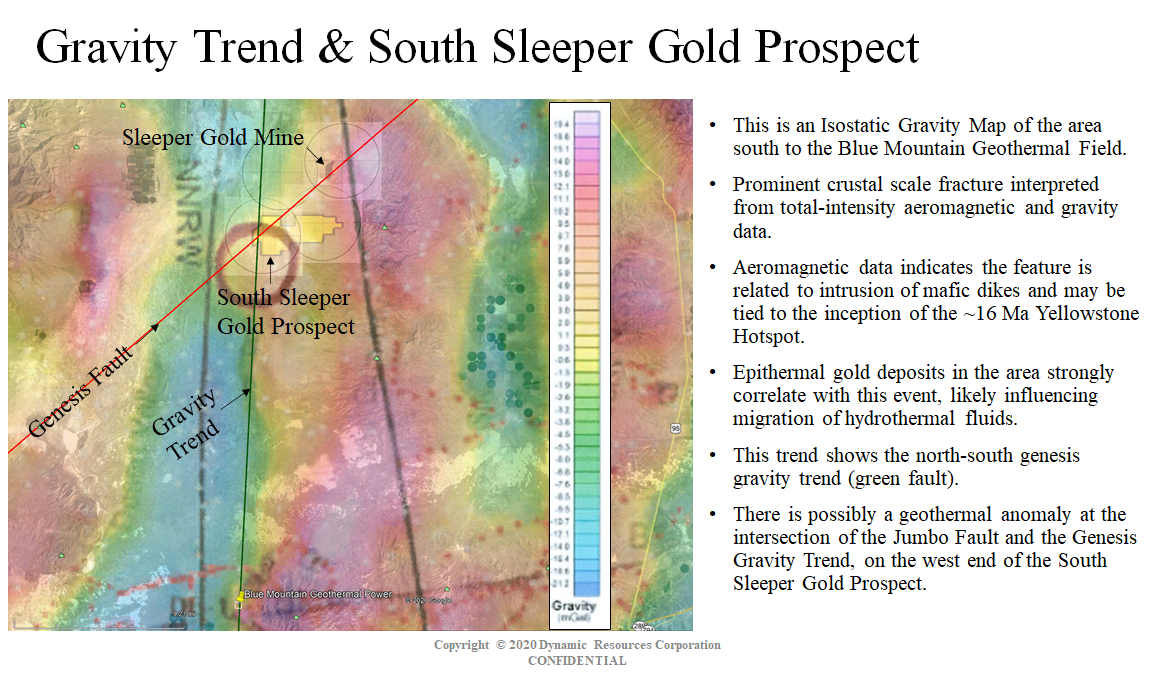
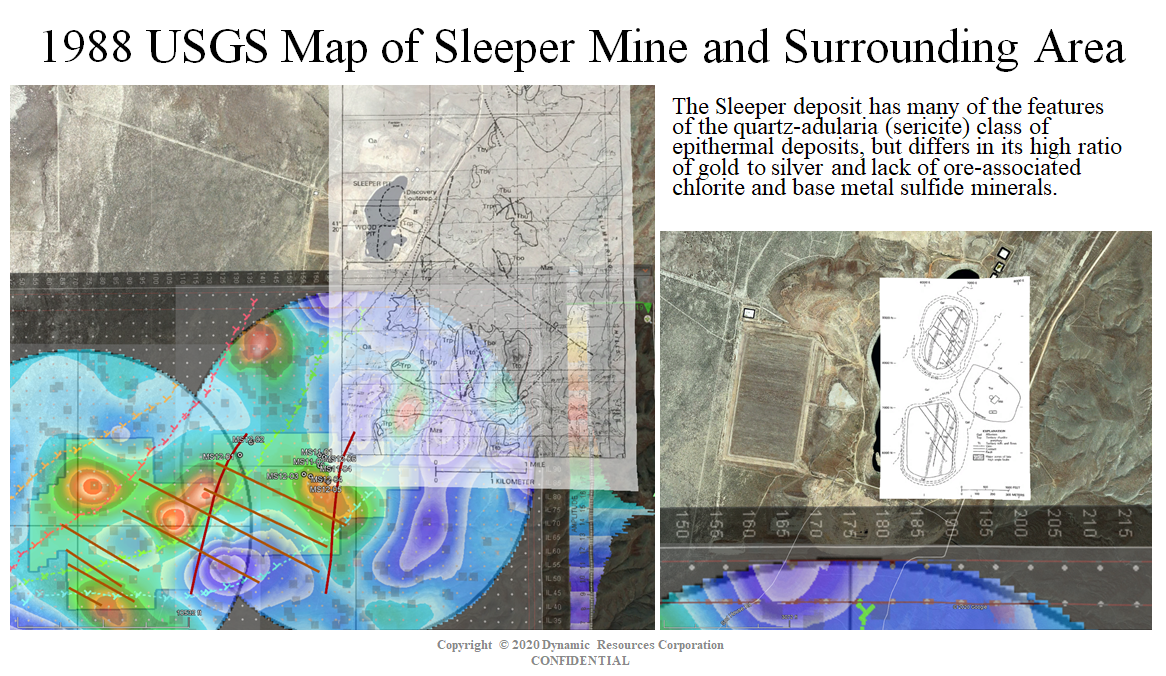
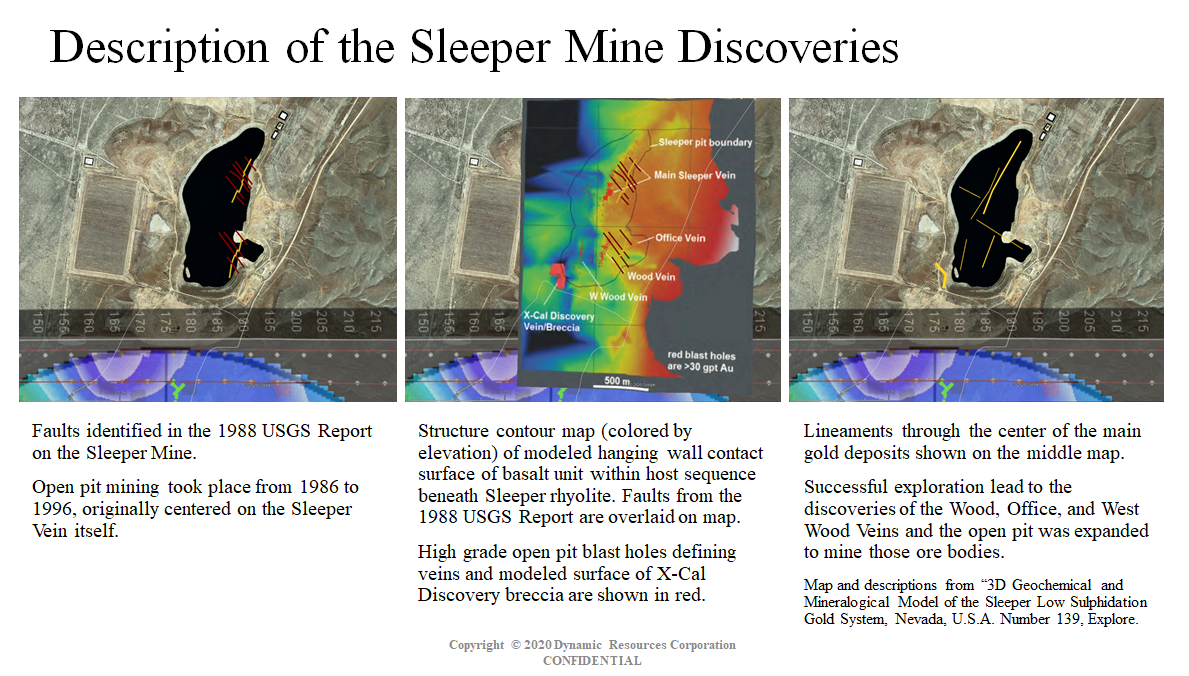
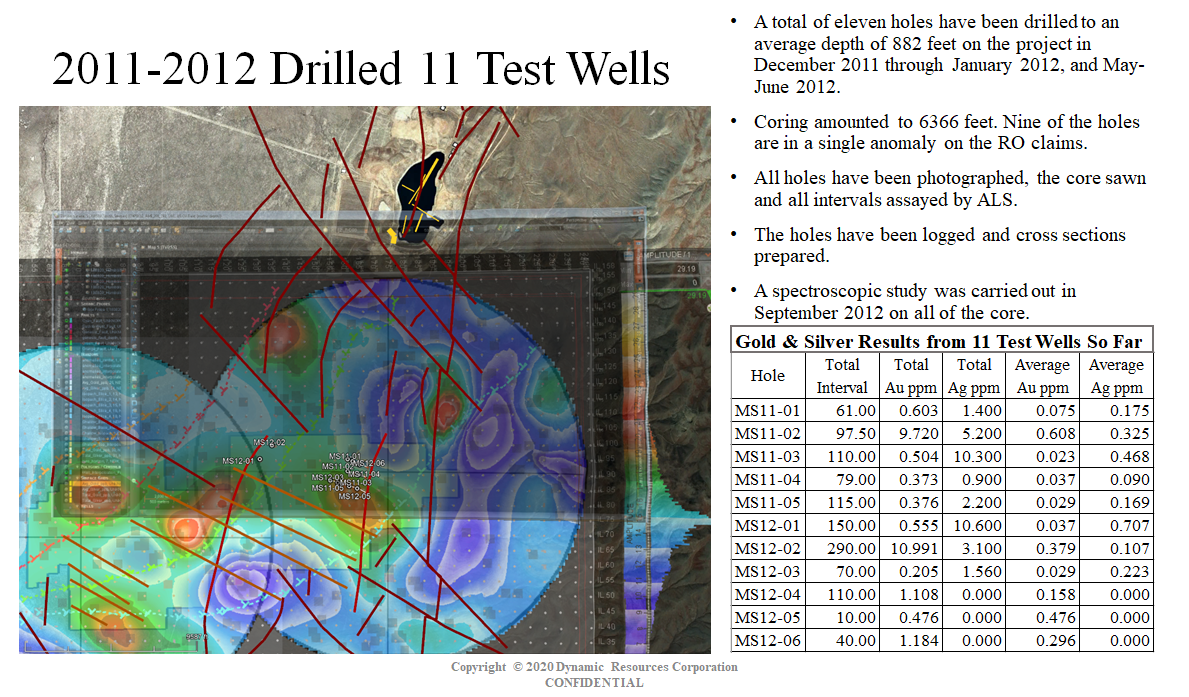
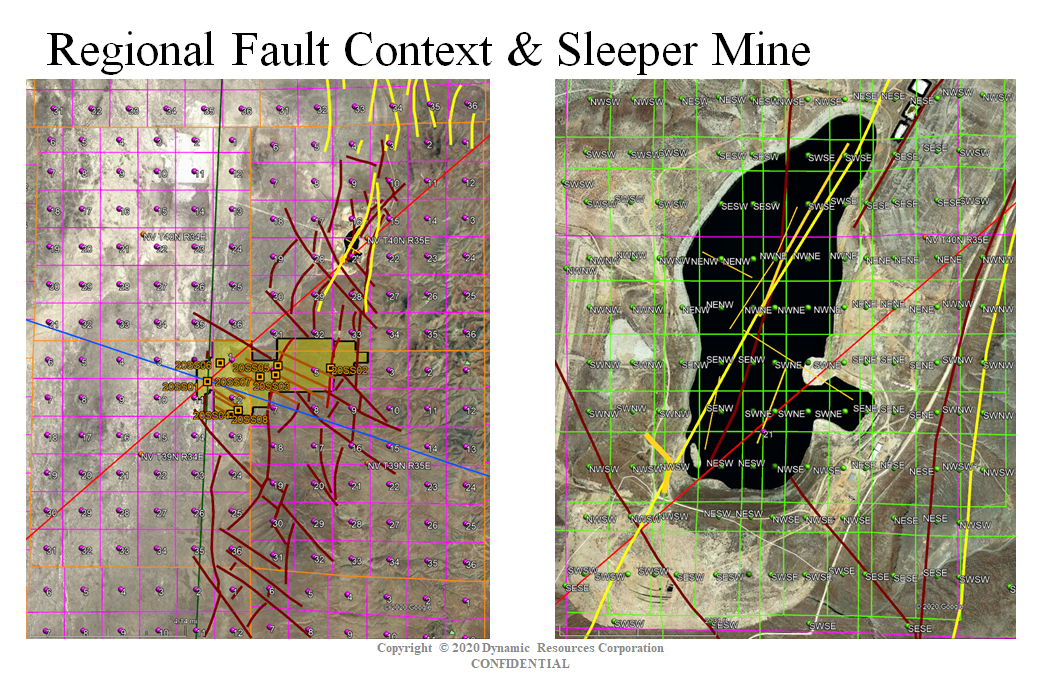
| These veins in the Sleeper Mine produced 1.66 MM oz gold | and 2.3 MM oz silver (1985-1996). More is expected nearby. |
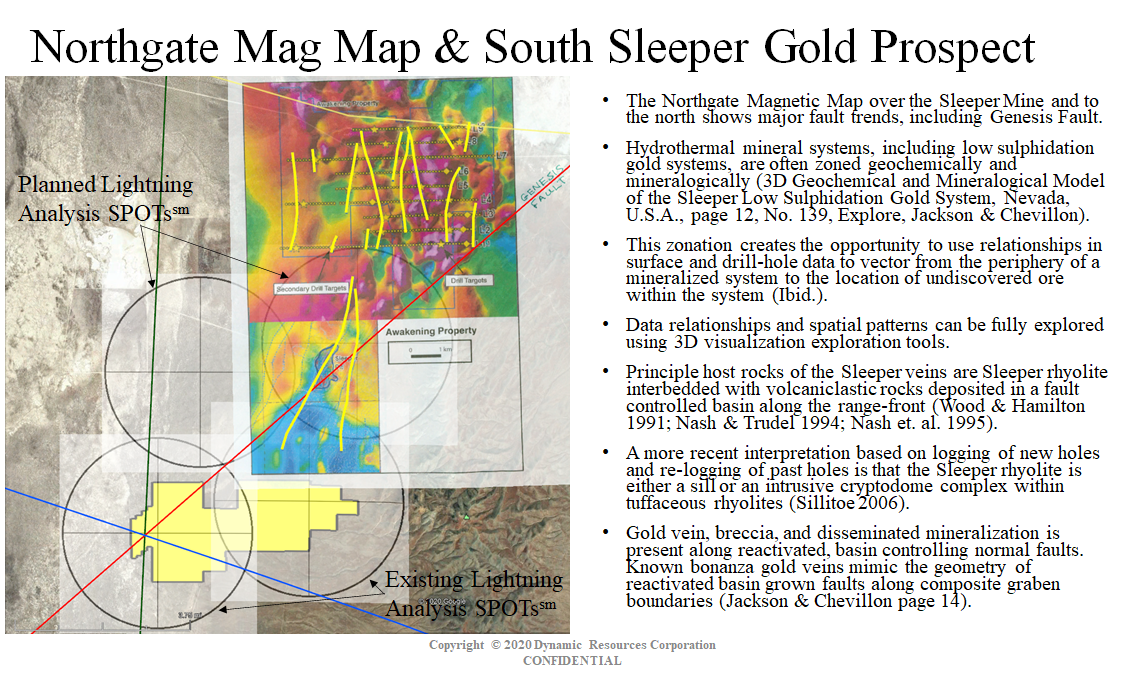
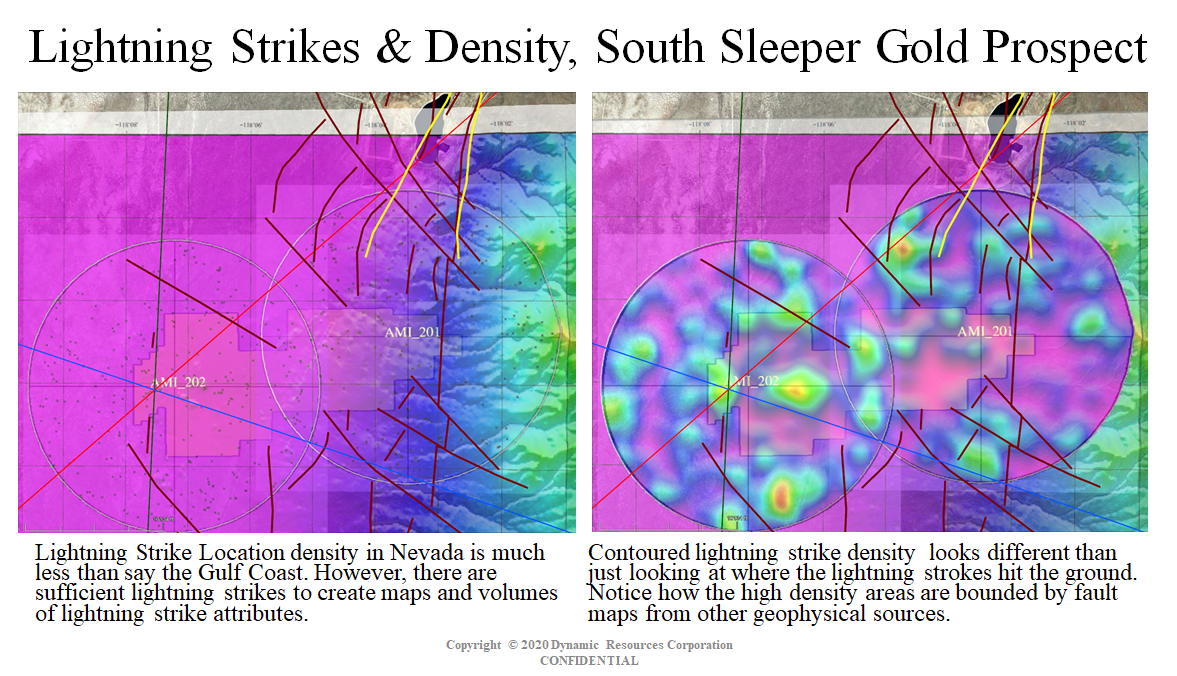
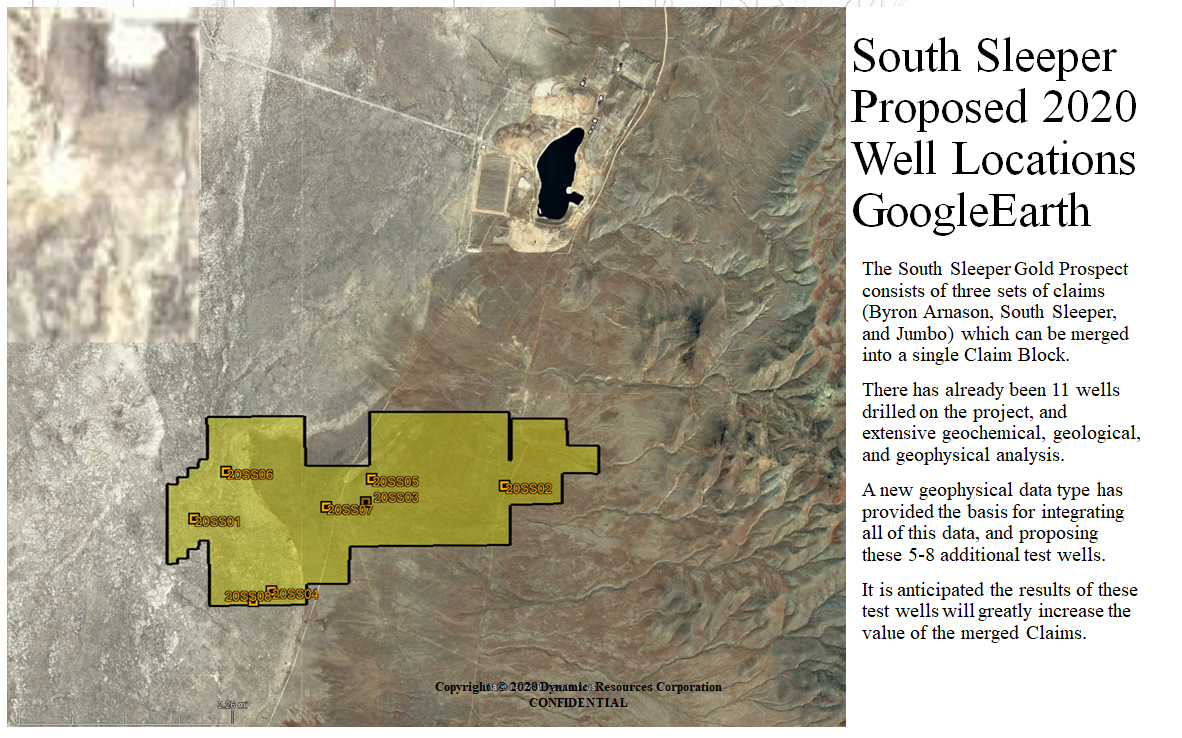
Regional faults tie Sleeper and mine faults to available southern Claims. | Horizontal-slices through two DRC contracted DML SPOTssm show |
continuity and connection with other faults on trend in the area. | In addition to combining 3 sets of claims into one Claim block, |
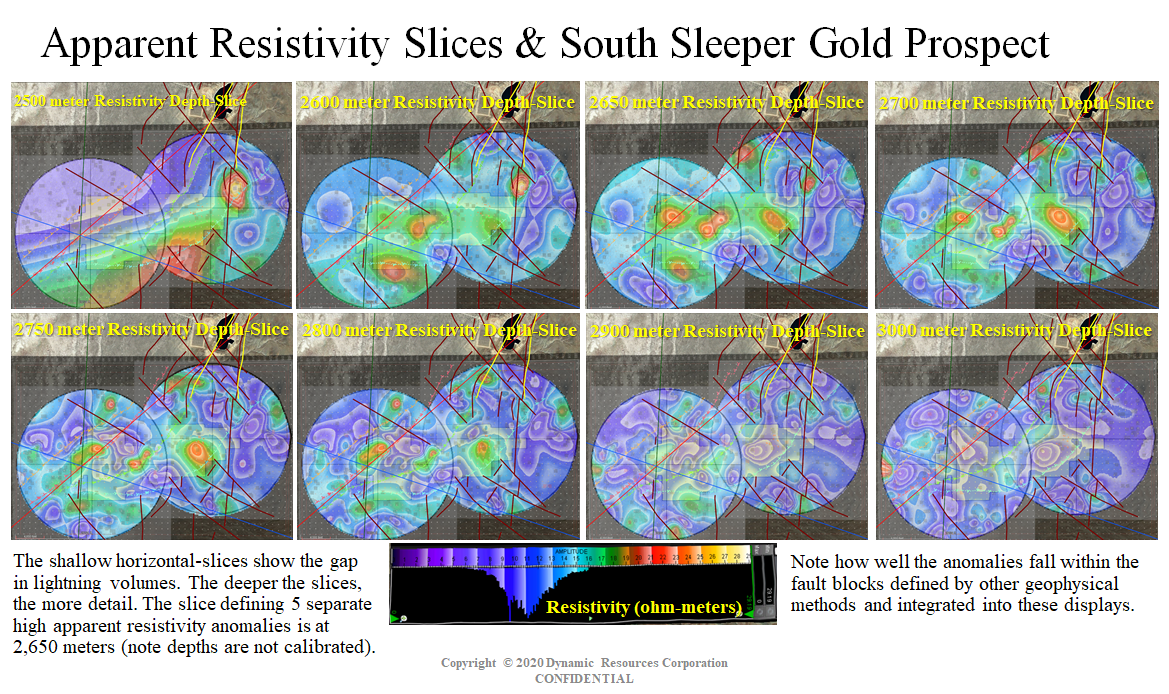
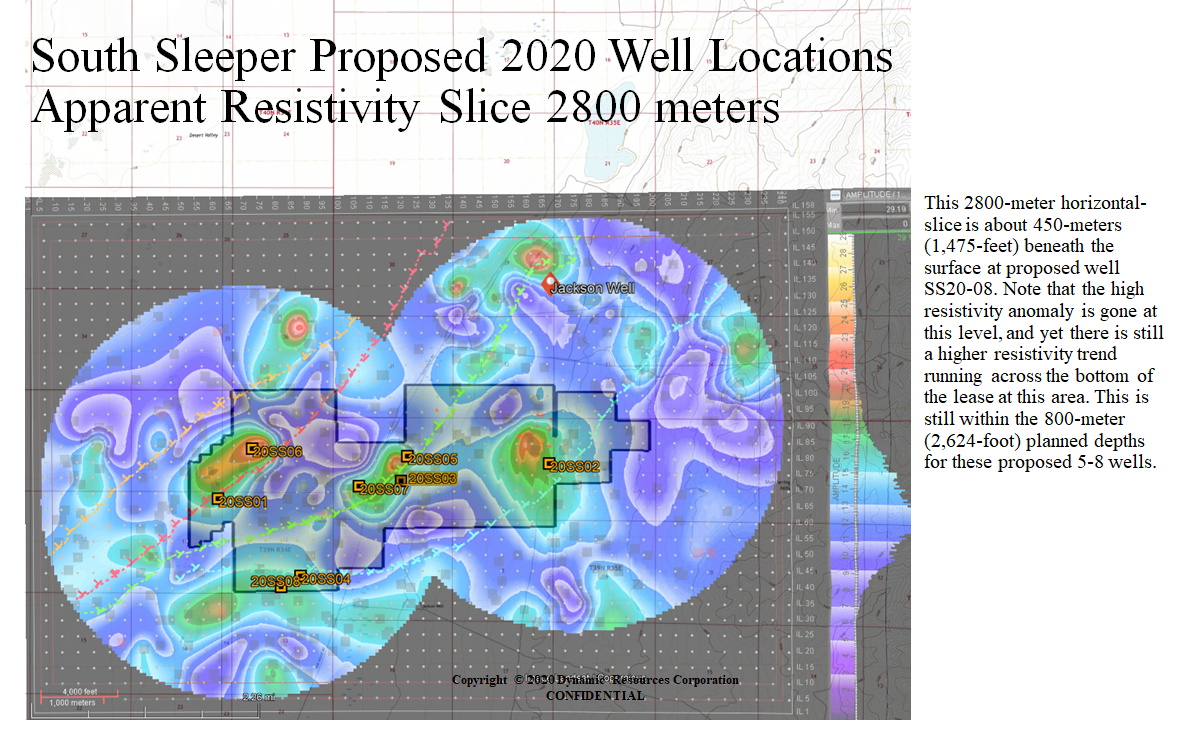
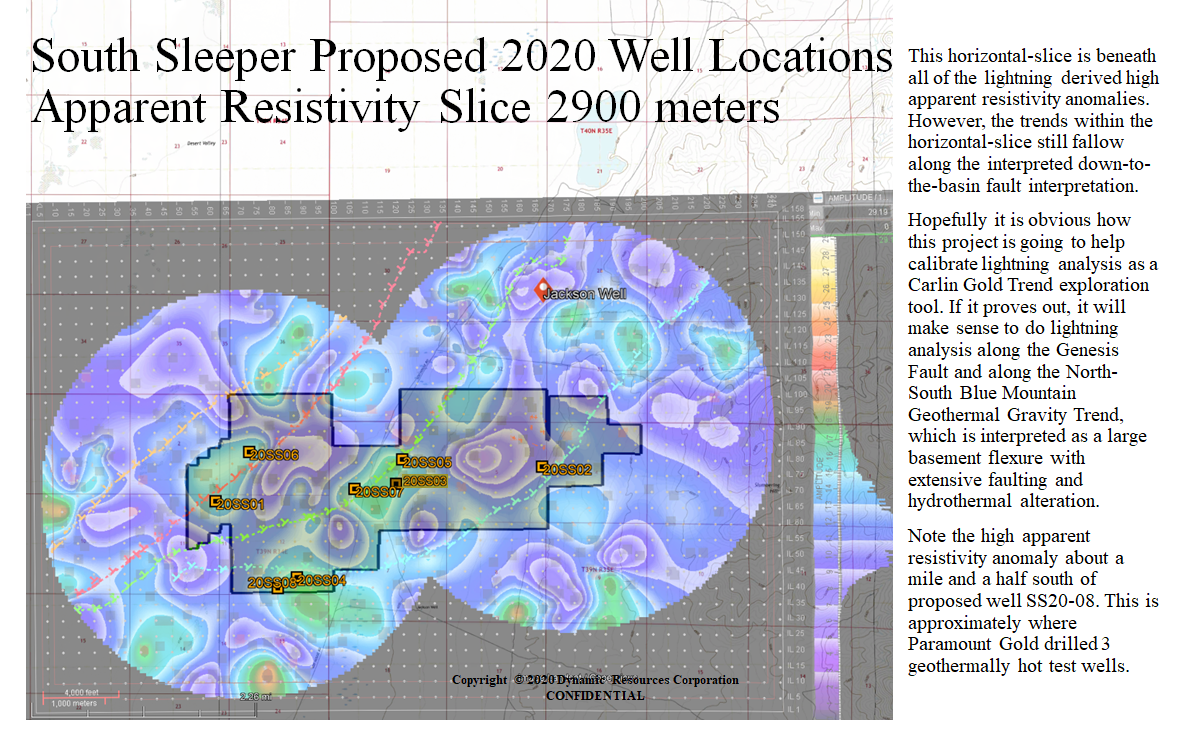
DRC is proposing 8 new test wells based on higher resistivity. | These anomalies are possibly related to rhyolite domes which |
came up the down to the basin faults with hydrothermal fluids & minerals. | This 2020 active opportunity has 3 commitments waiting for $. |
 |  |
 |  |
 |  |
 |  |
 |  |
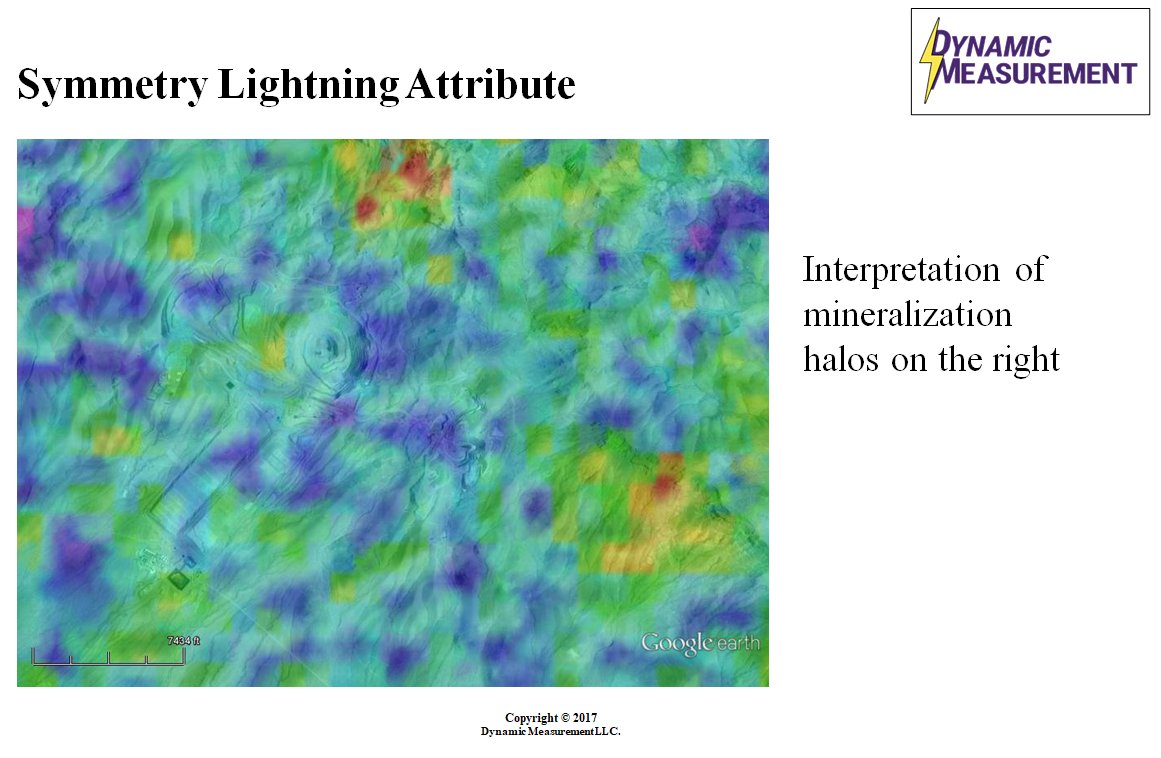
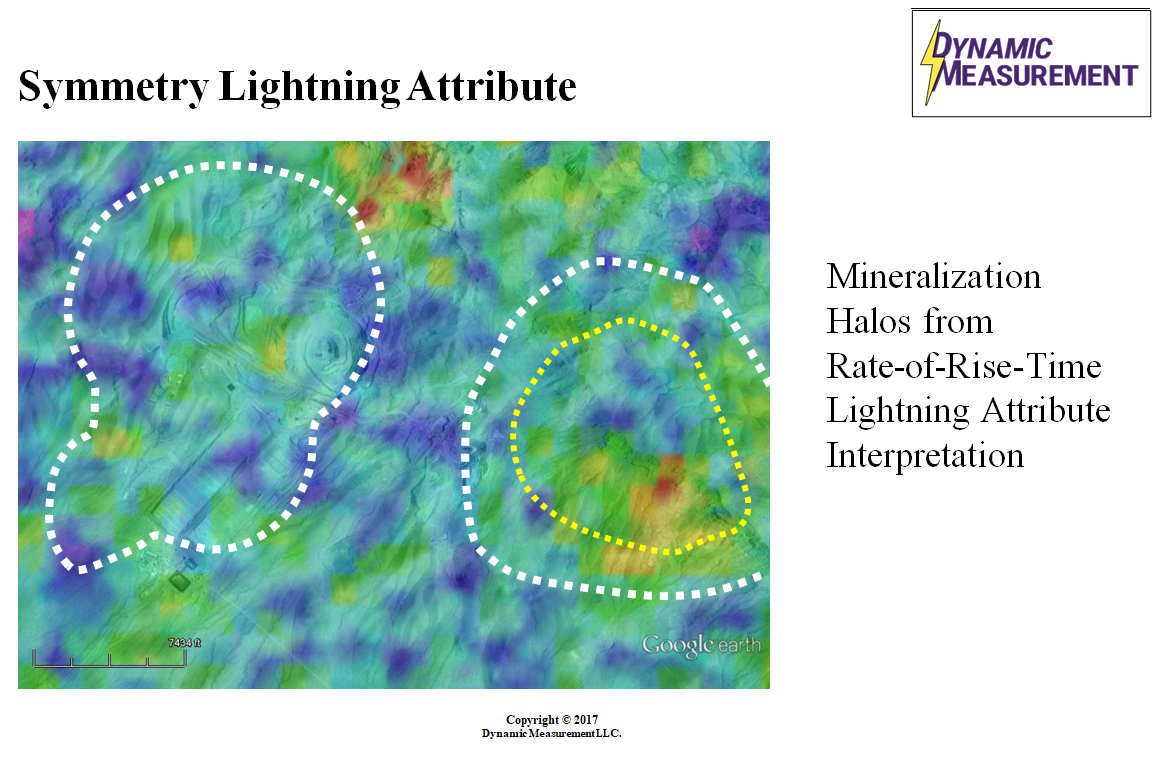
| Rise-Rate Attribute Halo Before & After | Symmetry Attribute No Interpretation |
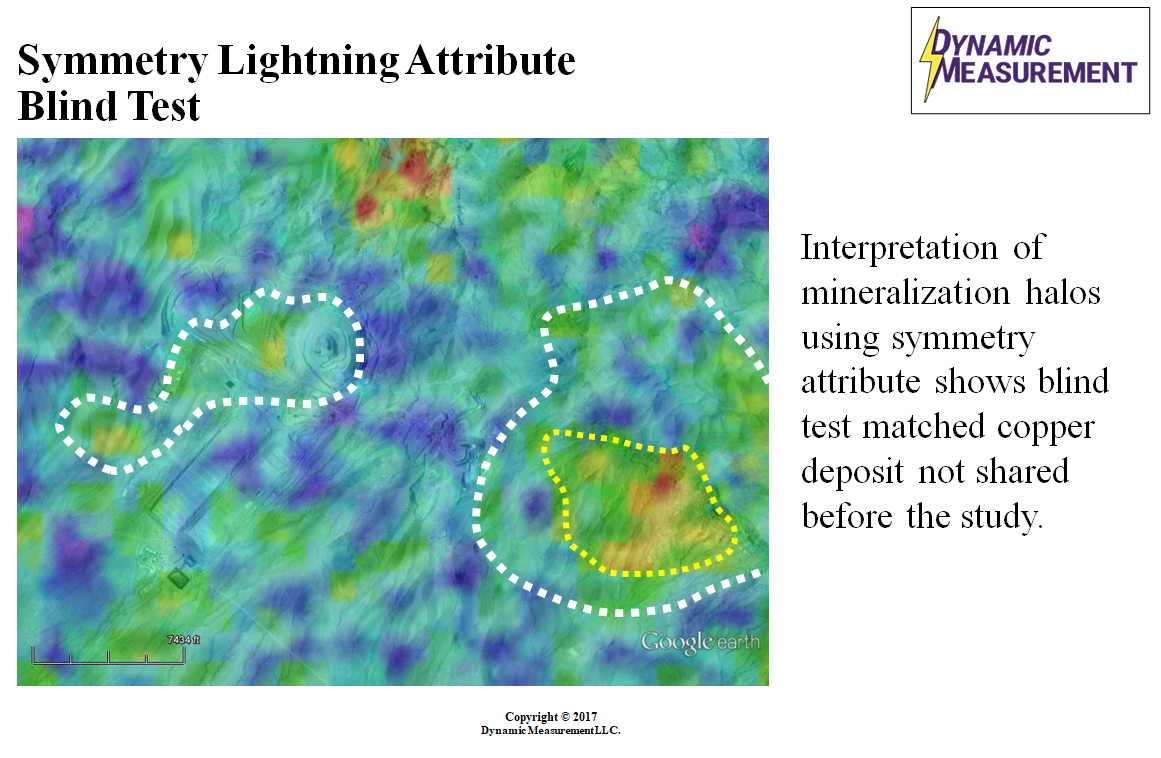
Symmetry Attribute Halos Mine & Blind Test | Altenative Interpretation Symmetry |
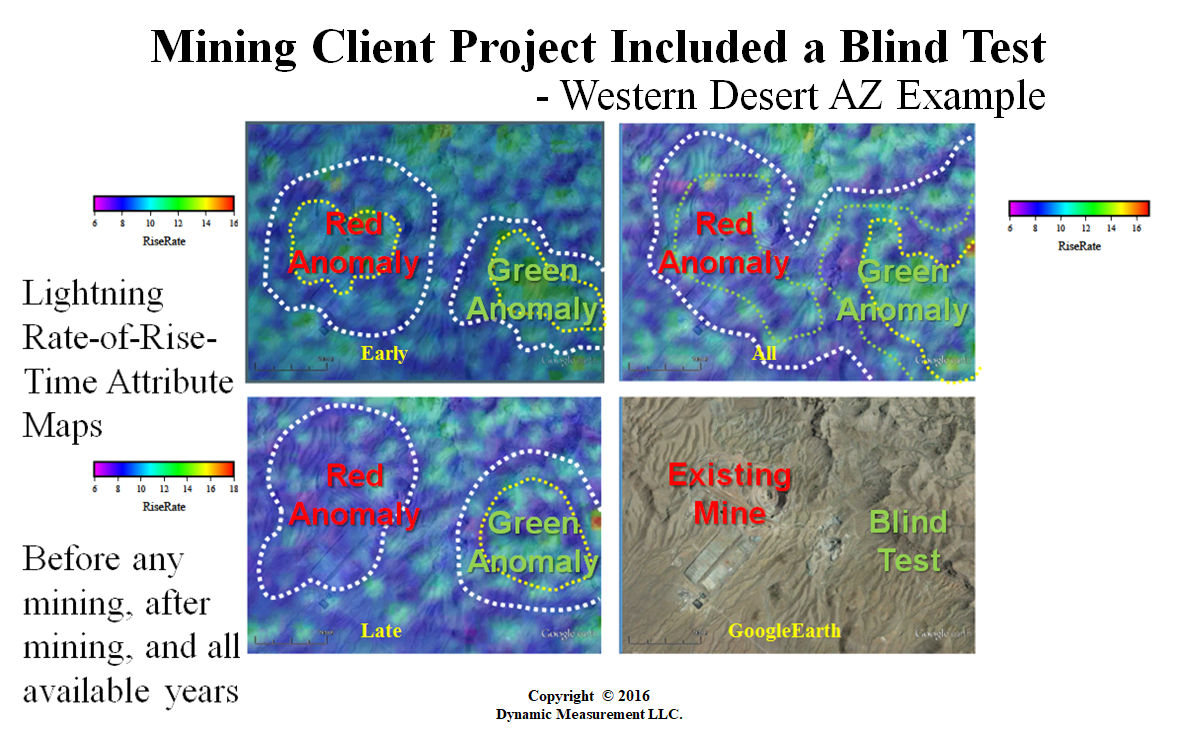
Rise-Time with Locations of Mine & Blind Test | Peak Current with Locations of Mine & Blind Test |
Peak-to-Zero with Locations of Mine & Blind Test | Rate-of-Rise-Time Red & Green Anomalies |
Apparent Resistivity Before Muting Available | Interpretation of Apparent Resistivity |
 |  |
 |  |
 |  |
 |  |
 |  |
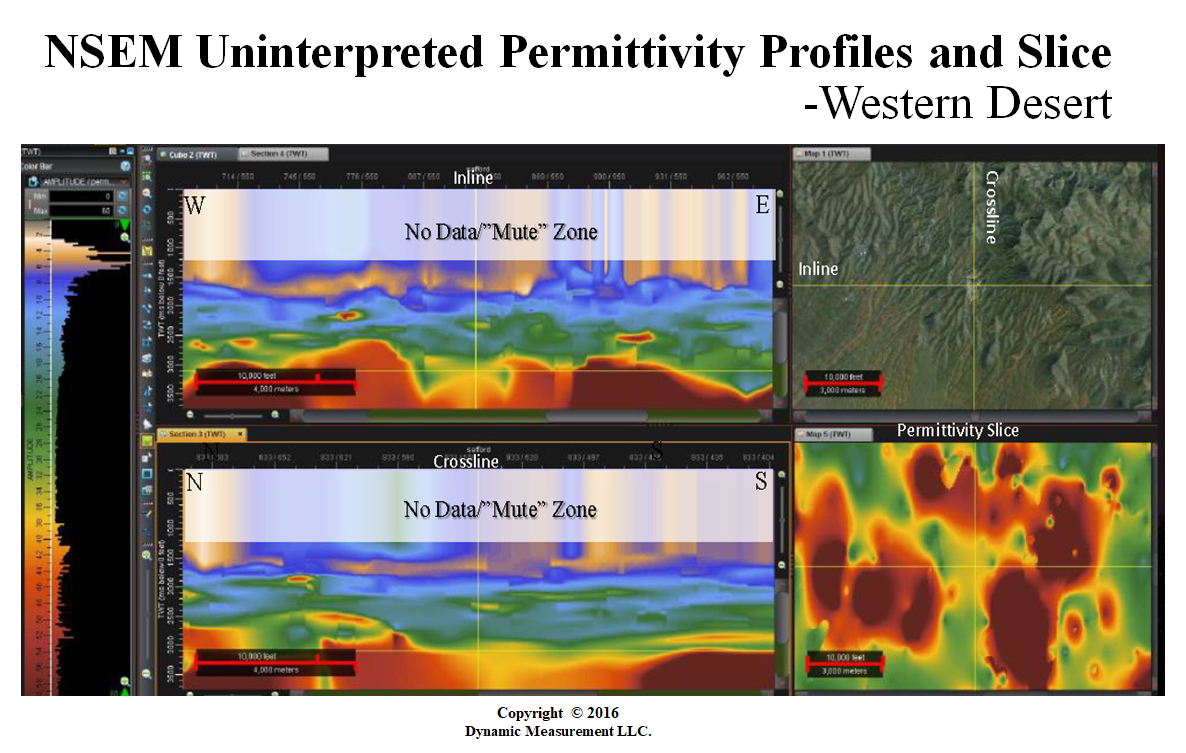
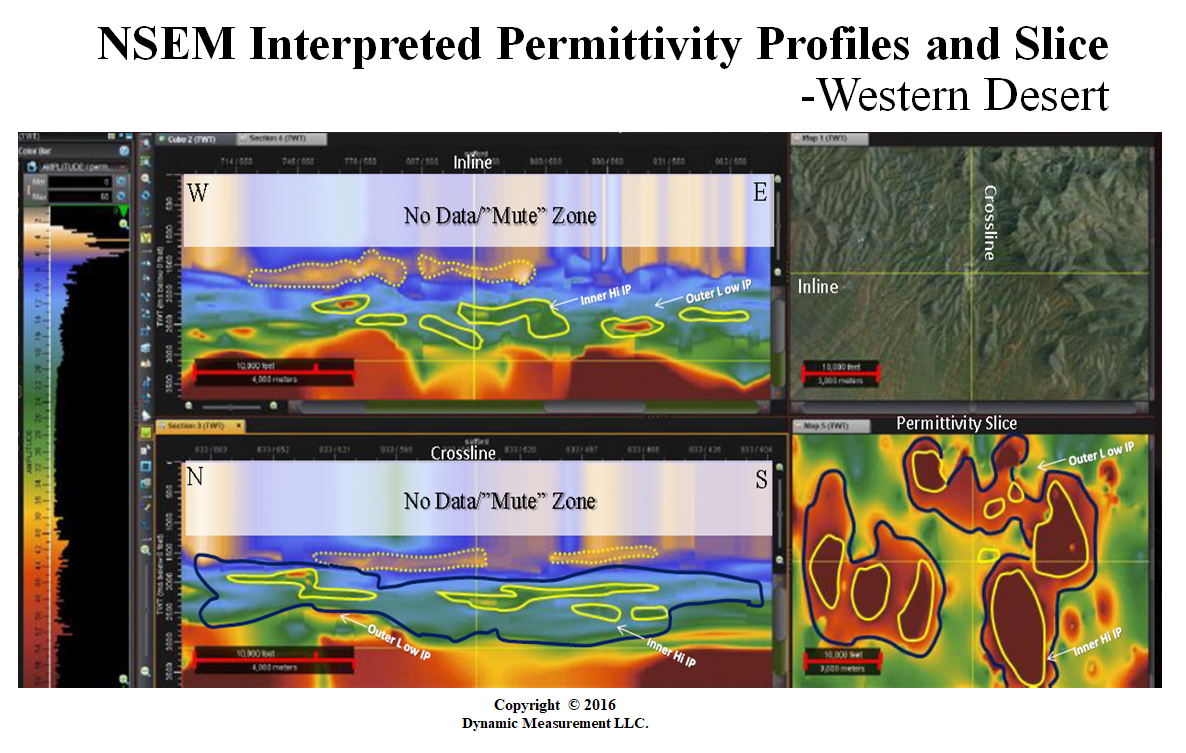
| Apparent Permitivity Before Muting Available | Interpretation of Apparent Permitivity |
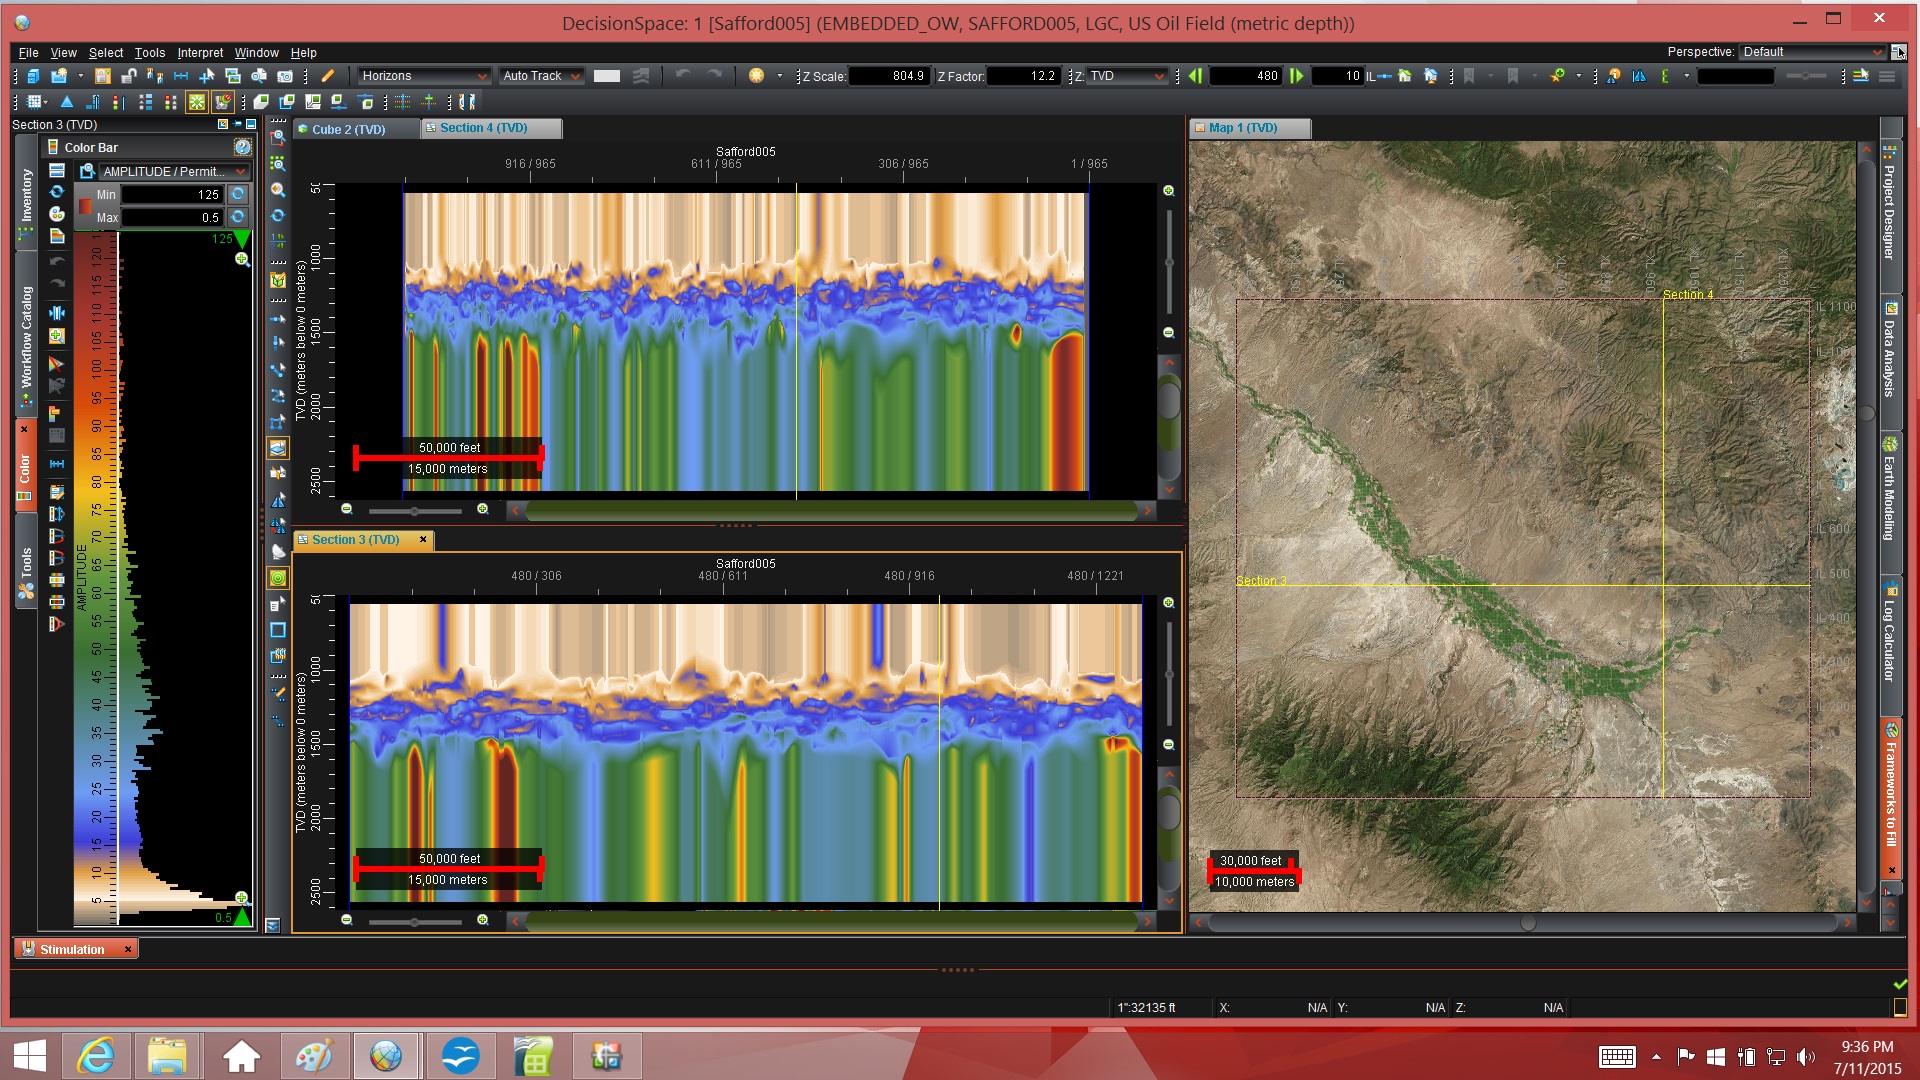
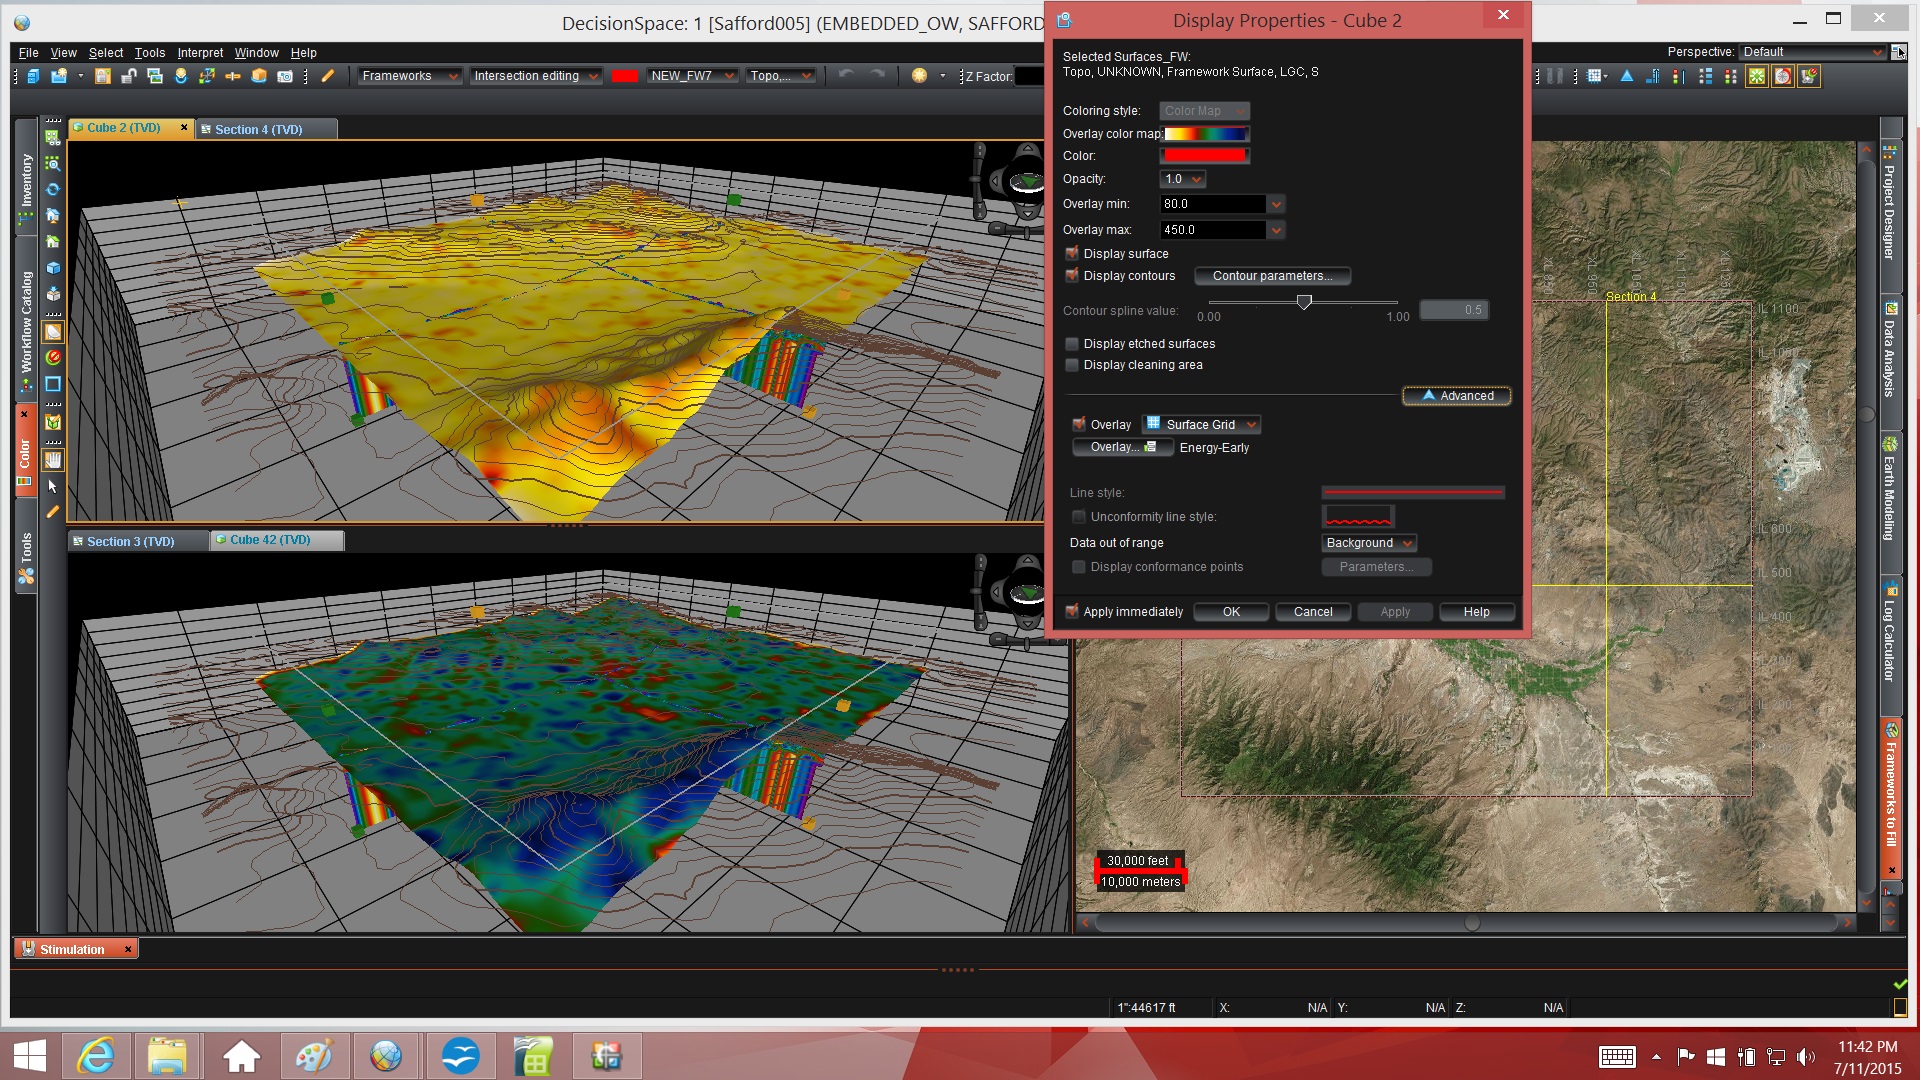
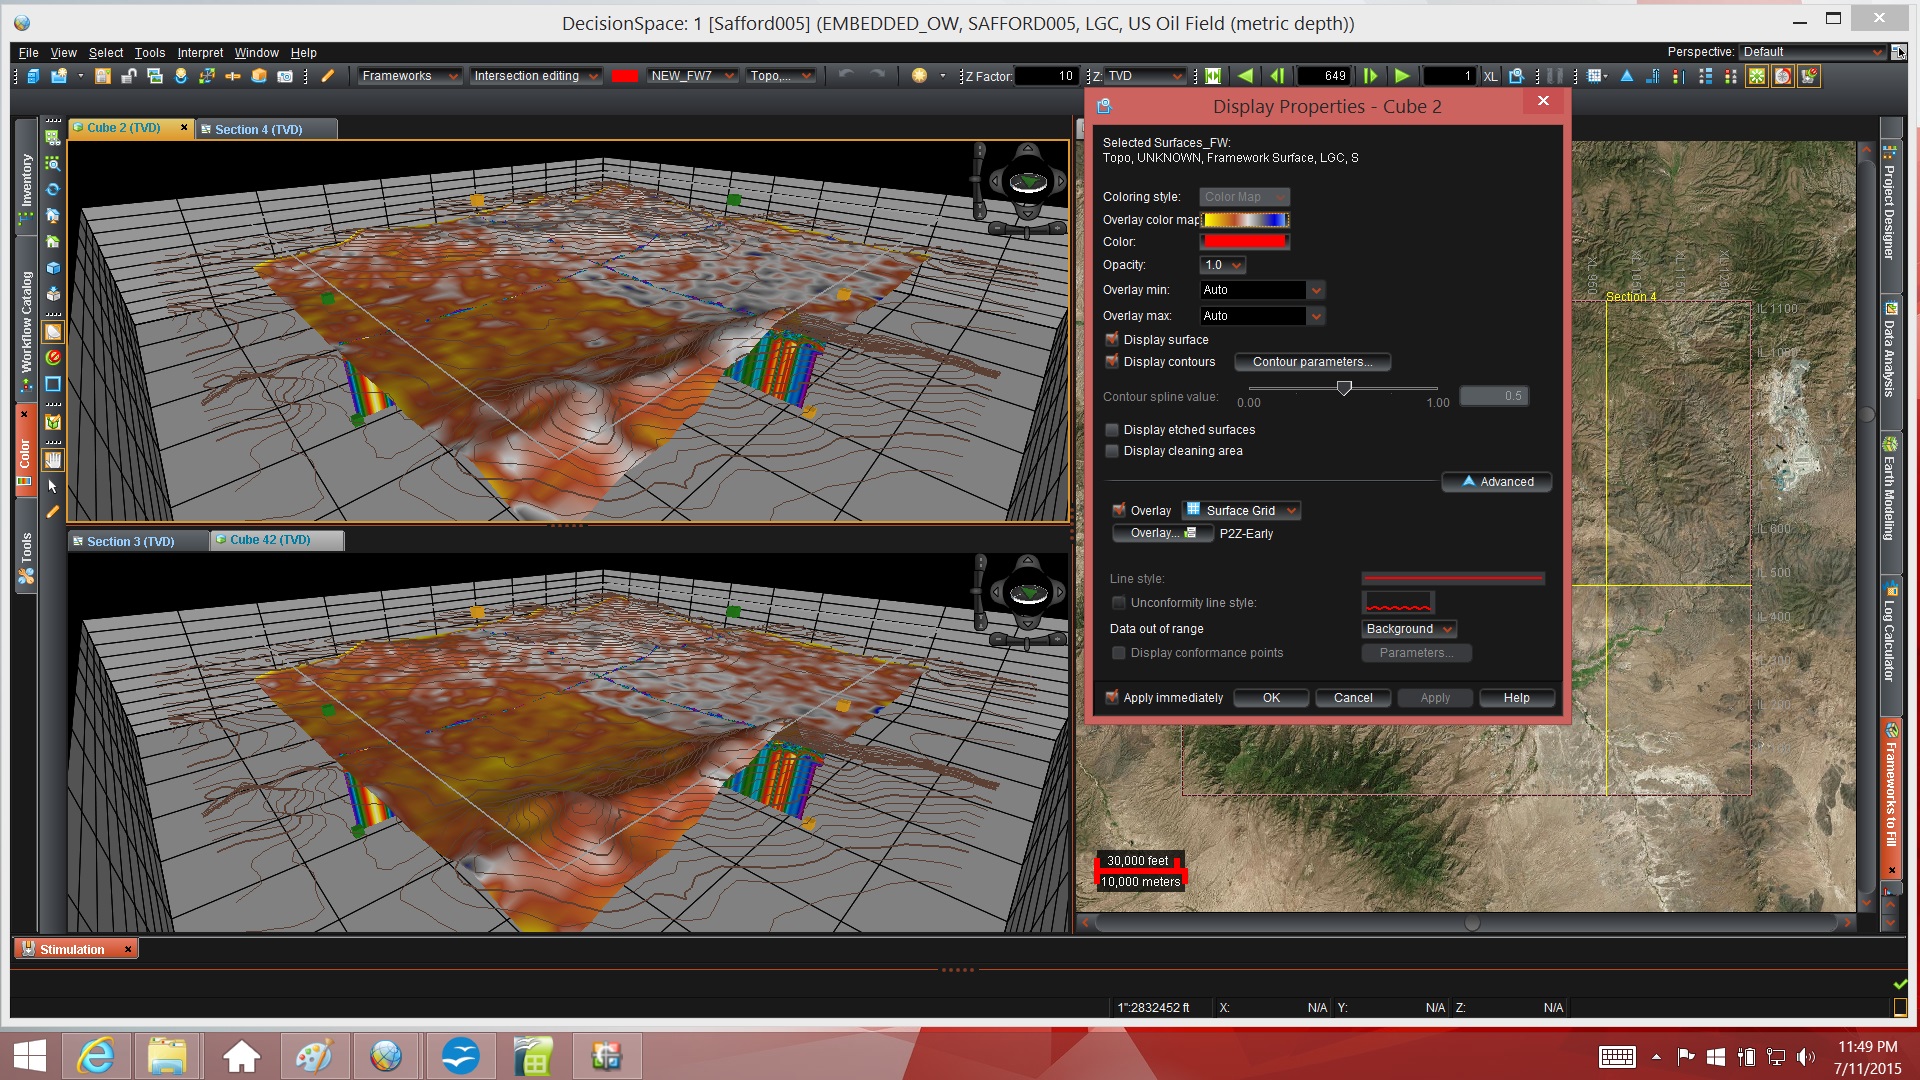
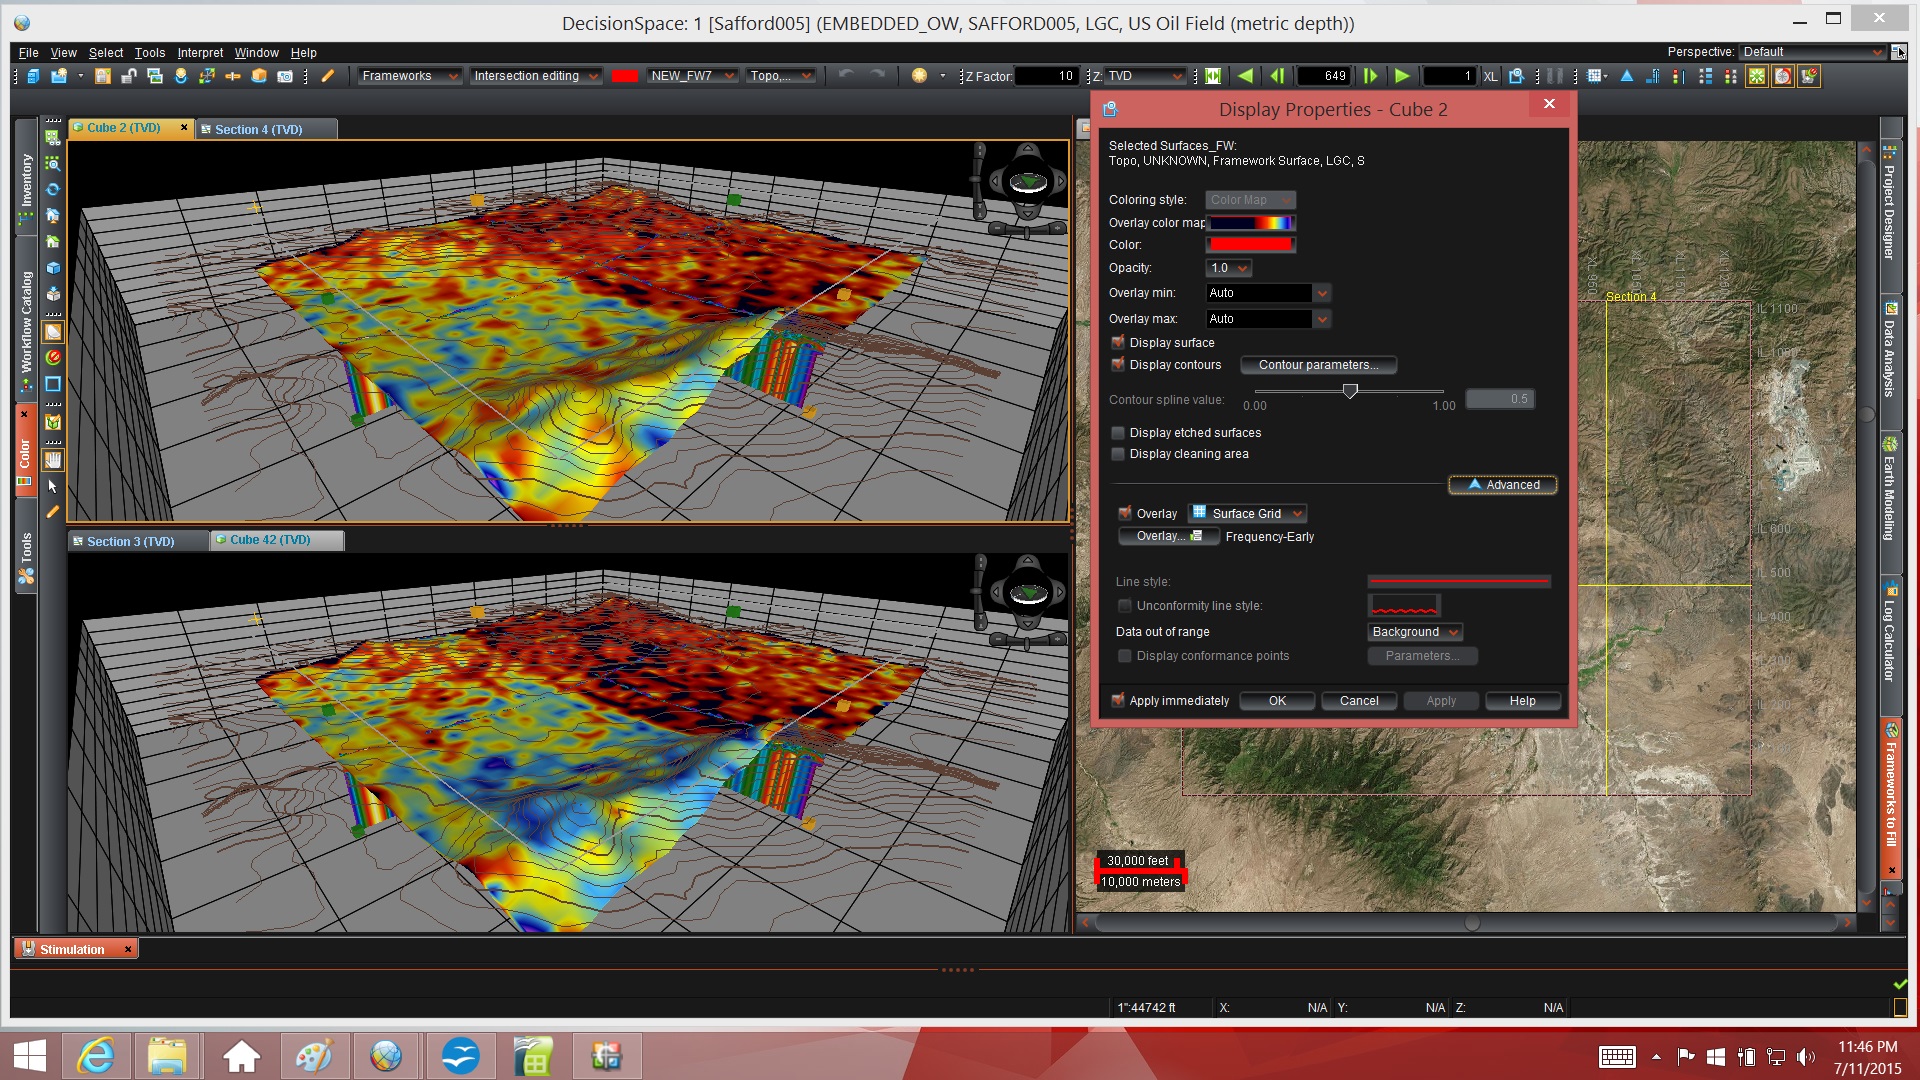
Animation With & Without Topo Static Applied | In-Line & X-Line without Topo Static Applied |
In-Line & X-Line Topo Static Without Mute | Same as to Left with Lower Gain and Moved Up |
Same as to Left with Mute Above First Data | Permittivity Before Topo Shift Available |
Permitivity with Top Static Applied | Same as to Left Moved Up |
 |  |
 |  |
 |  |
 |  |
 |  |
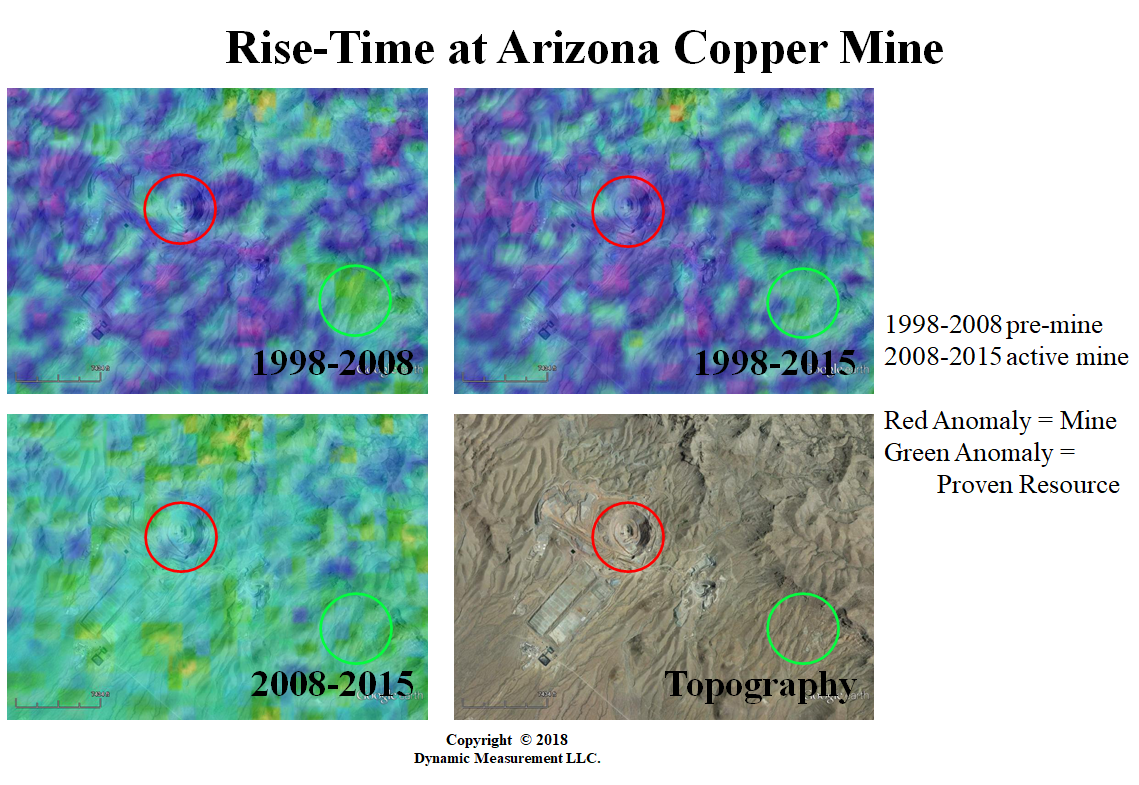
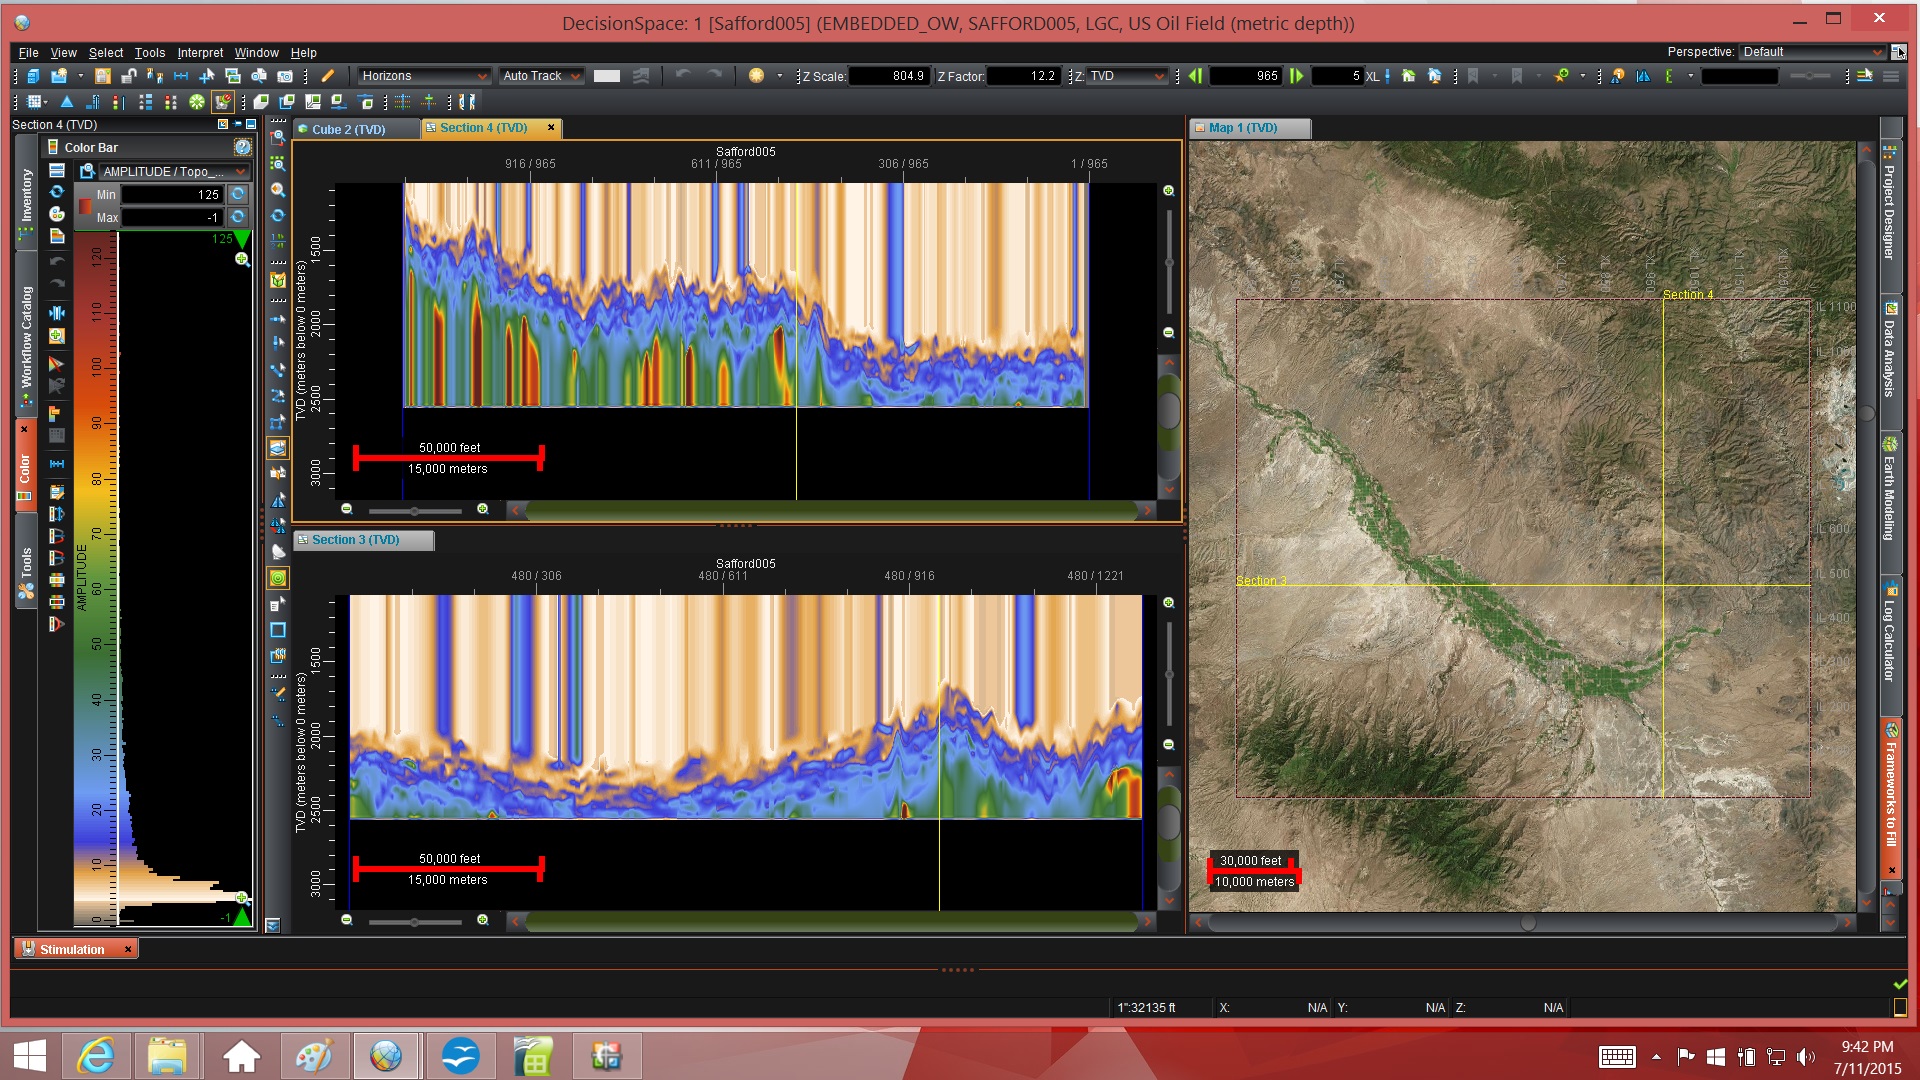
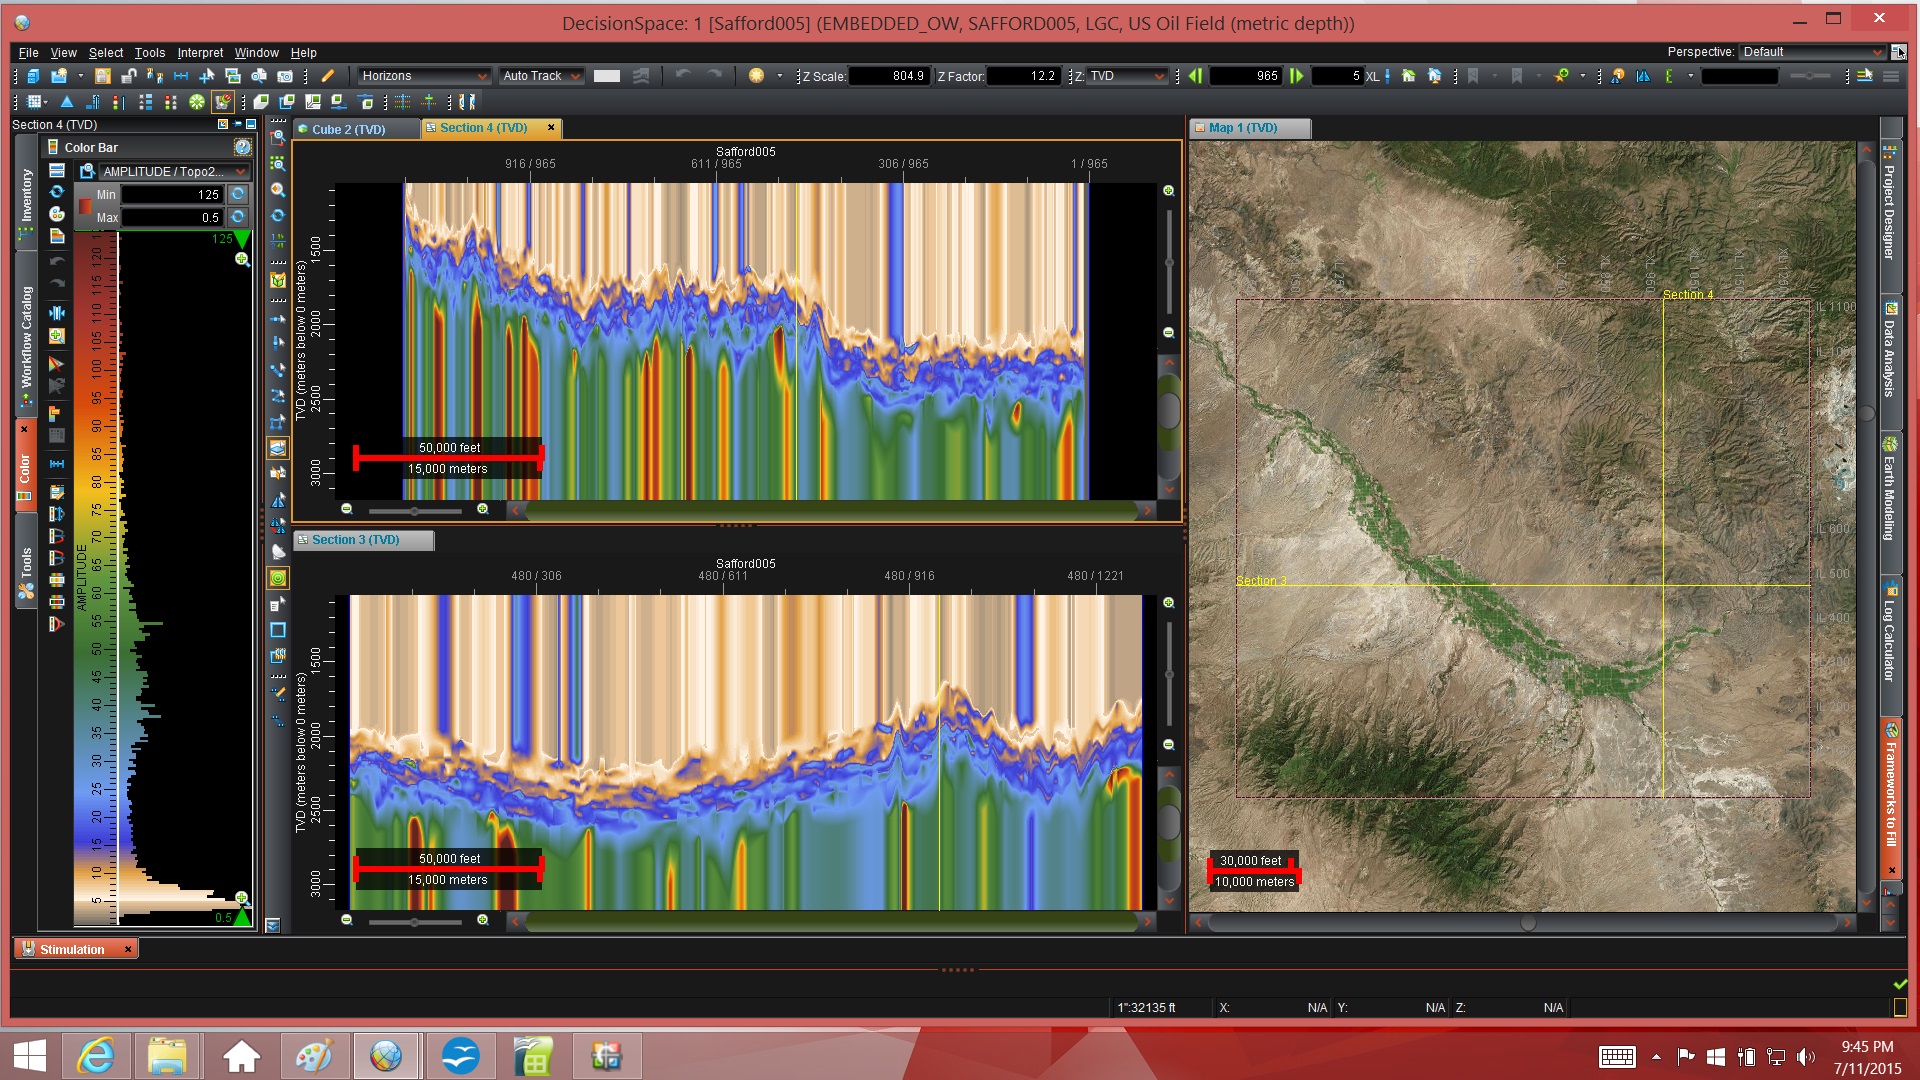
| Apparent Permittivity with Topo Static | Rise-Time Maps Before & After Mining Started |
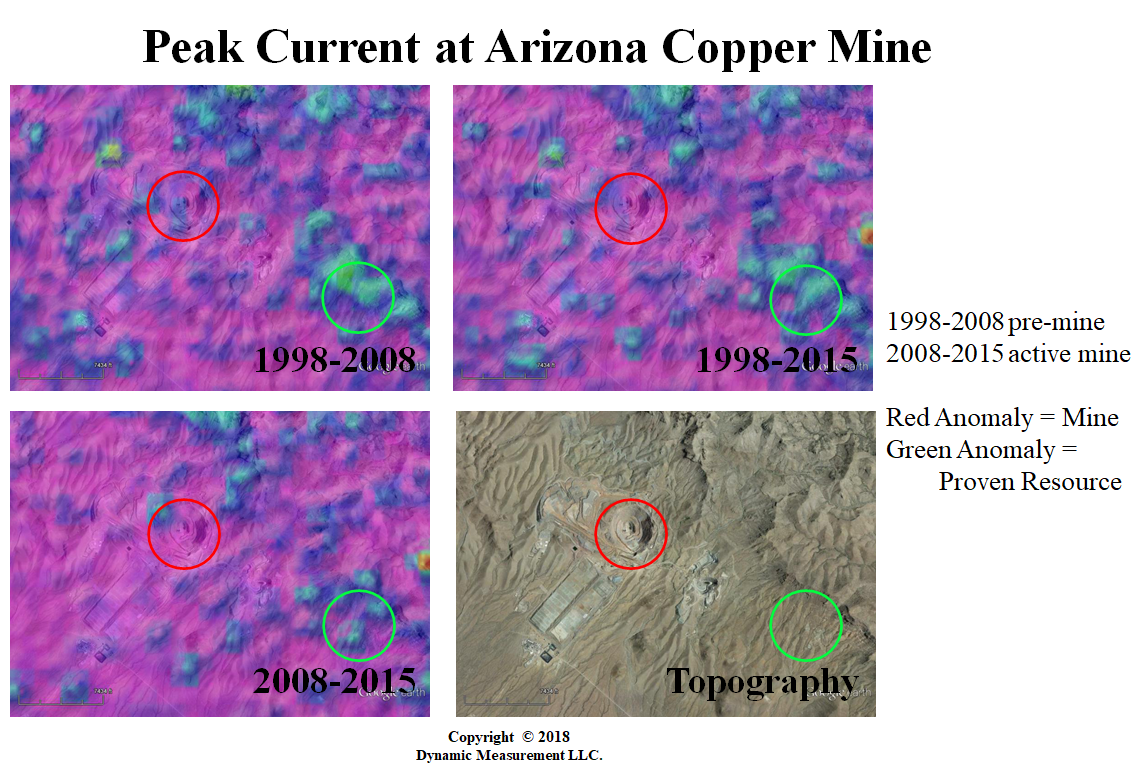
Absolute Peak Current B & A Mining Started | Negative Peak Current B & A Mining Started |
Positive Peak Current B & A Mining Started | Energy Map & Resistivity Map Bottom |
Energy Maps Before & After Mining Started | Frequencey Maps Before & After Mining Started |
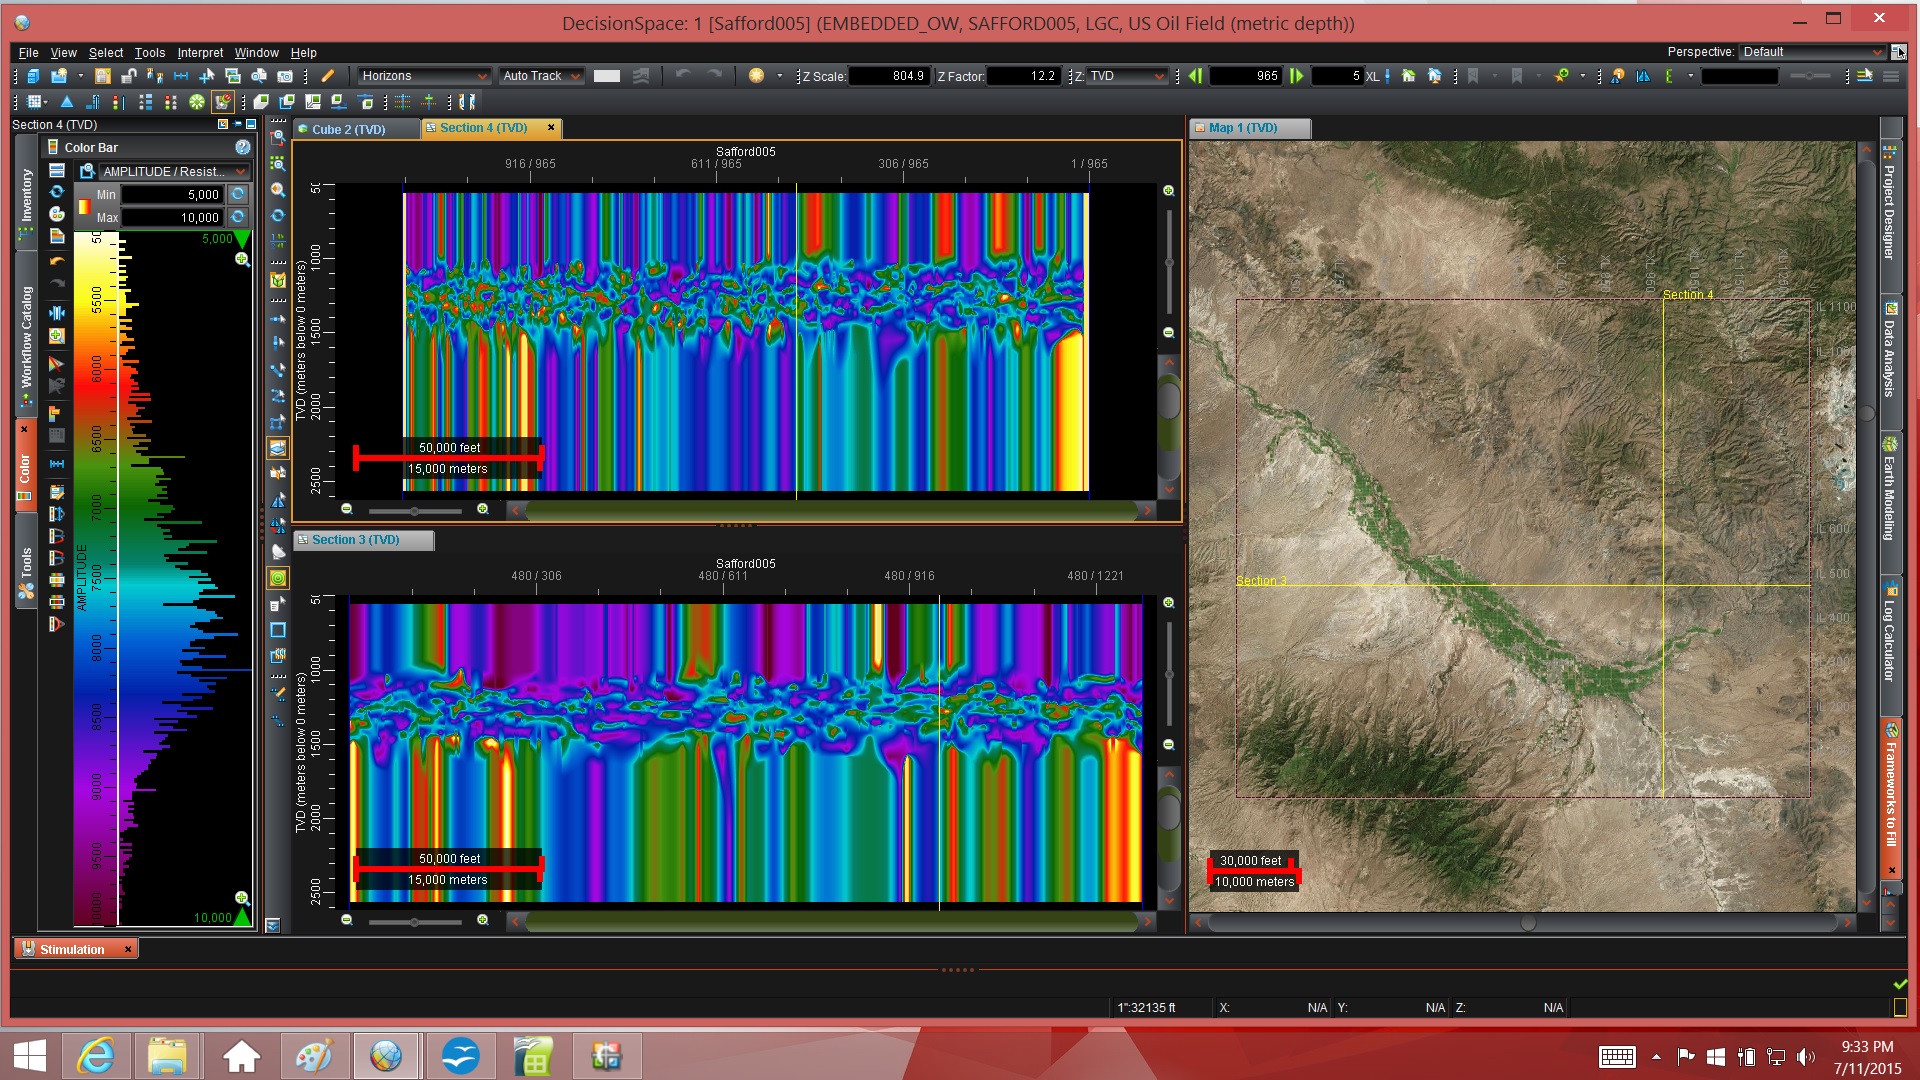
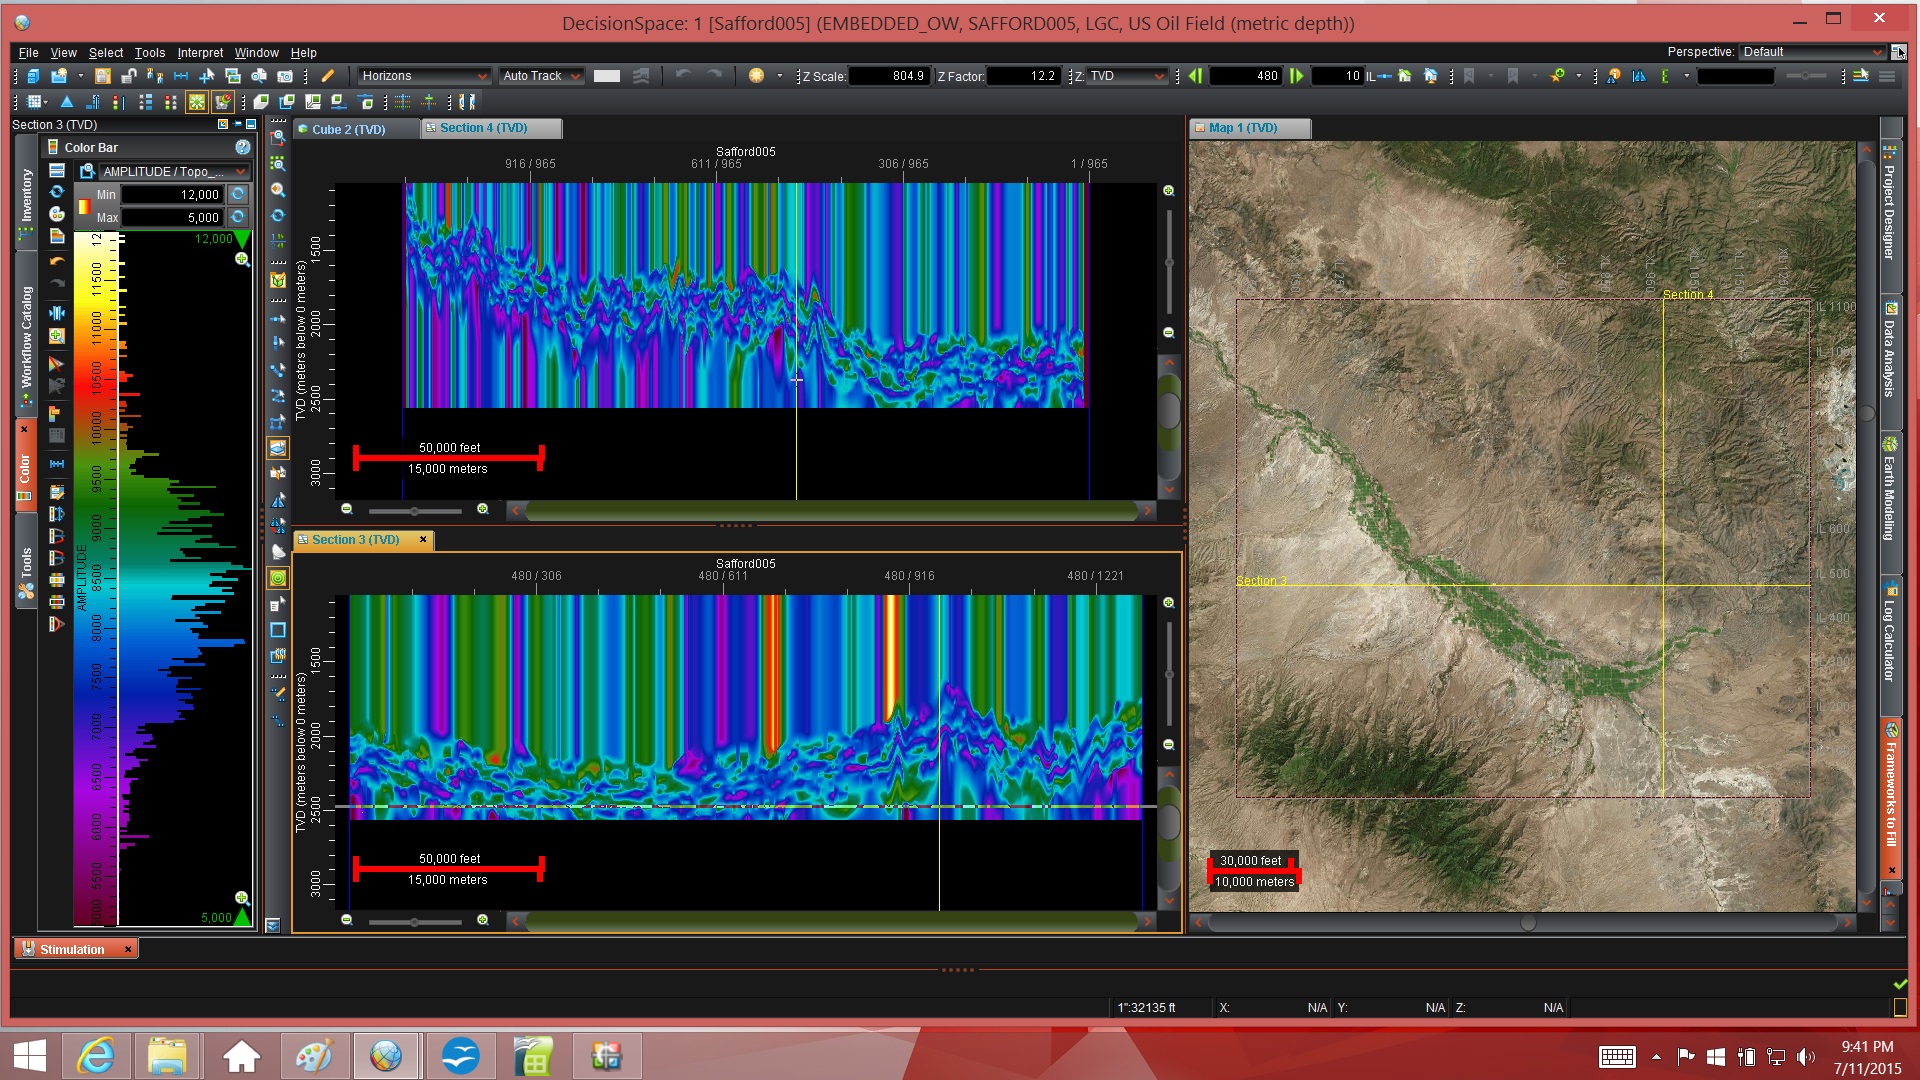
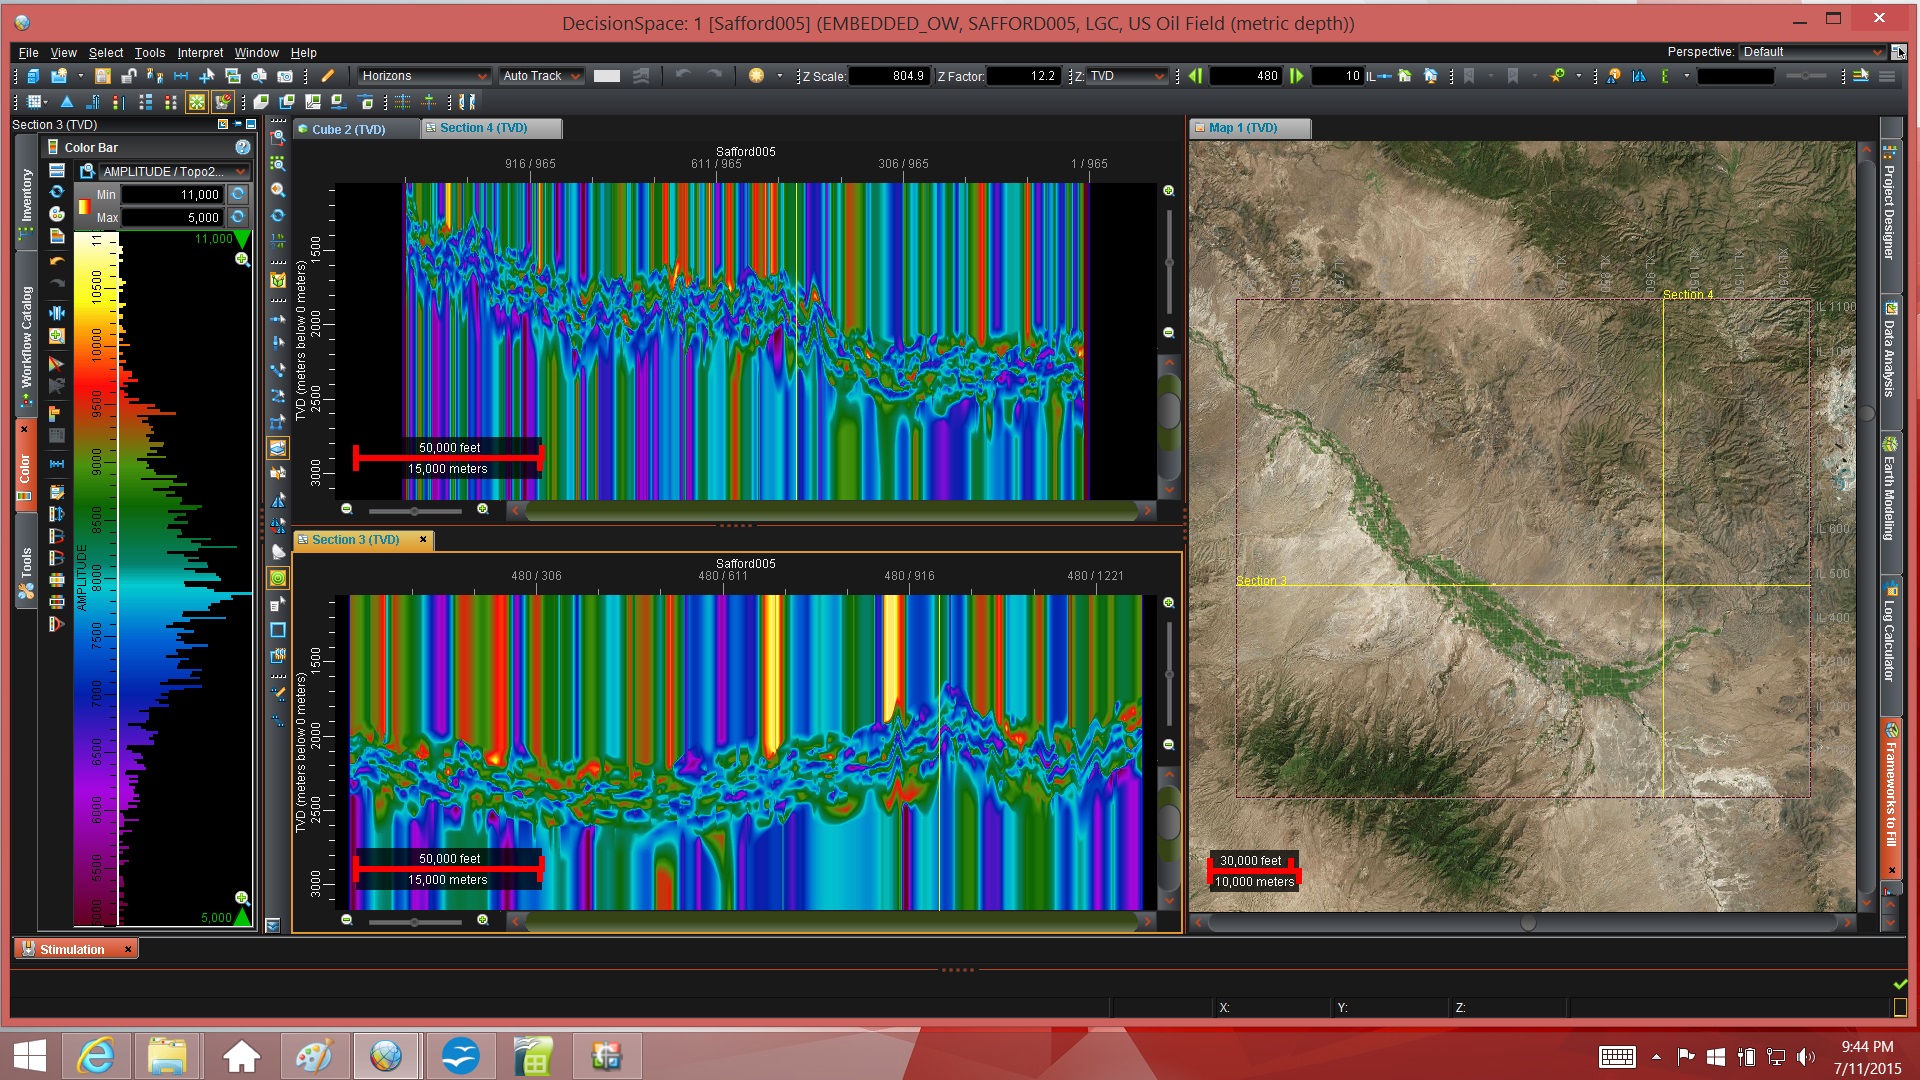
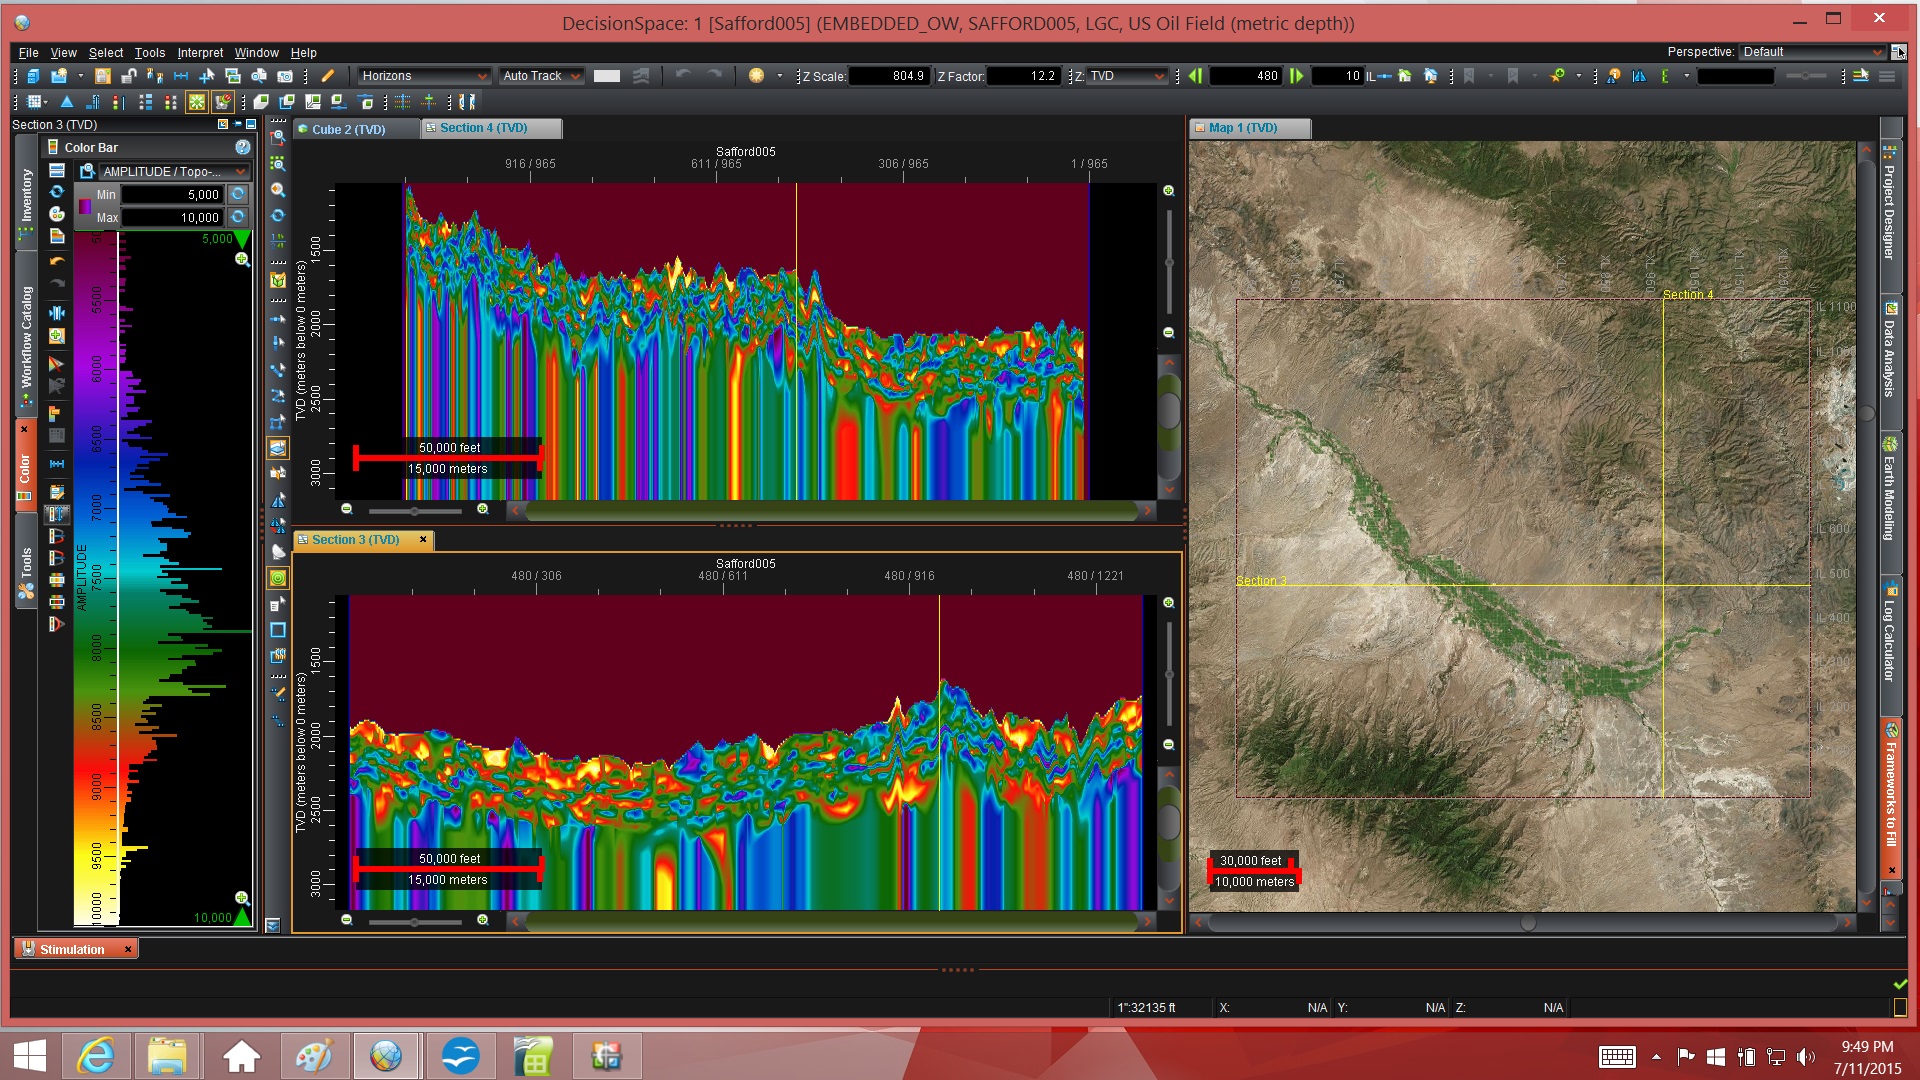
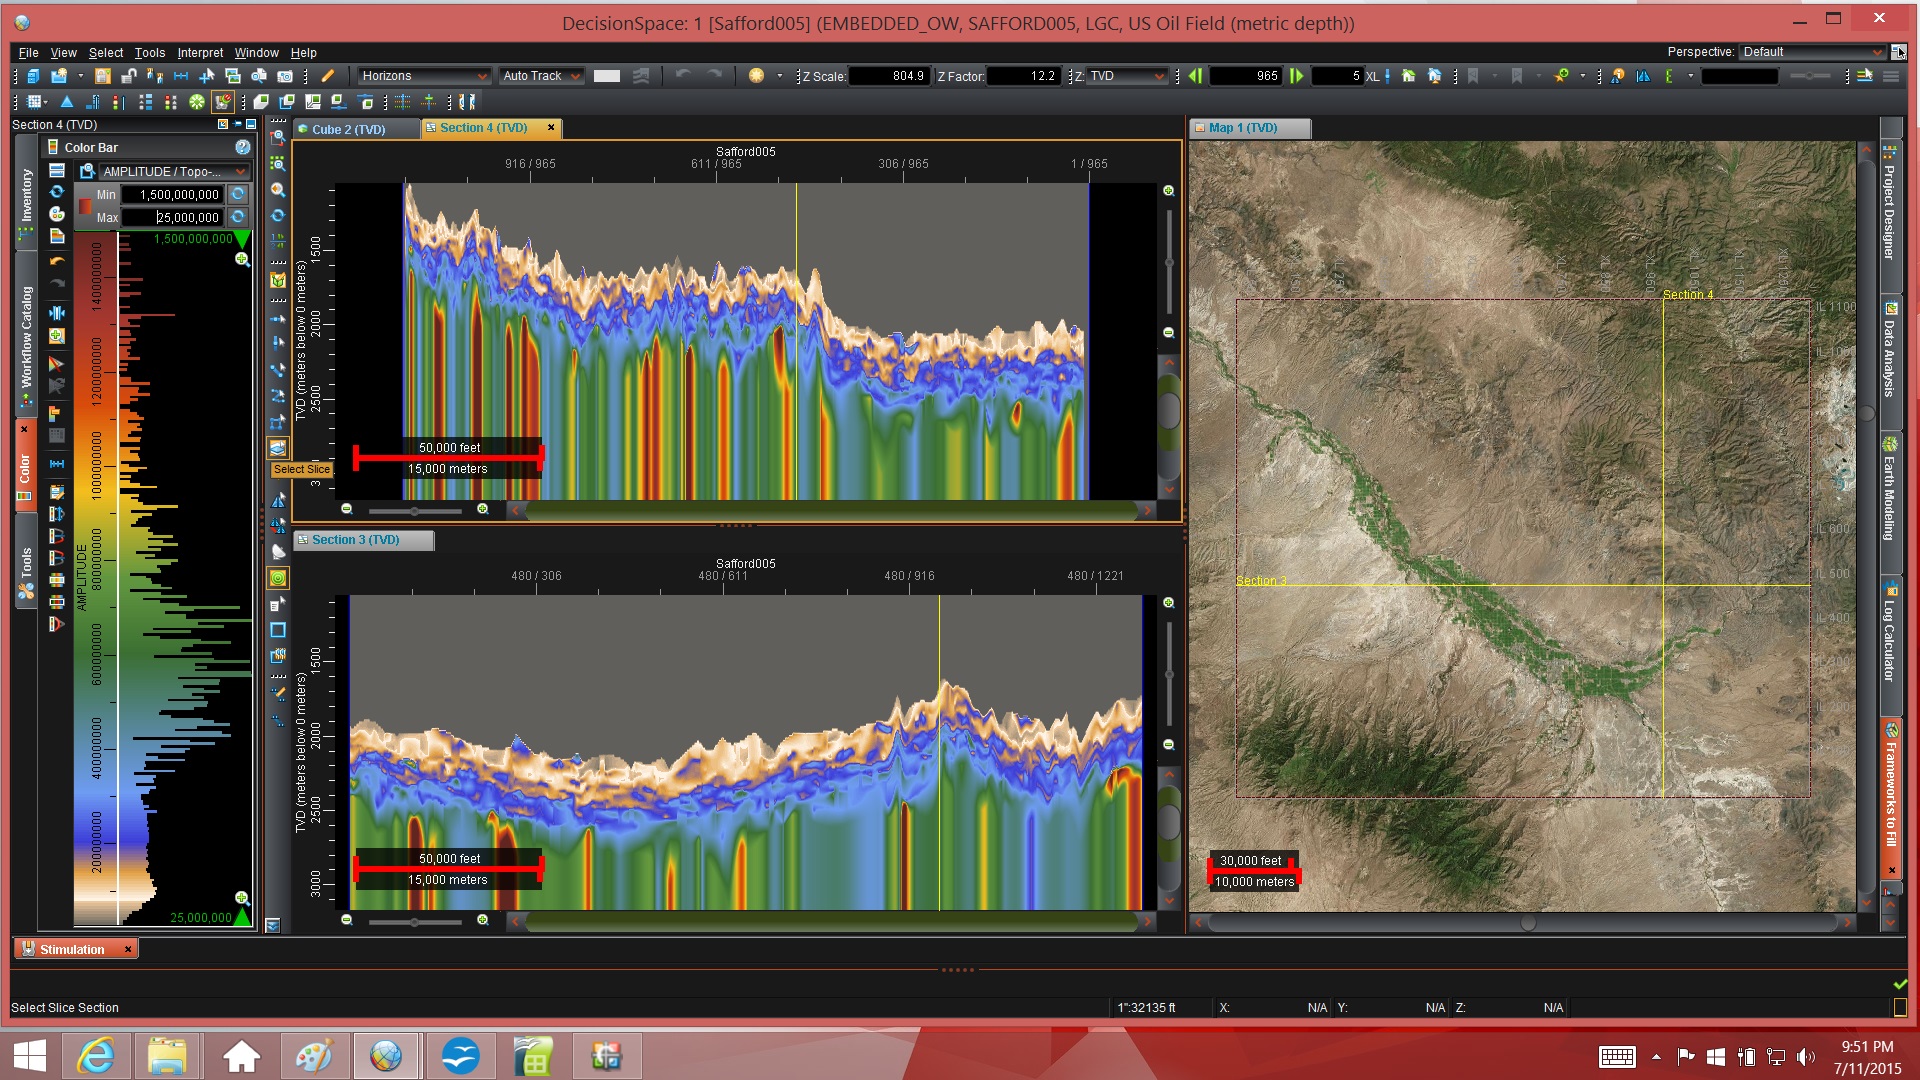
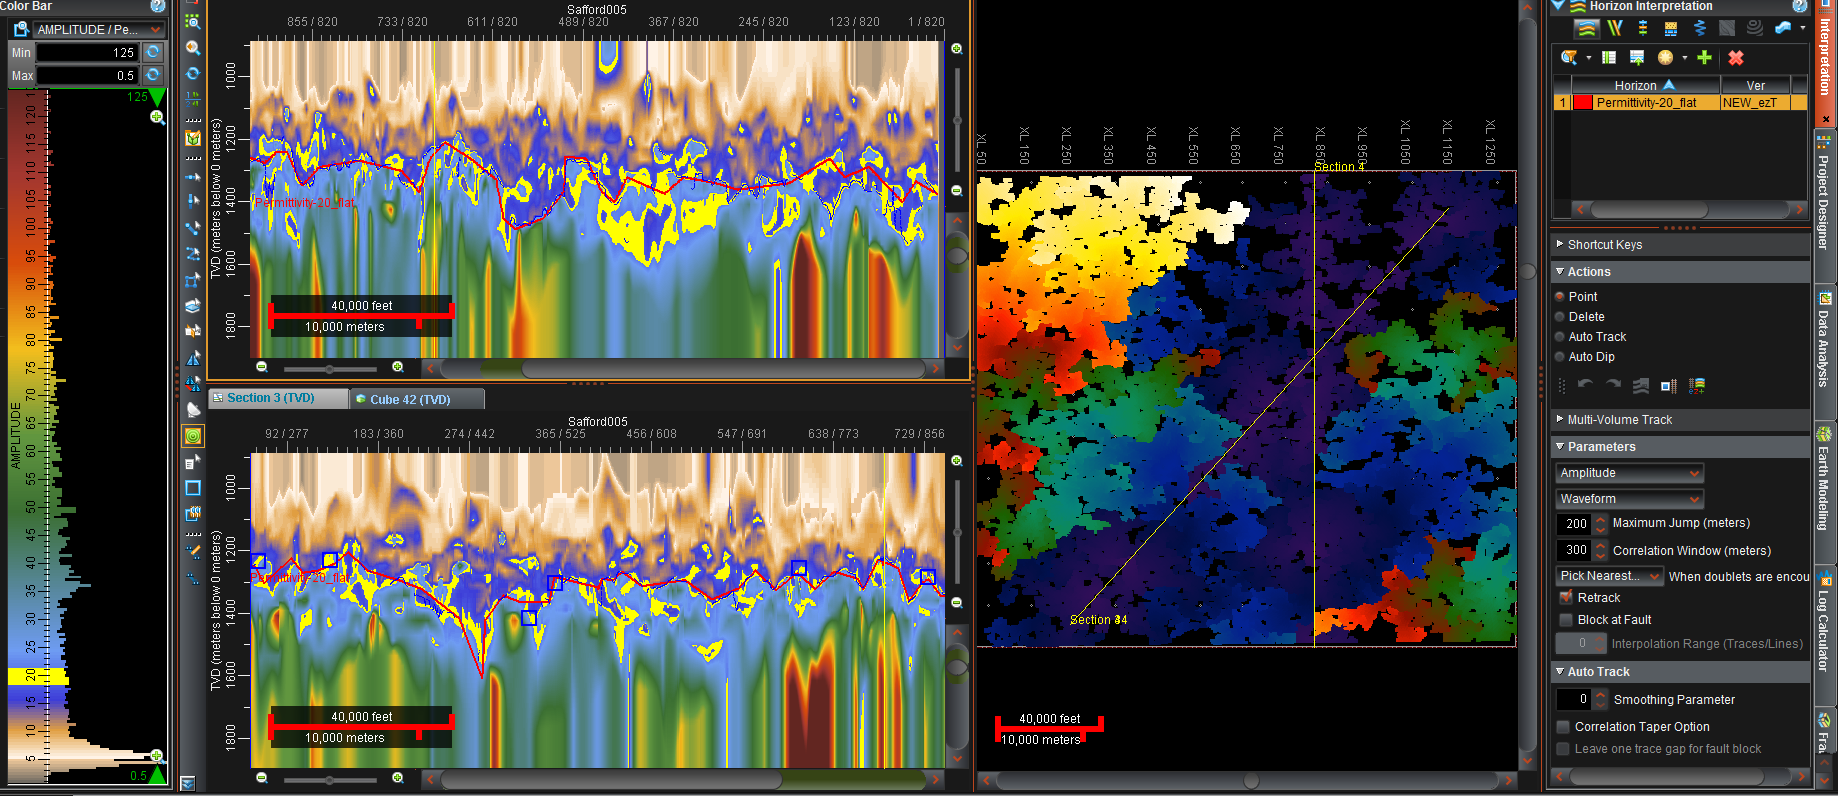
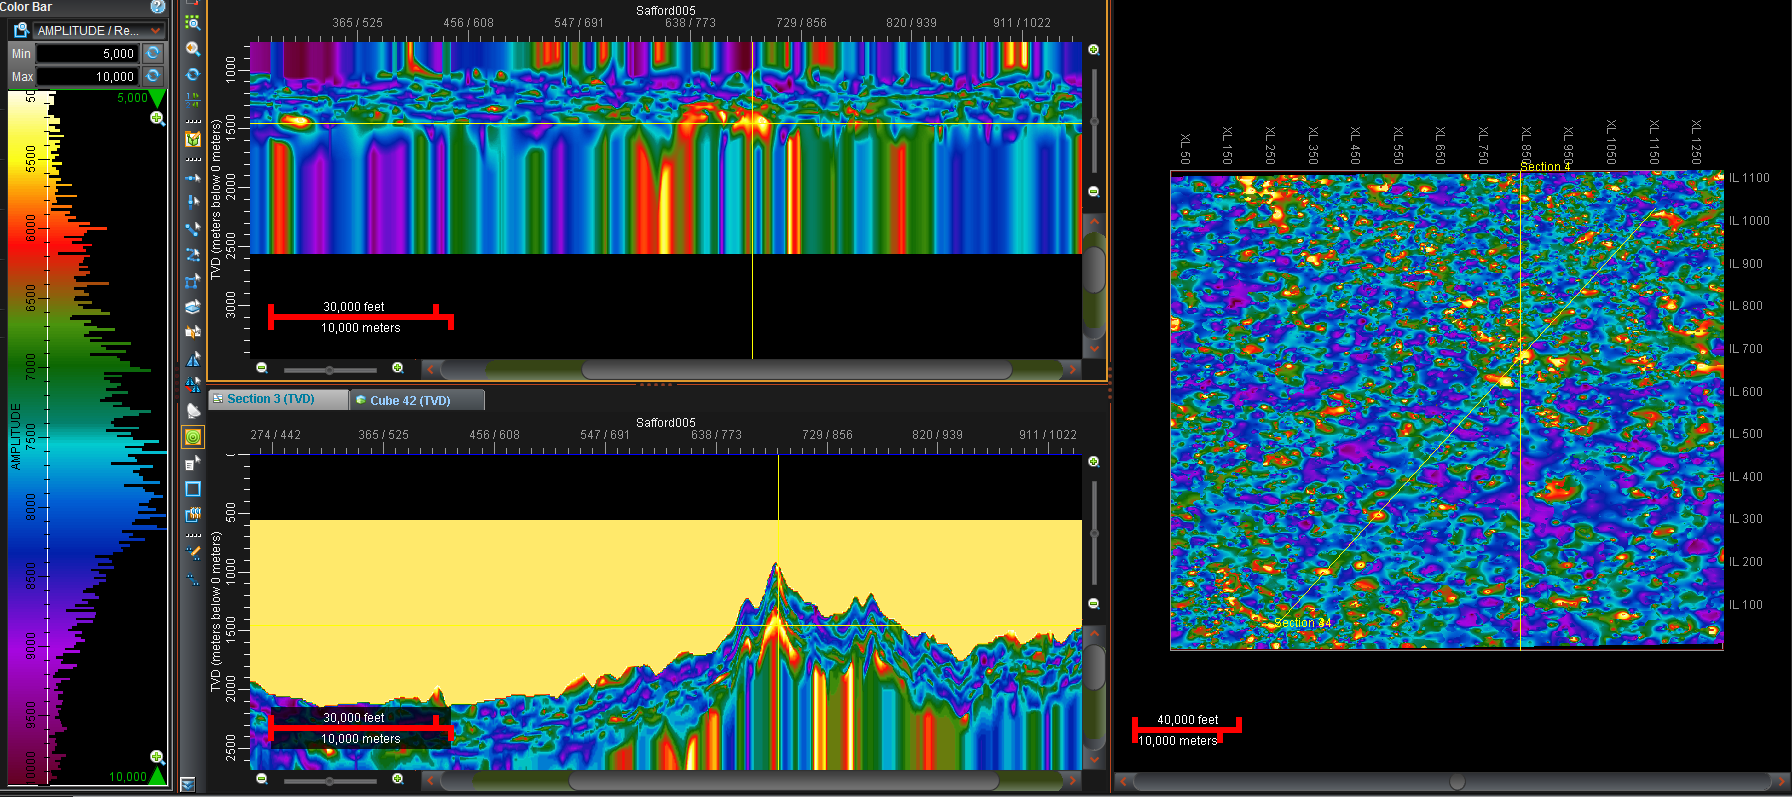
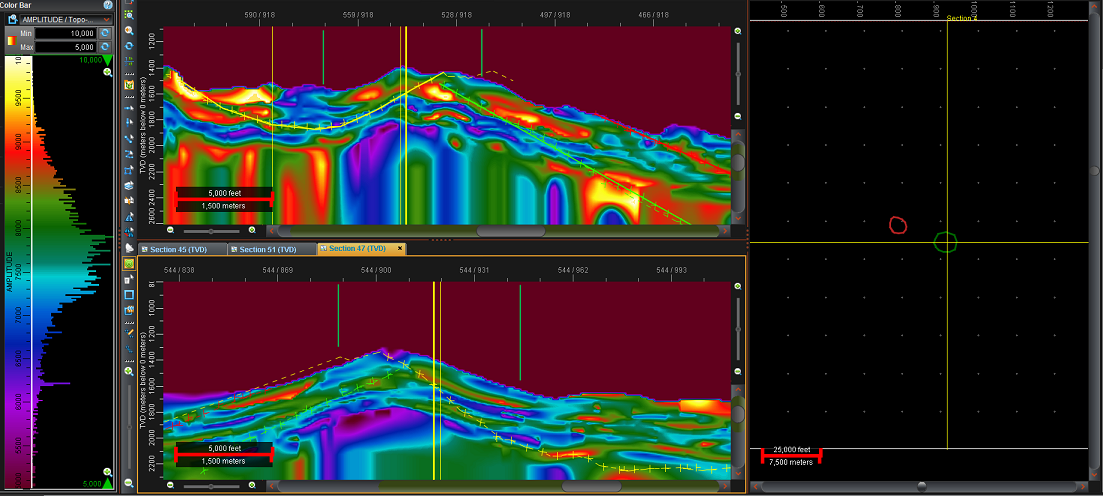
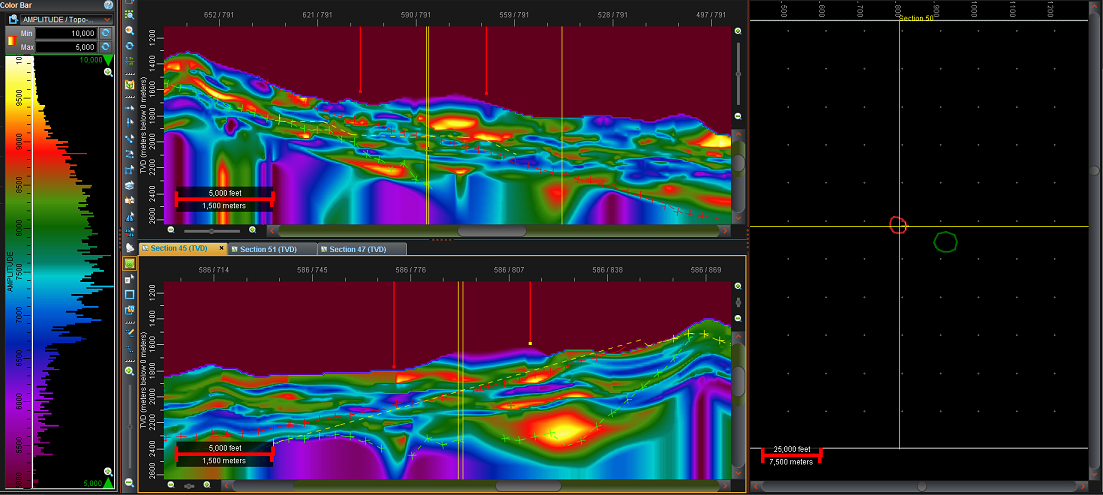
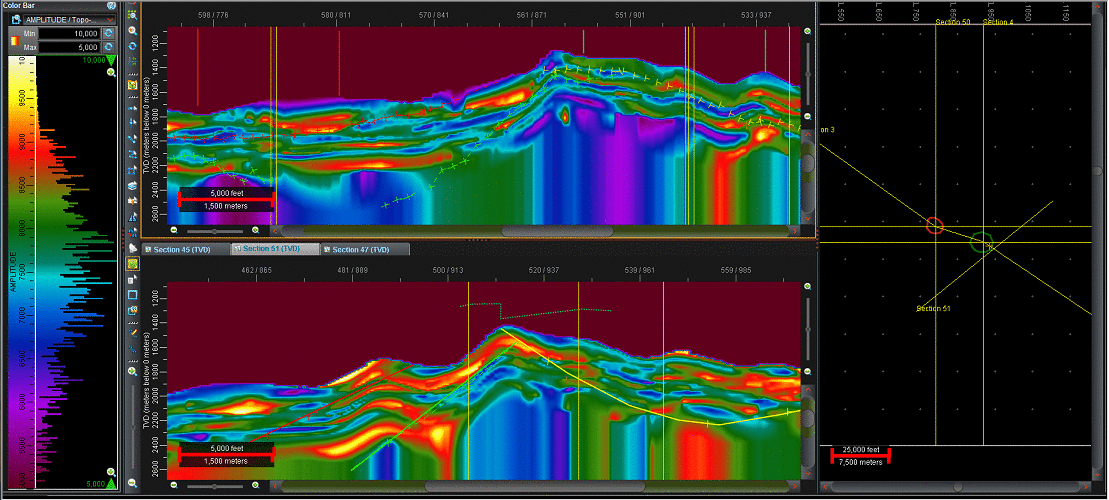
Resistivity Cross-Sections & Probe Cube in 3-D | Permittivity Automatic Horizon Picks |
 |  |
 |  |
 |  |
 |  |
 |  |
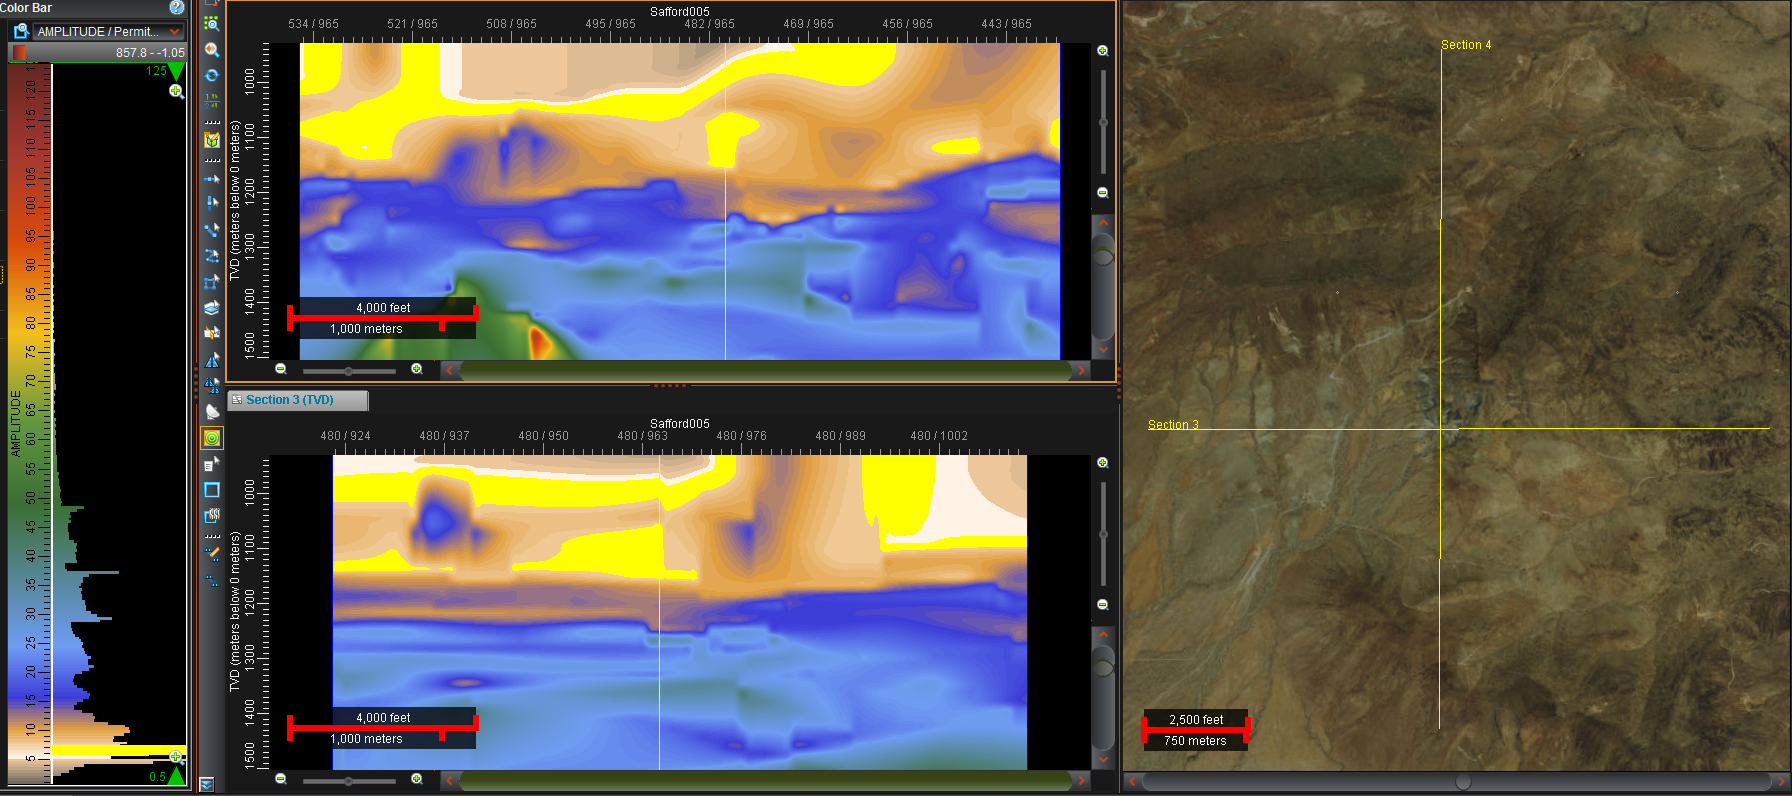
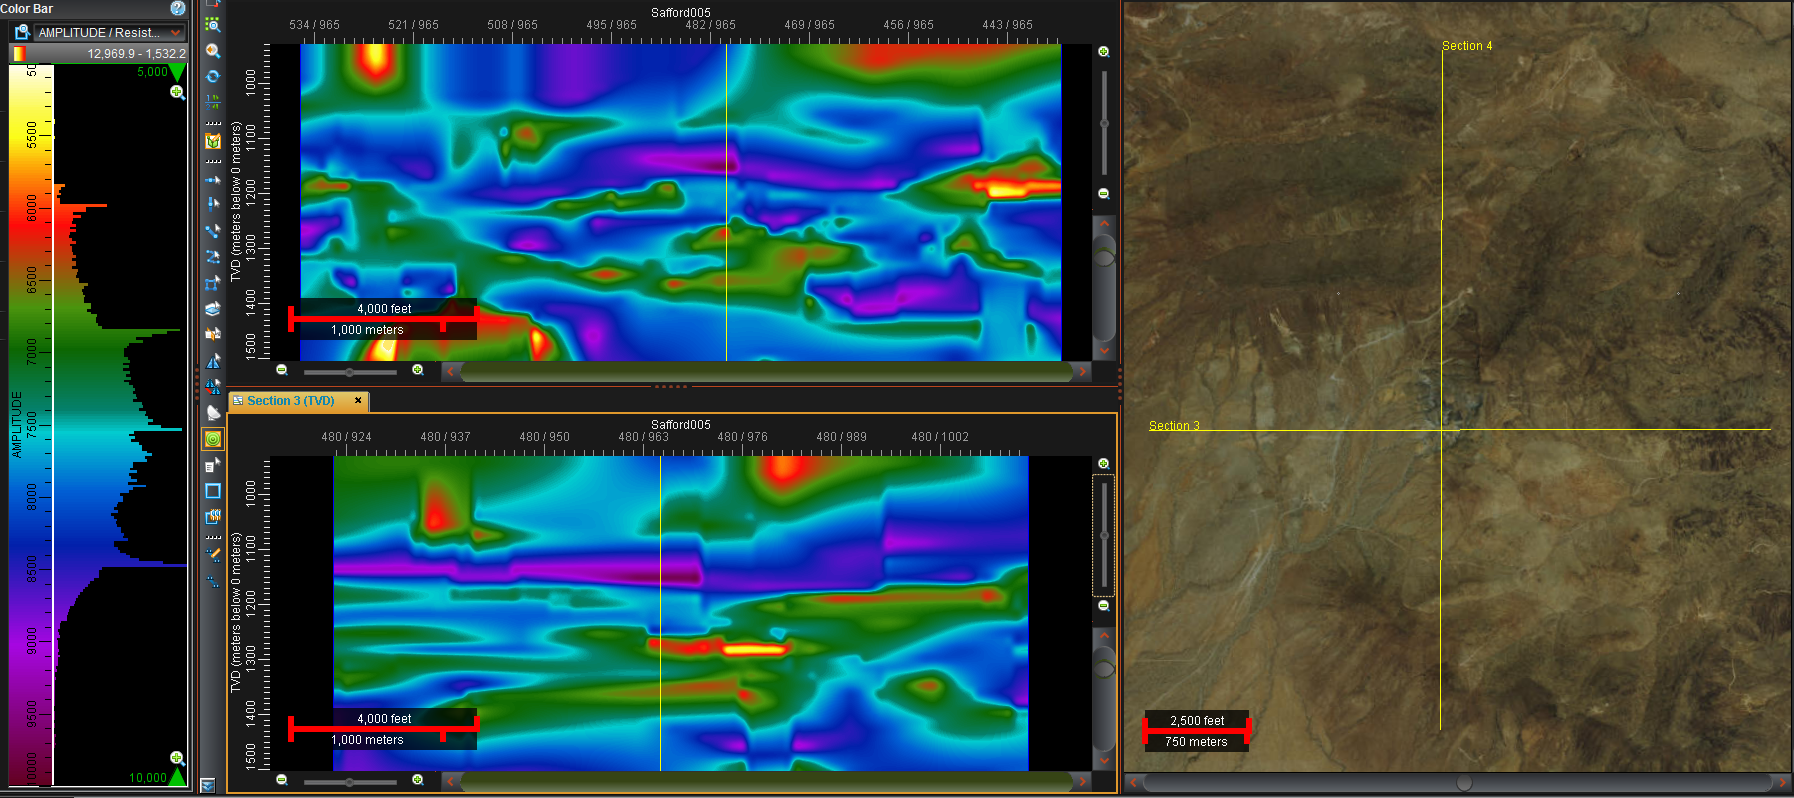
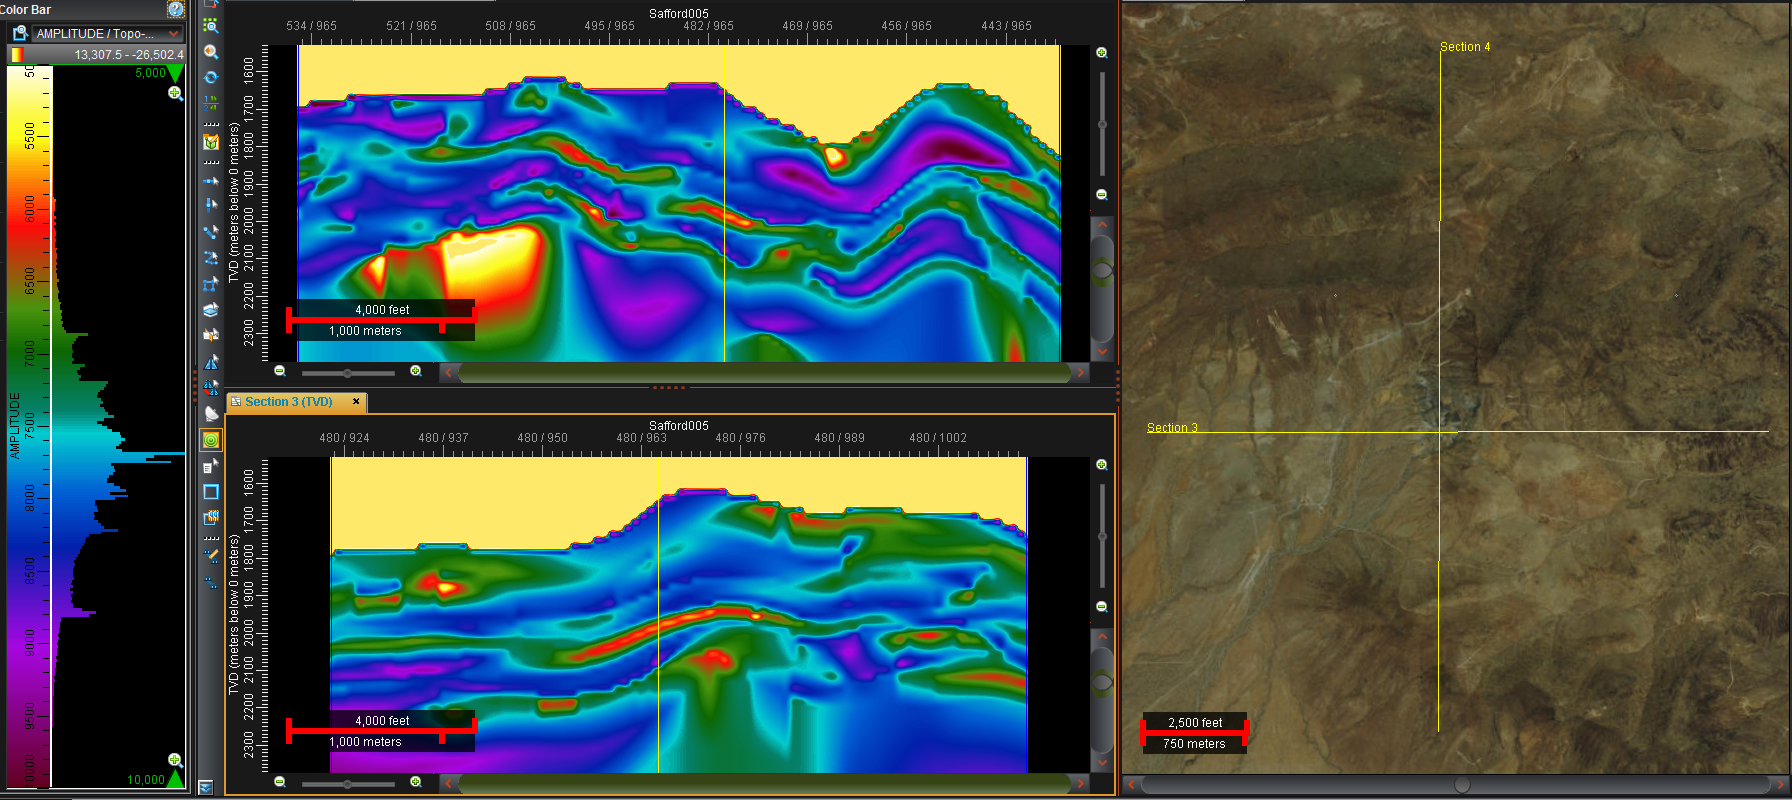
| Permitivity Flat and With Topographic Shift | Permittivity Over Mine Flat |
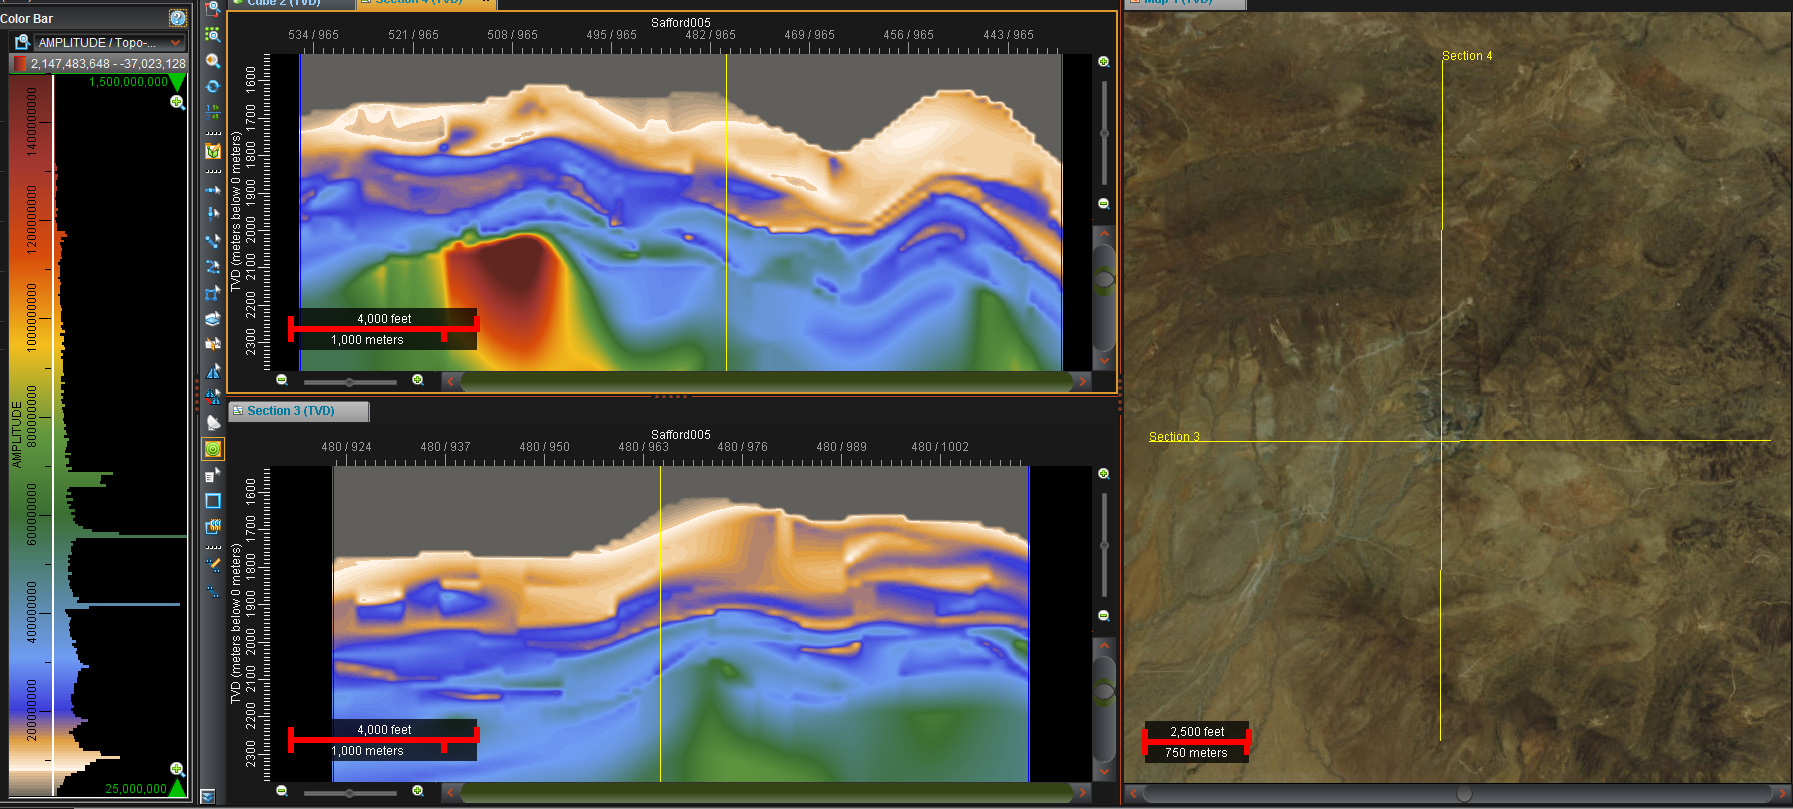
Permittivity Over Mine with Topographic Shift | Resistivity Flat, With Topographic Shift & Mute |
Resistivity Over Mine Flat | Resistivity Over Mine with Topo Shift & Mute |
Resistivity Mine and Blind Test Anomalies | In-Line X-Line Through Green Anomaly |
In-Line X-Line Through Green Anomaly | Dip Animation Through Both Anomalies |
 |  |
 |  |
 |  |
 |  |
 |  |
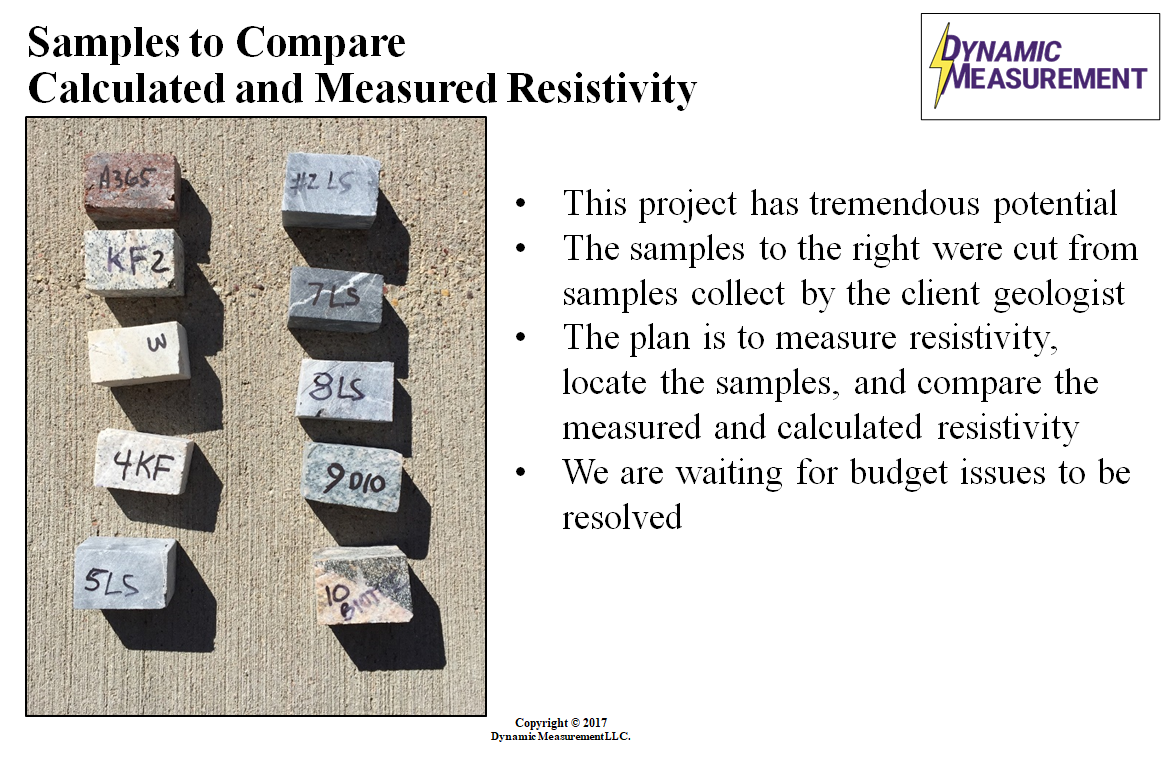
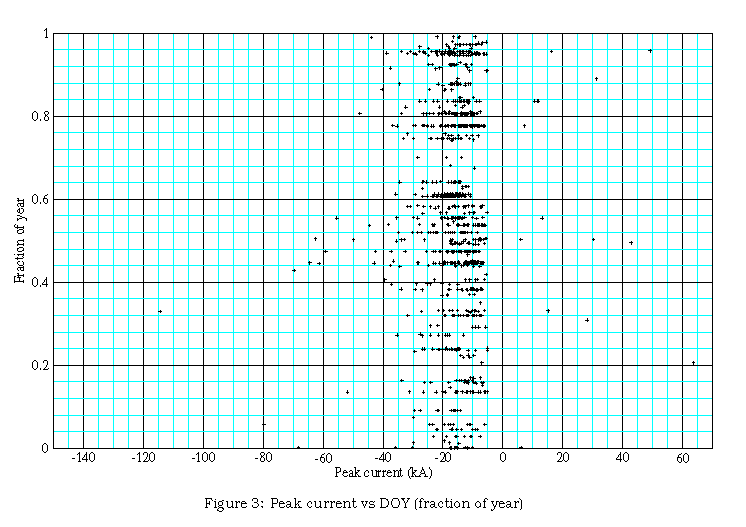
| Samples to Measure Resistivity | Peak-Current vs. Day of Year Cross-Plot |
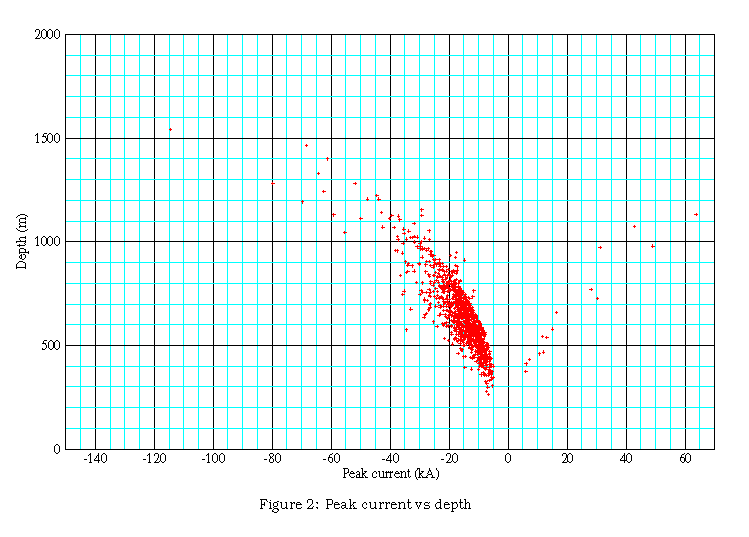
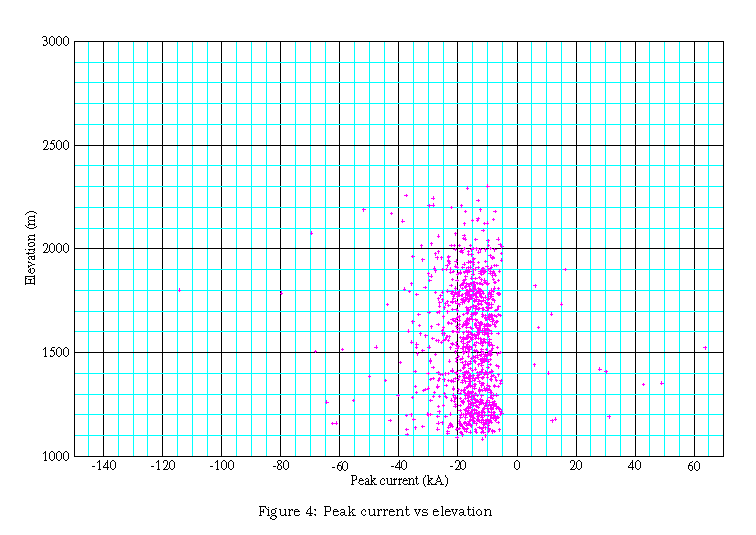
Peak-Current vs. Depth Cross-Plot | Peak-Current vs. Elevation Cross-Plot |
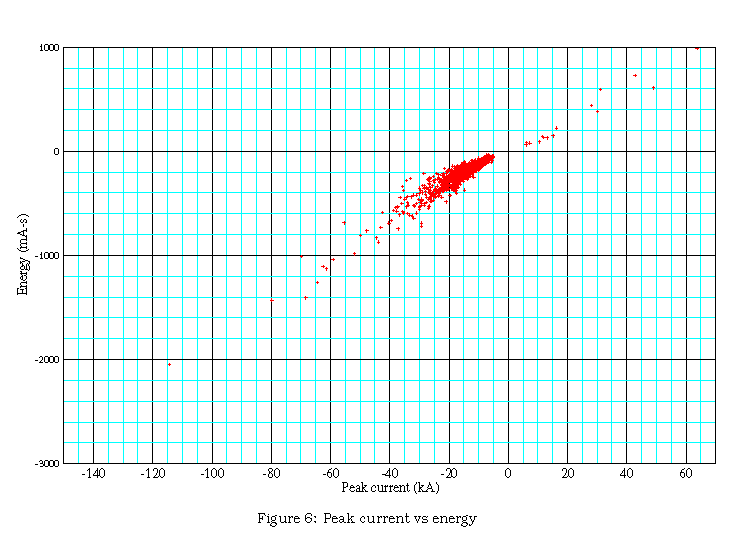
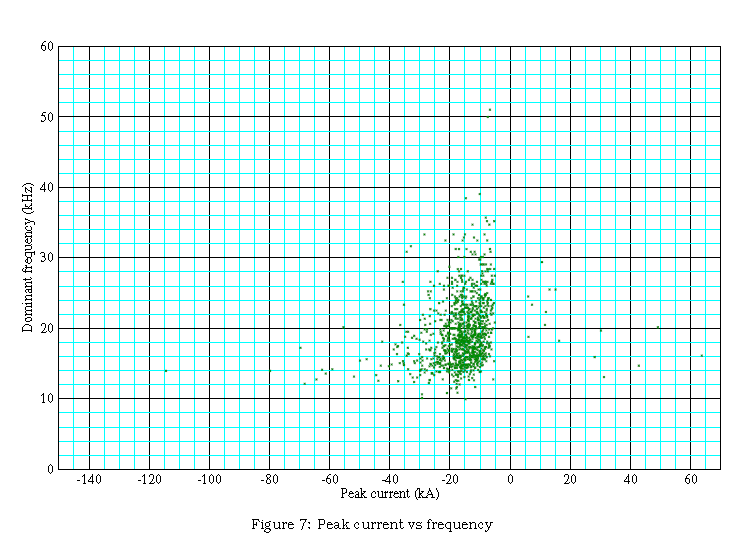
Peak-Current vs. Energy Cross-Plot | Peak-Current vs. Frequency Cross-Plot |
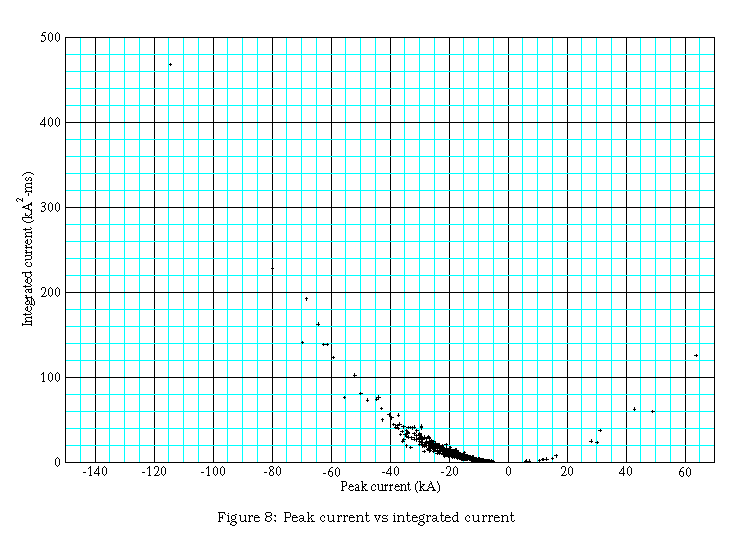
Peak-Current vs. Integrated Current Cross-Plot | Peak-Current vs. Moon Local Longitude |
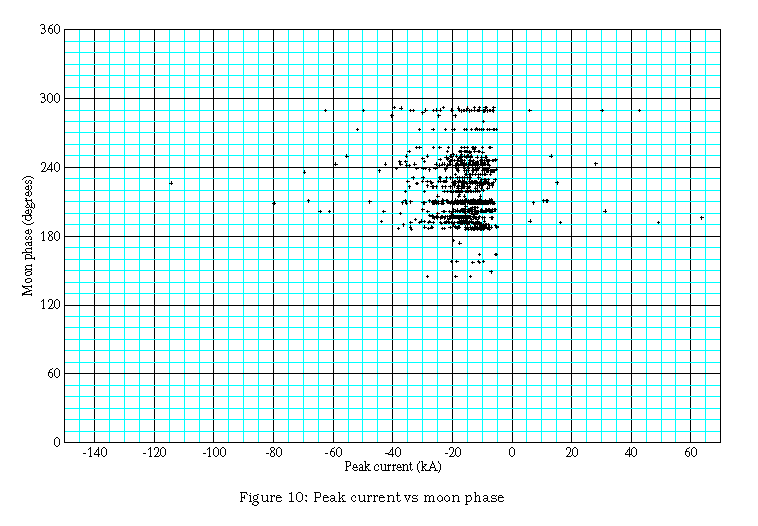
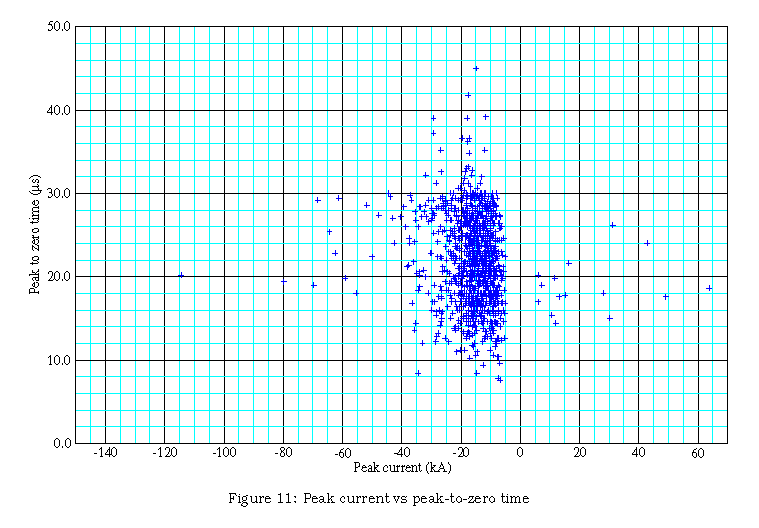
Peak-Current vs. Moon Phase Cross-Plot | Peak-Current vs. Peak-to-Zero Time Cross-Plot |
 |  |
 |  |
 |  |
 |  |
 |  |
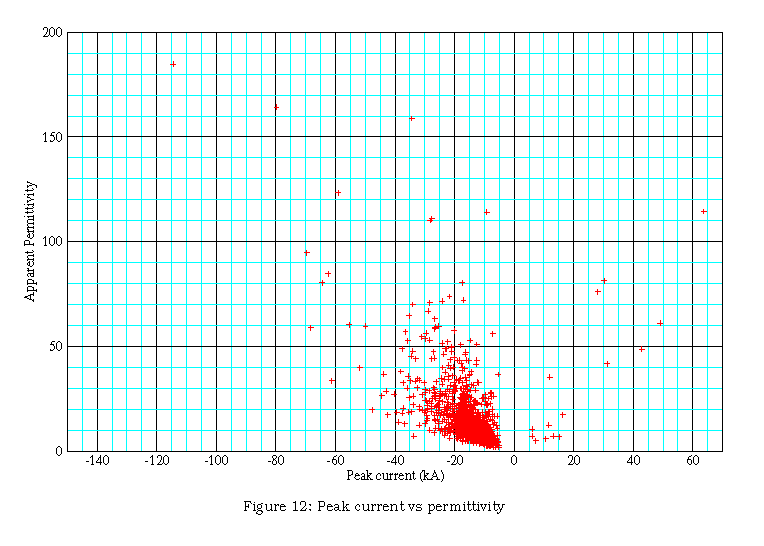
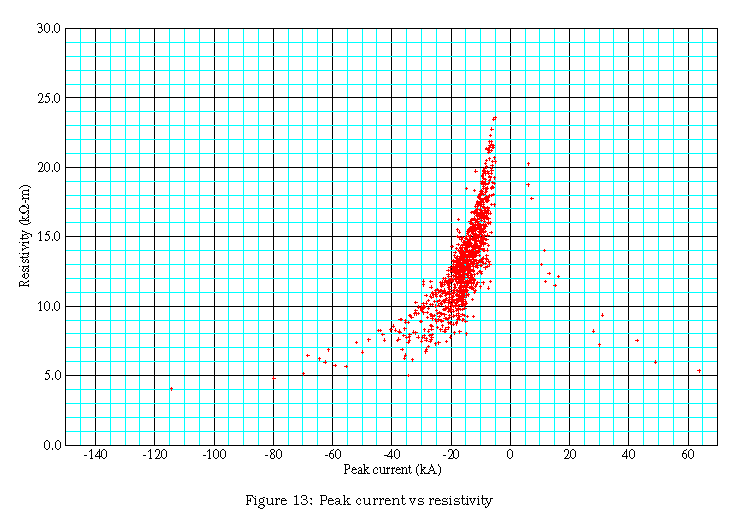
| Peak-Current vs. Permittivity Cross-Plot | Peak-Current vs. Resistivity Cross-Plot |
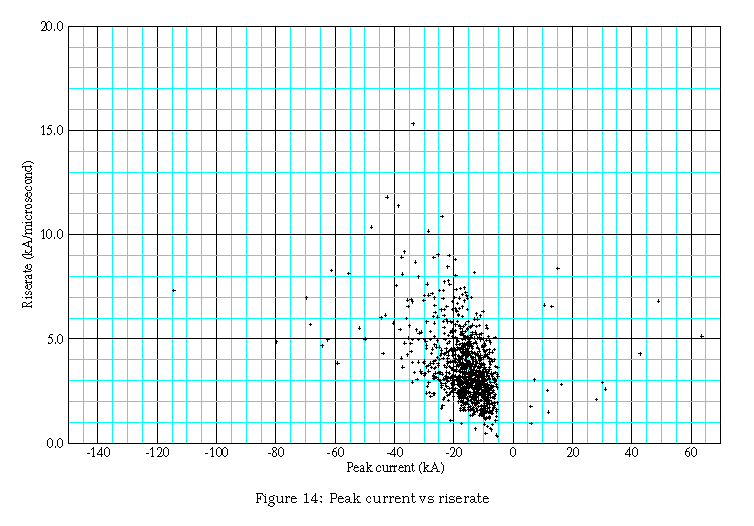
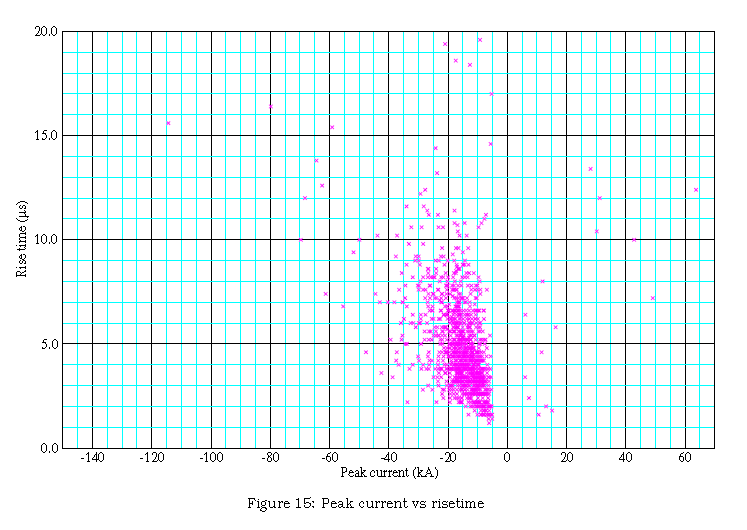
Peak-Current vs. Rate-of_Rise-Time Cross-Plot | Peak-Current vs. Rise-Time Cross-Plot |
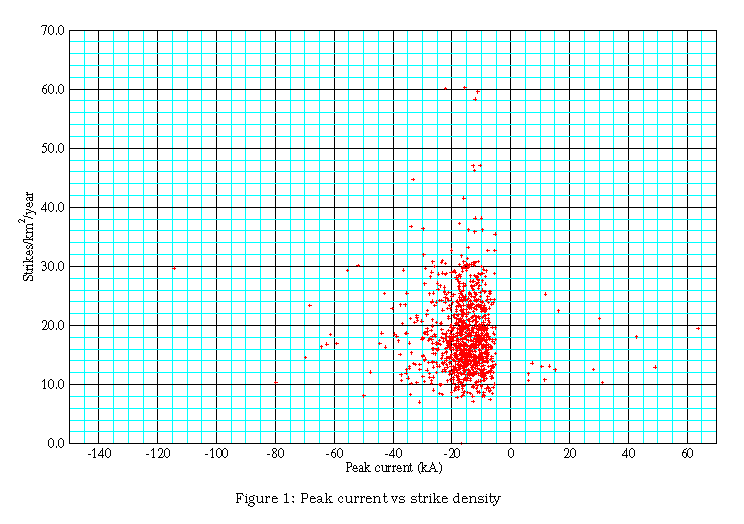
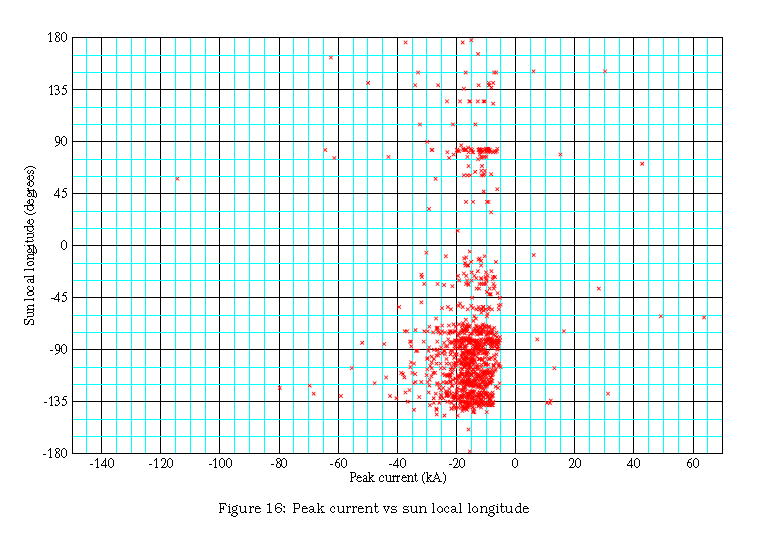
Peak-Current vs. Strike Densit Cross-Plot | Peak-Current vs. Sun Local Longitude |
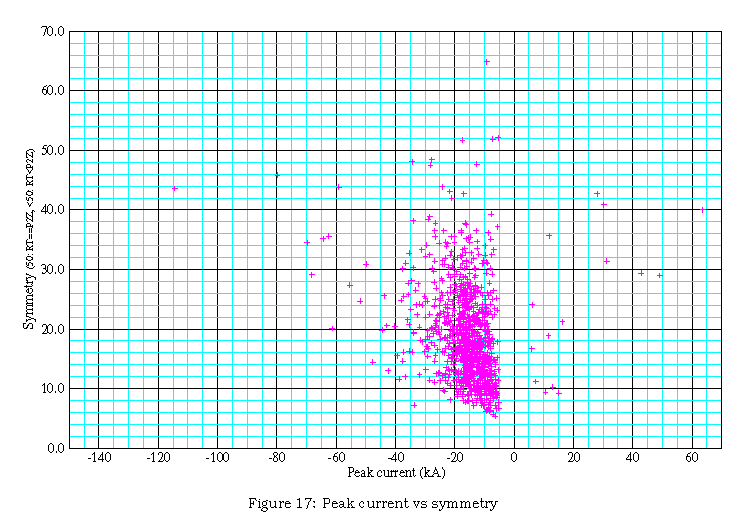
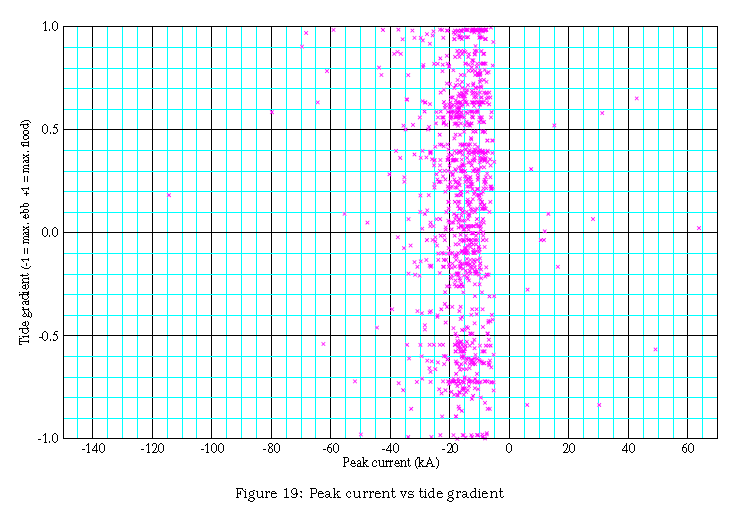
Peak-Current vs. Symmetry Cross-Plot | Peak-Current vs. Tide Gradient Cross-Plot |
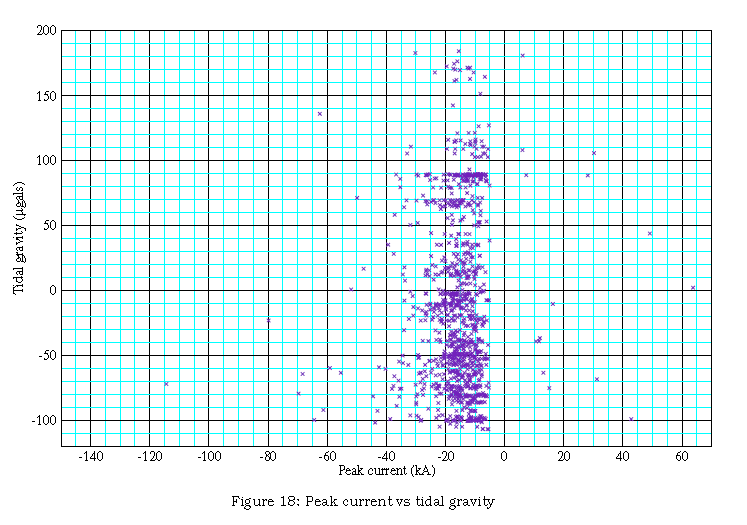
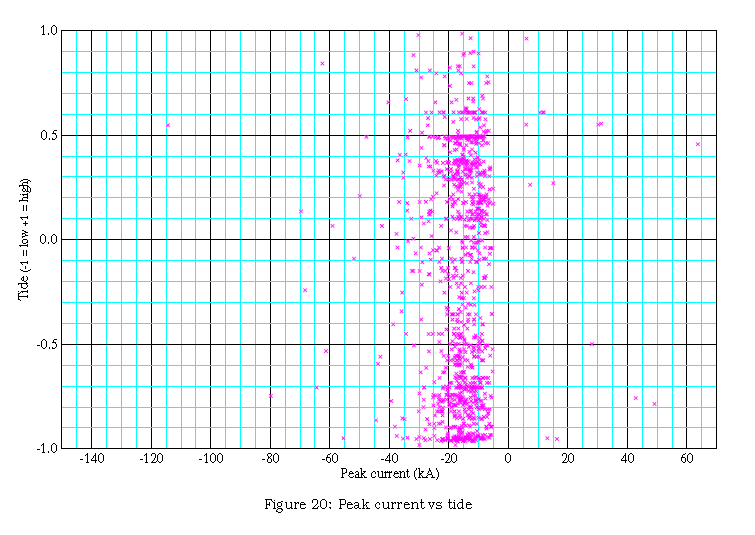
Peak-Current vs. Tidal Gravity Cross-Plot | Peak-Current vs. Tide Cross-Plot |
 |  |
 |  |
 |  |
 |  |
 |  |
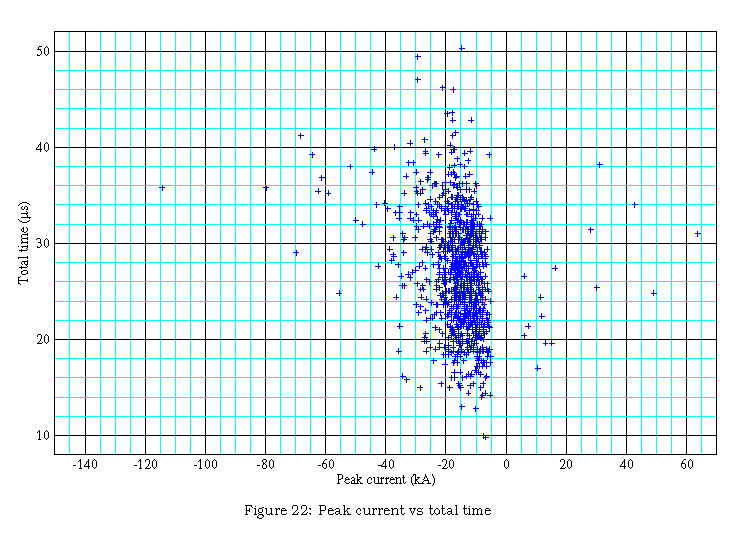
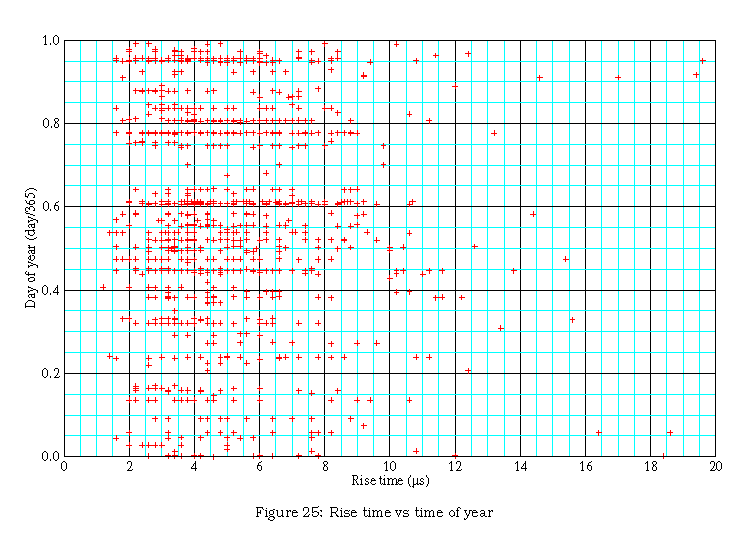
| Peak-Current vs. Total Wavelet Time | Rise-Time vs. Time-of-Year Cross-Plot |
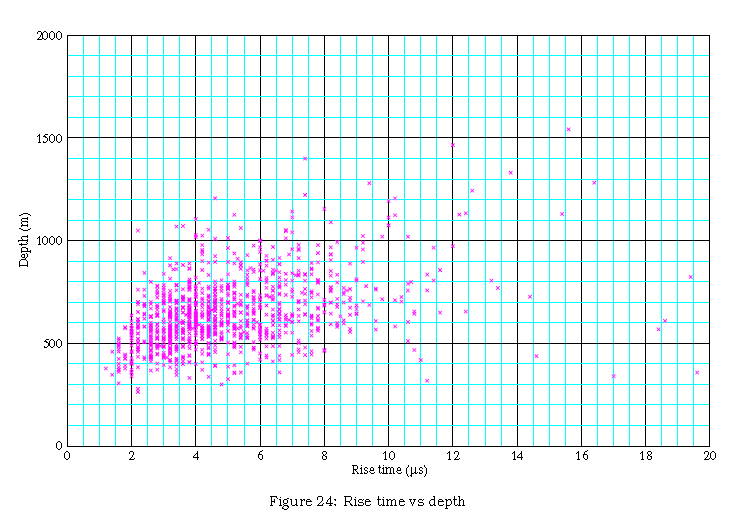
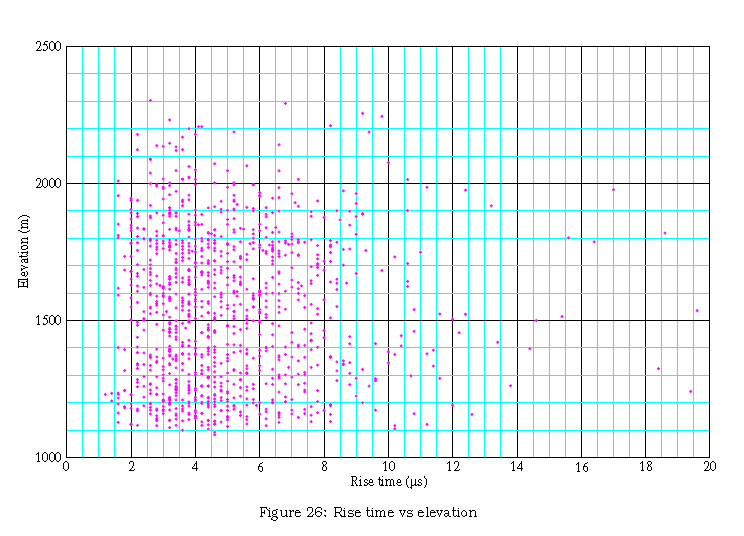
Rise-Time vs. Depth Cross-Plot | Rise-Time vs. Elevation Cross-Plot |
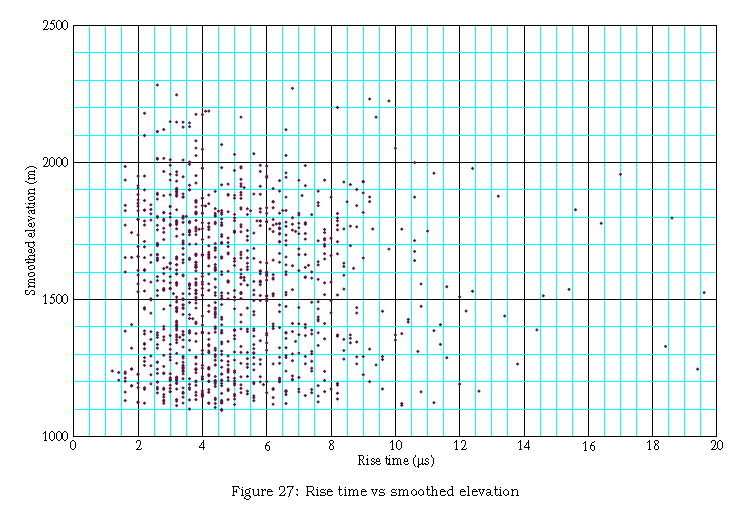
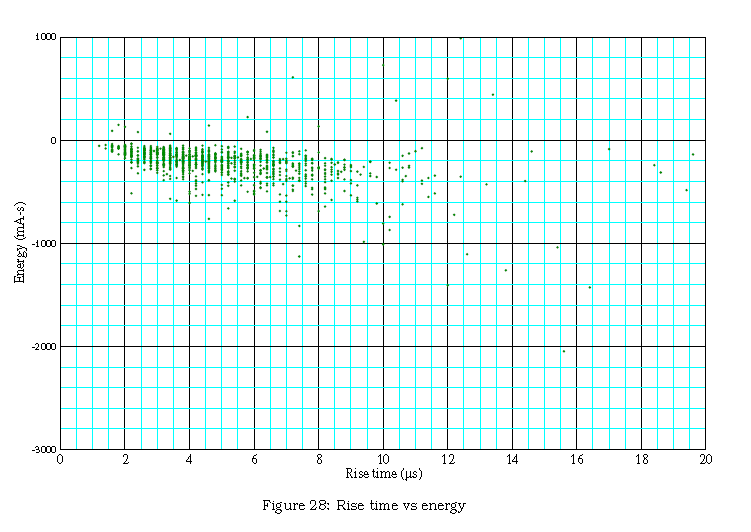
Rise-Time vs. Smoothed Elevation | Rise-Time vs. Energy Cross-Plot |
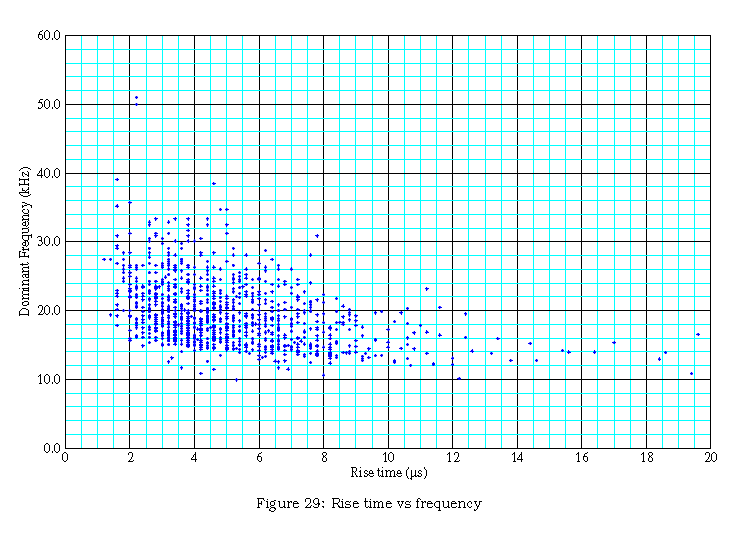
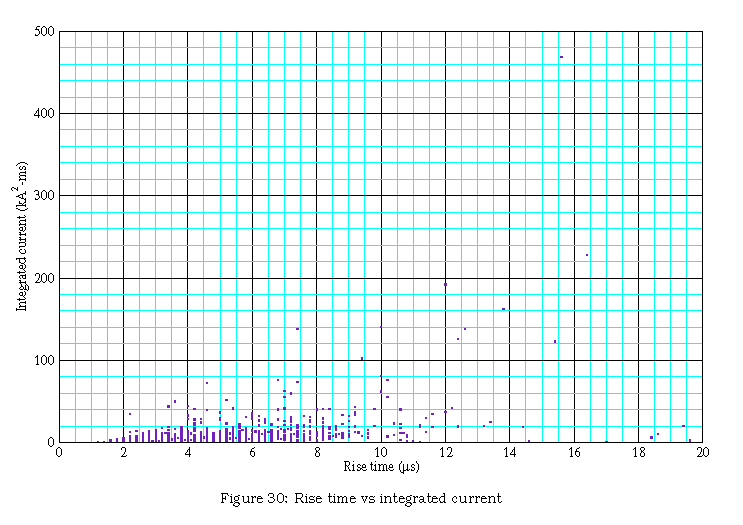
Rise-Time vs. Frequency Cross-Plot | Rise-Time vs. Integrated Current Cross-Plot |
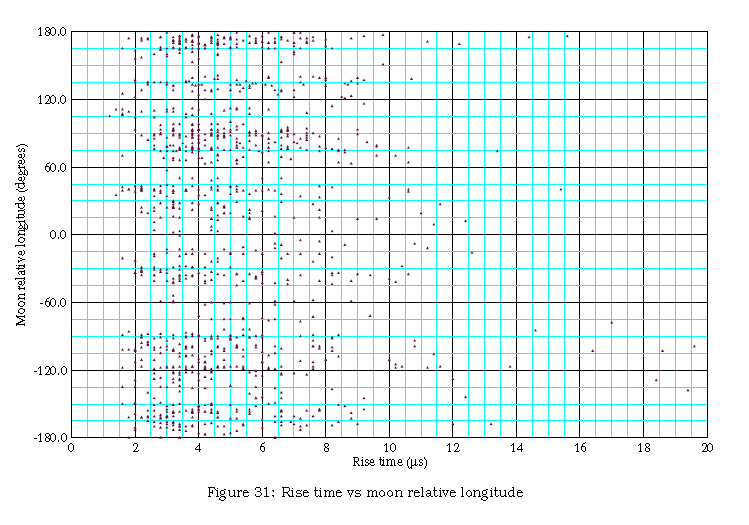
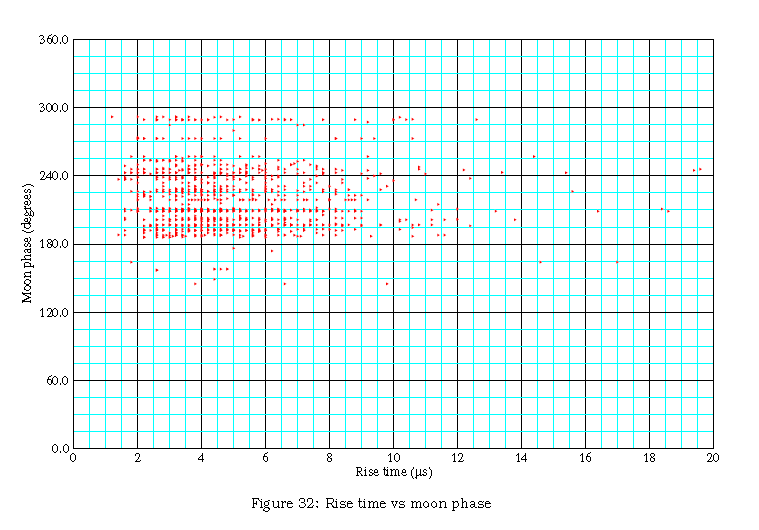
Rise-Time vs. Moon Local Longitude | Rise-Time vs. Moon Phase Cross-Plot |
 |  |
 |  |
 |  |
 |  |
 |  |
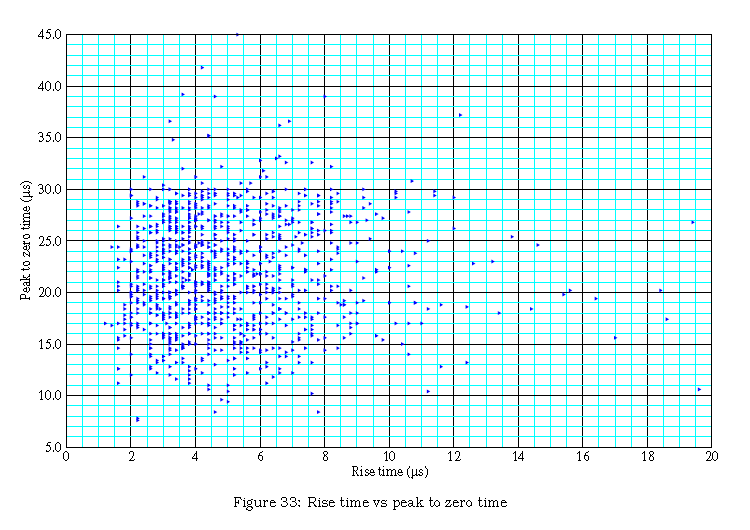
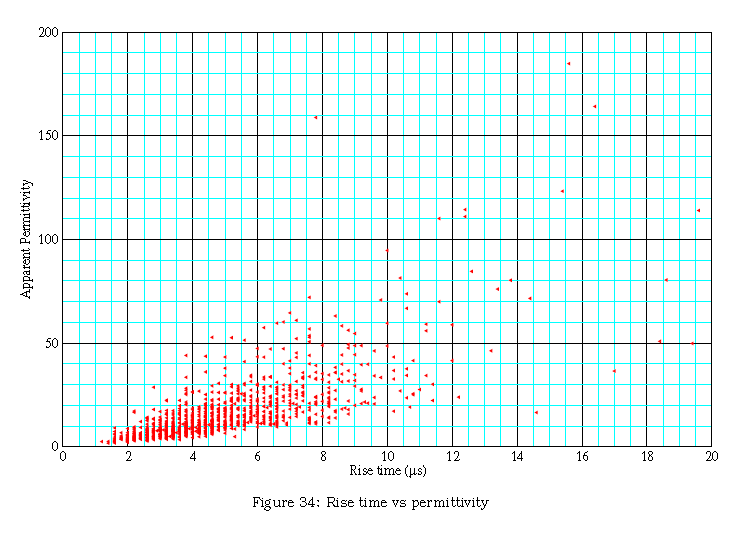
| Rise-Time vs. Peak-to-Zero Time Cross-Plot | Rise-Time vs. Permittivity Cross-Plot |
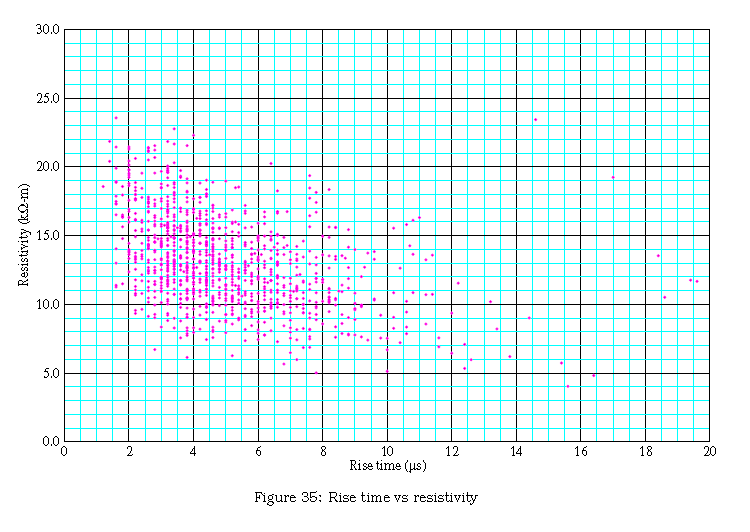
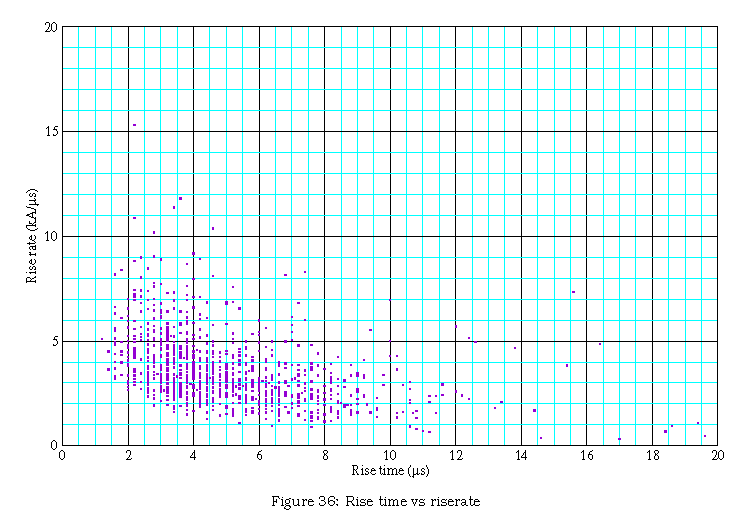
Rise-Time vs. Resistivity Cross-Plot | Rise-Time vs. Rate-of-Rise-Time Cross-Plot |
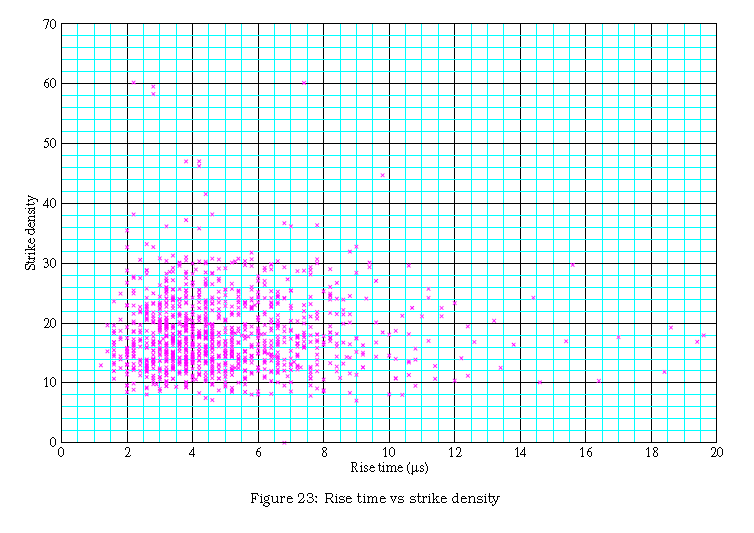
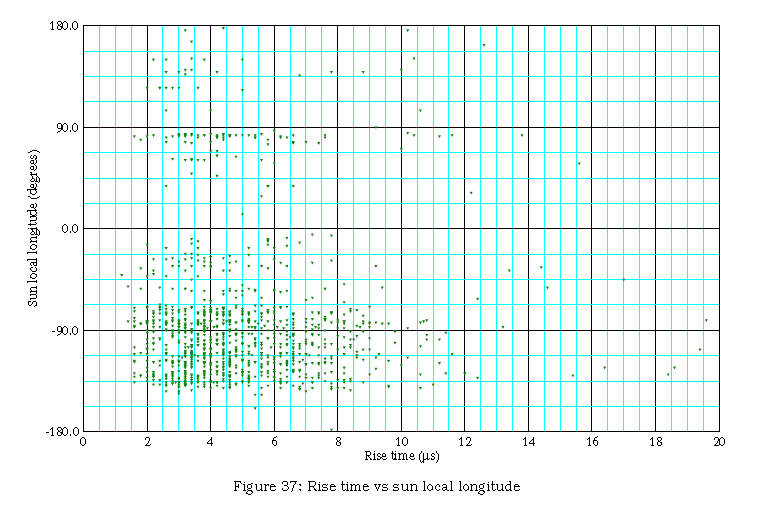
Rise-Time vs. Strike Density Cross-Plot | Rise-Time vs. Sun Local Longitude Cross-Plot |
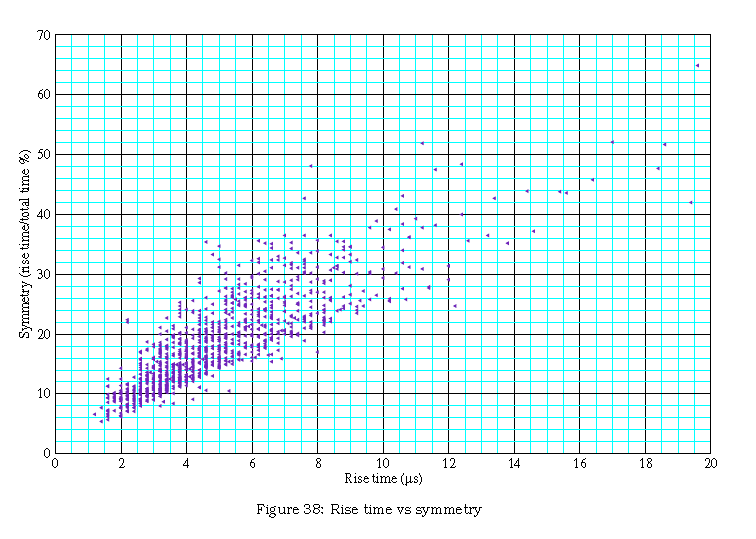
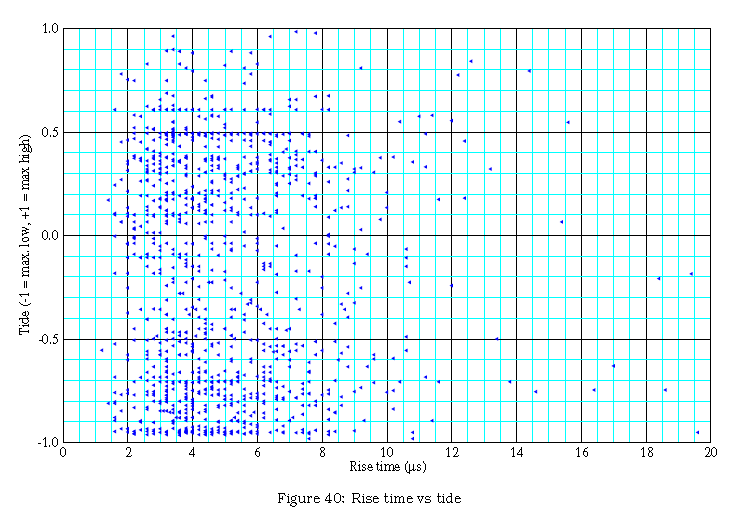
Rise-Time vs. Symmetry Cross-Plot | Rise-Time vs. Tide Cross-Plot |
Rise-Time vs. Tide Gradient Cross-Plot | Rise-Time vs. Total Wavelet Time |
 |  |
 |  |
 |  |
 |  |
 |  |
| Depth Map | Energy Map |
Frequency Map | Integrated Current Map |
Moon Local Longitude Map | Moon Phase Map |
Peak Current Map | Peak-to-Zero Map |
Rate-of Rise Time Map | Rise-Time Map |
 |  |
 |  |
 |  |
 |  |
 |  |
| Sun Local Longitude Map | Wavelet Symmetry Map |
Tidal Gravity Map | Tide Map |
Tide Gradient Map | Total Wavelet Time Map |
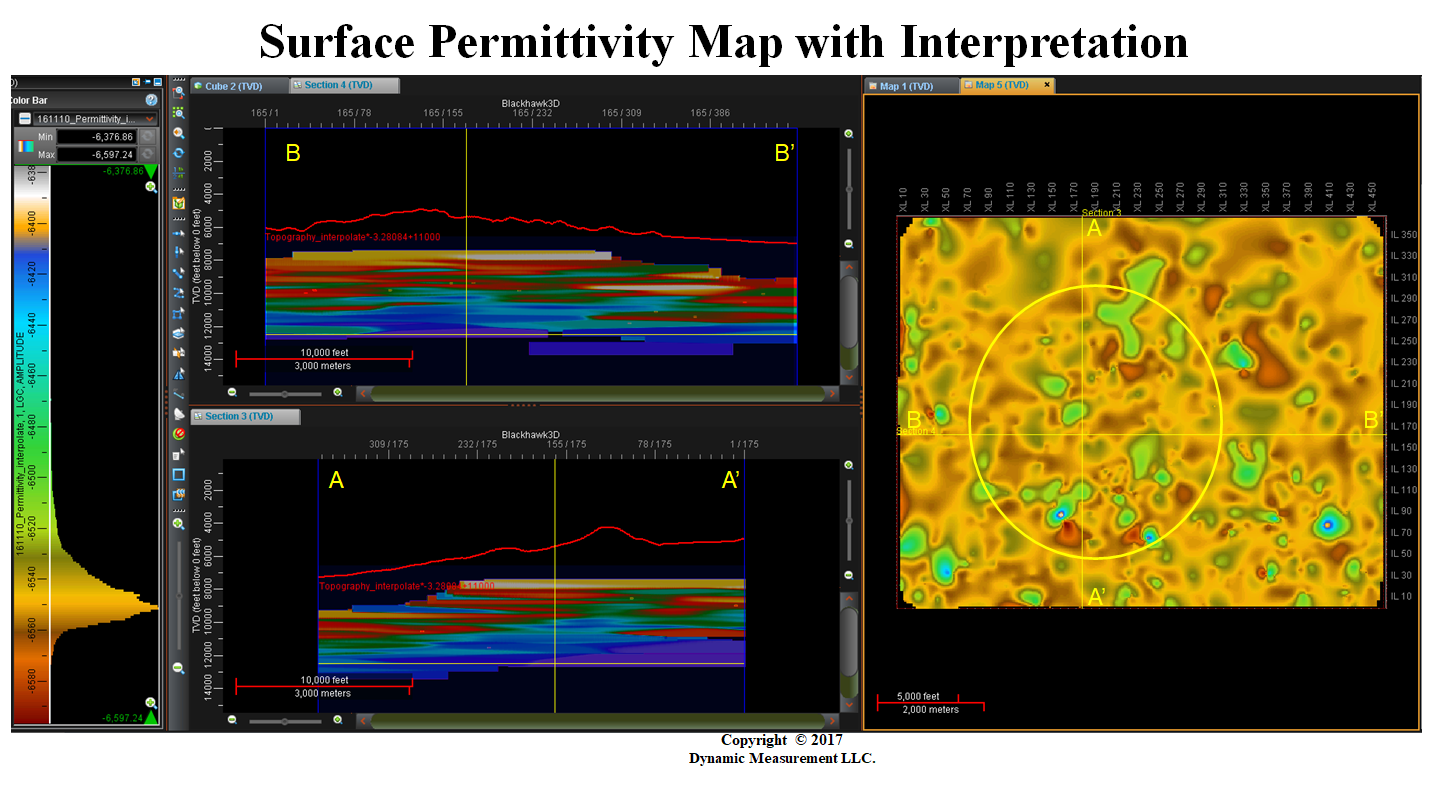
Apparent Permittivity Map | Apparent Permittivity Halo |
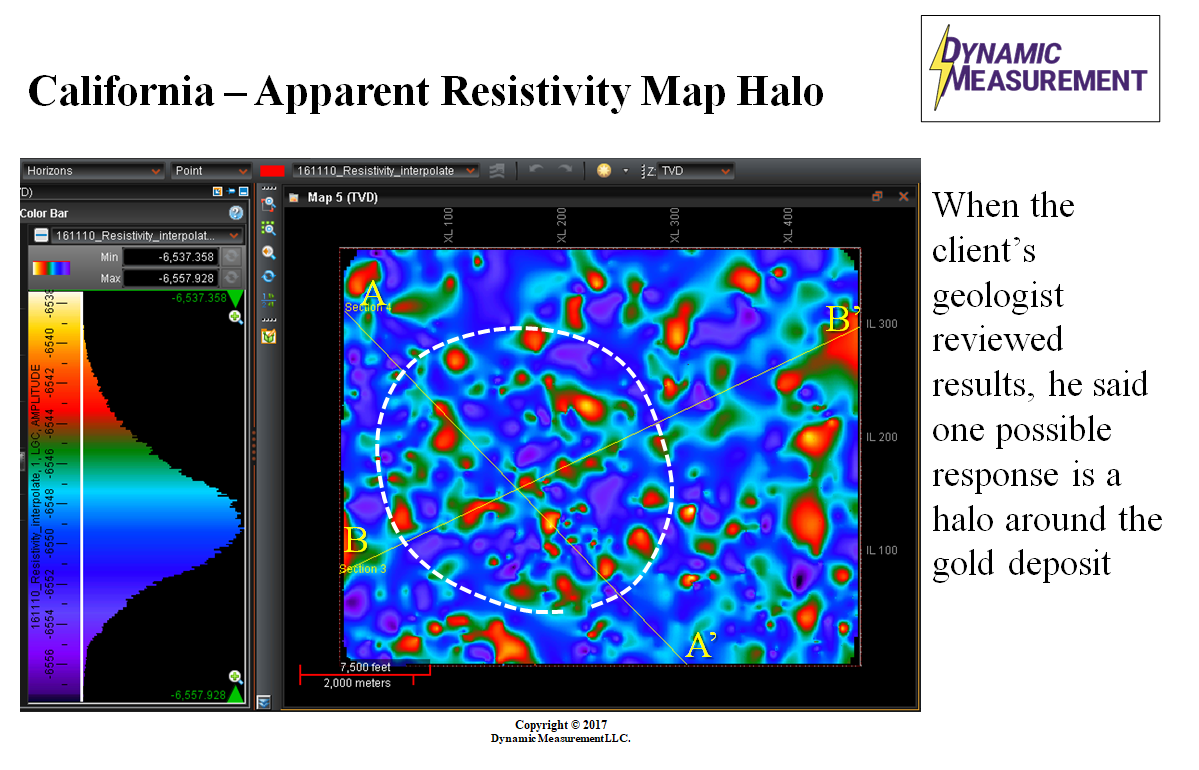
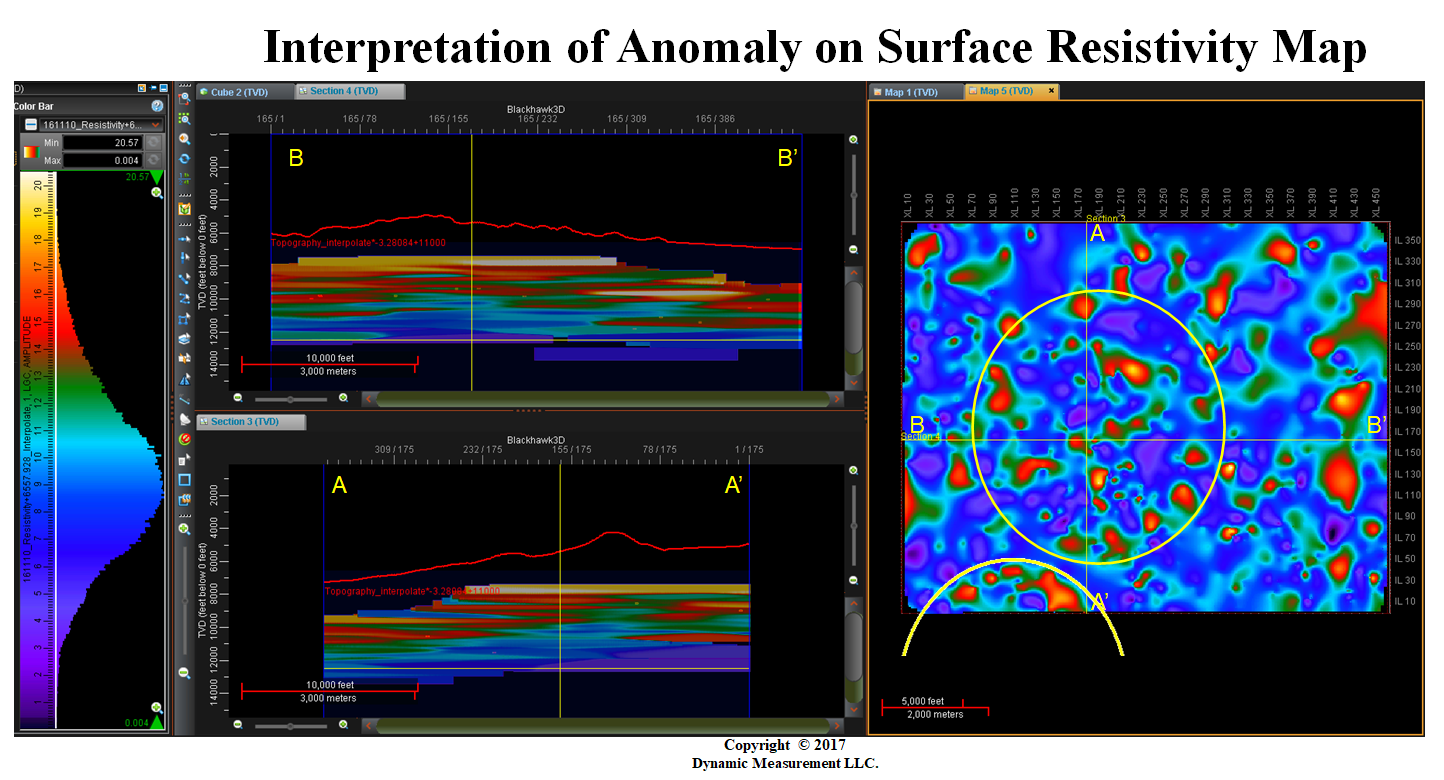
Apparent Resistivity Map | Apparent Resistivity Halo |
 |  |
 |  |
 |  |
 |  |
 |  |
| In- & Cross-Line Resistivity Halo | In- & Cross-Line Topography Halo |
In- & Cross-Line Permittivity Halo | In-Line & Cross-Line Energy Halo |
In- & Cross-Line Frequency Halo | Rate-of-Rise-Time Halo |
In- & Cross-Line Symmetry Halo | Total Wavelet Time Halo |
Horizonal-Slice 7,500 Halo | Horizonal-Slice 8,000 Halo |
 |  |
 |  |
 |  |
 |  |
 |  |
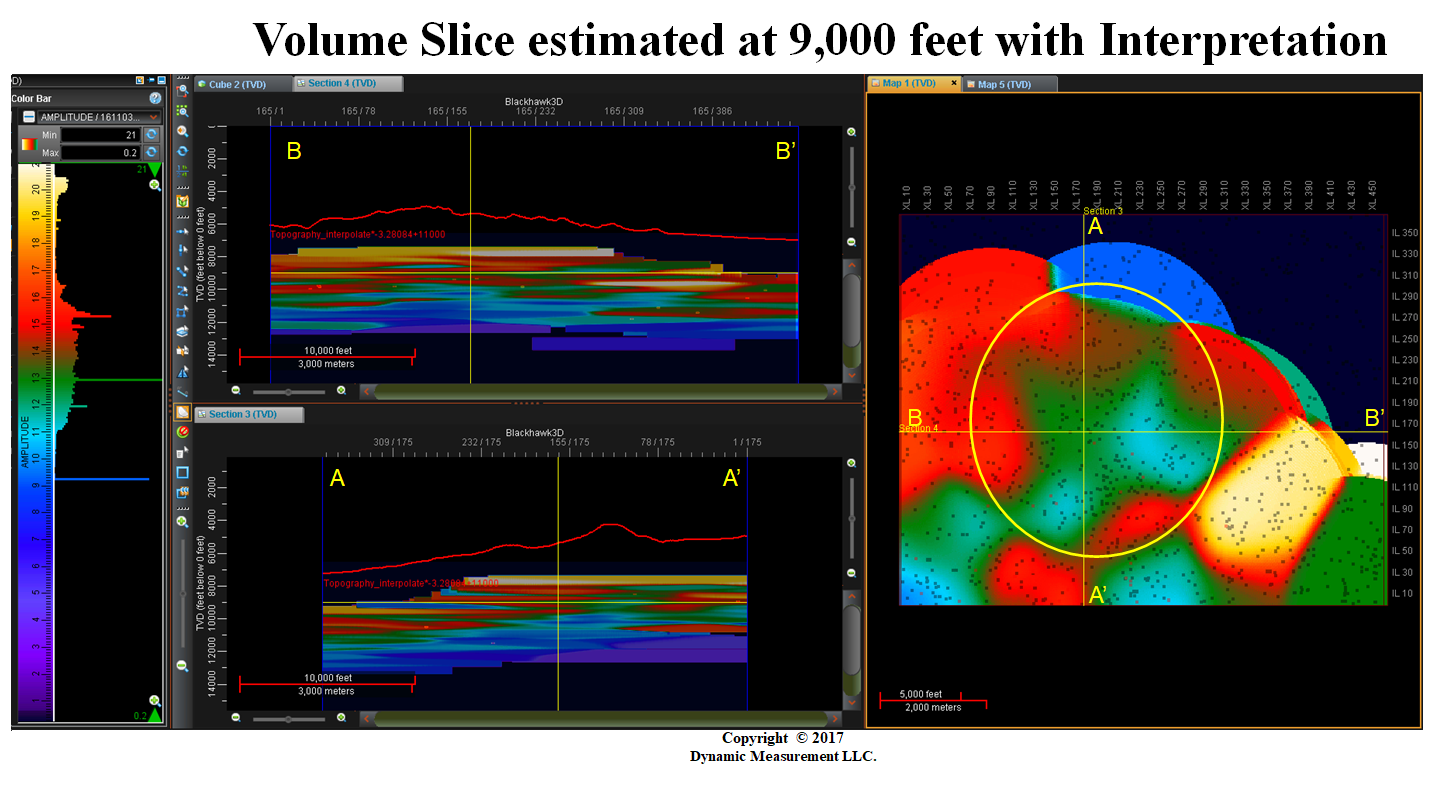
| Horizonal-Slice 8,500 Halo | Horizonal-Slice 9,000 Halo |
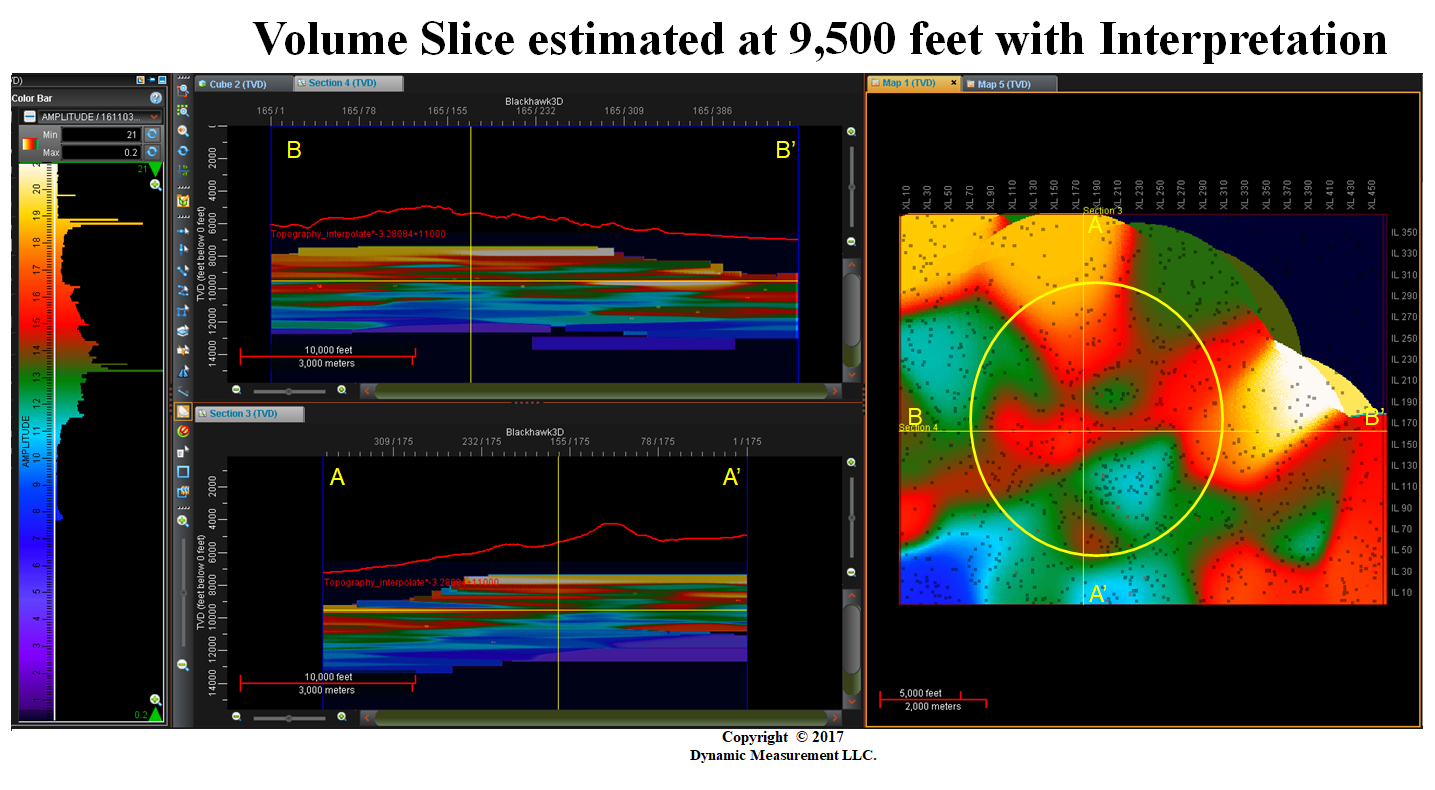
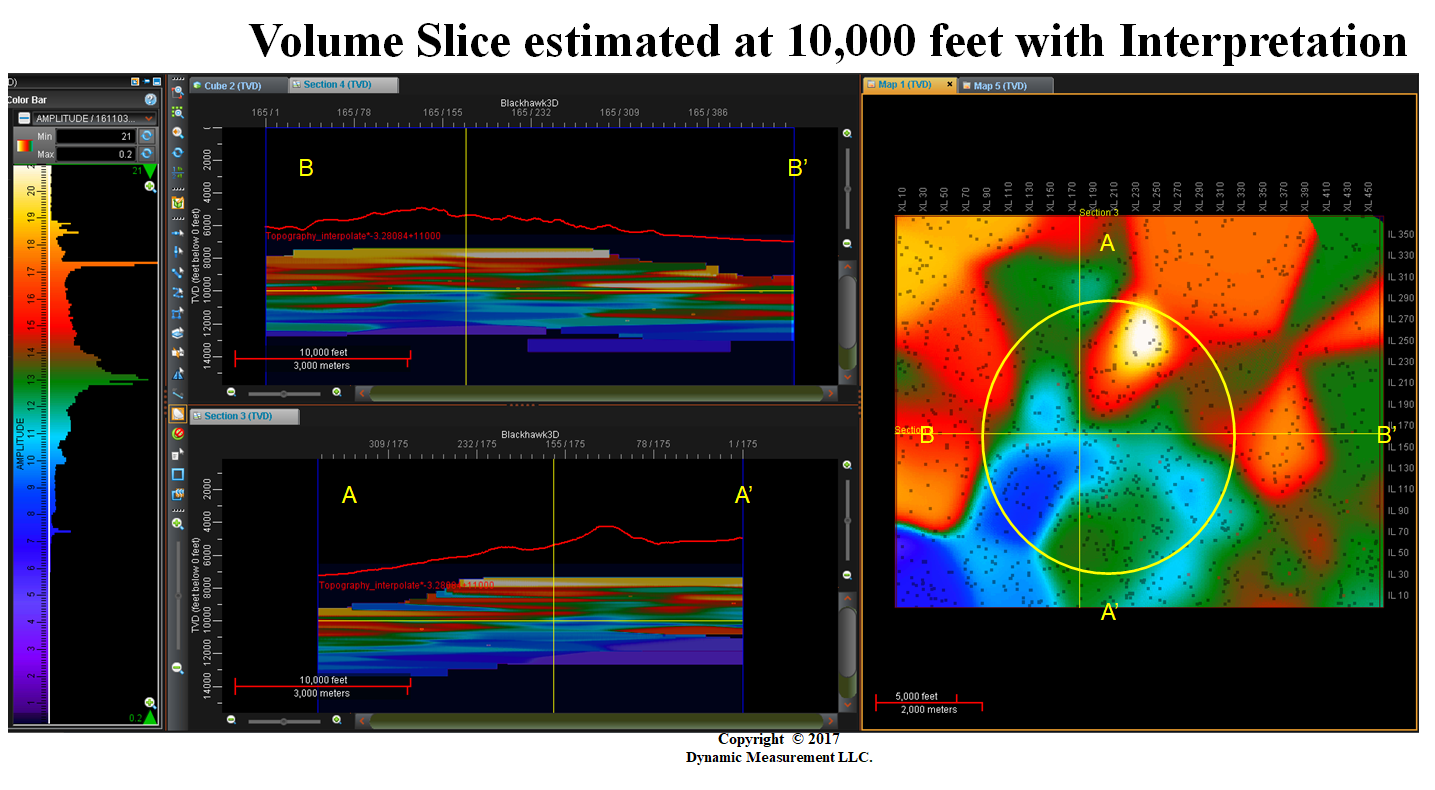
Horizonal-Slice 9,500 Halo | Horizonal-Slice 10,000 Halo |
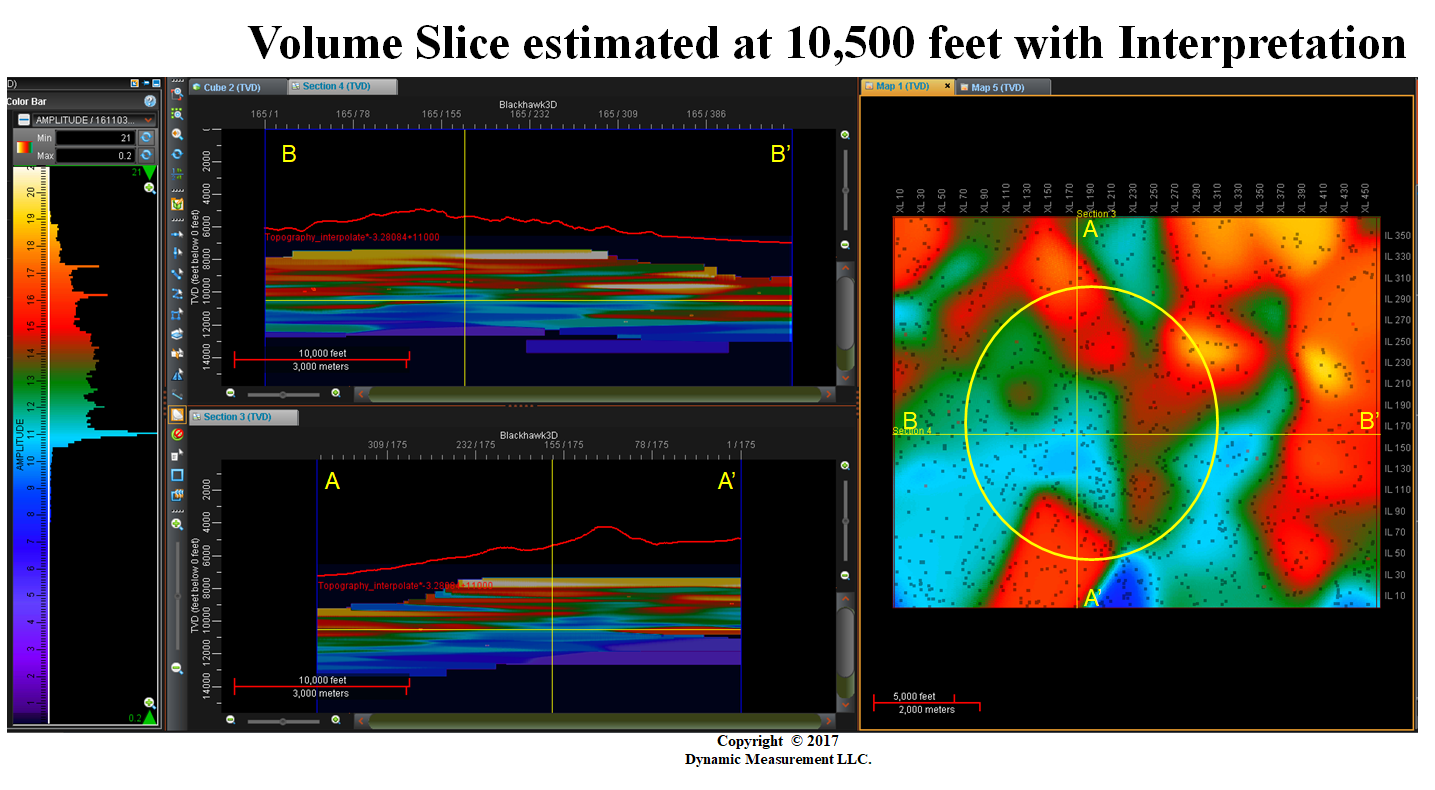
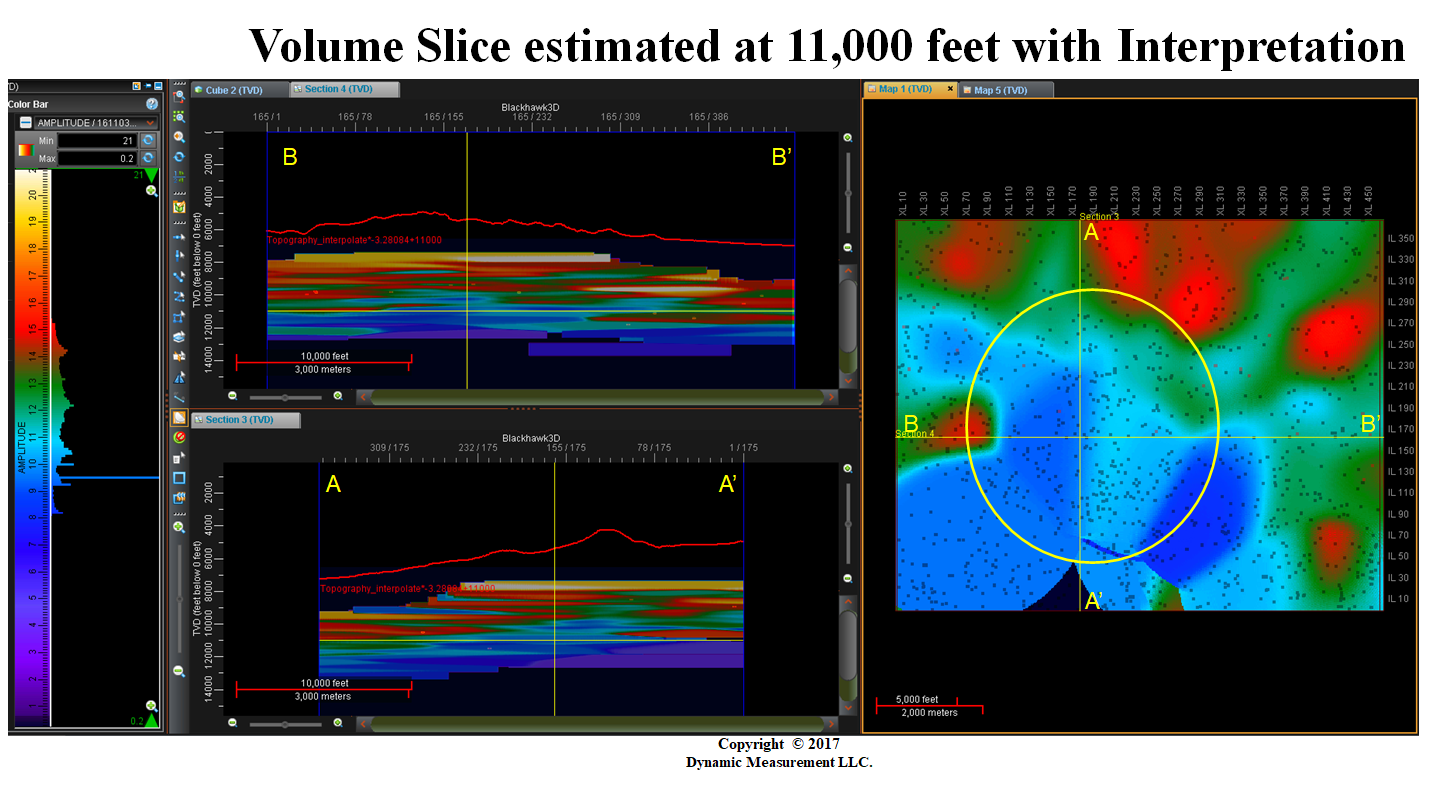
Horizonal-Slice 10,500 Halo | Horizonal-Slice 11,000 Halo |
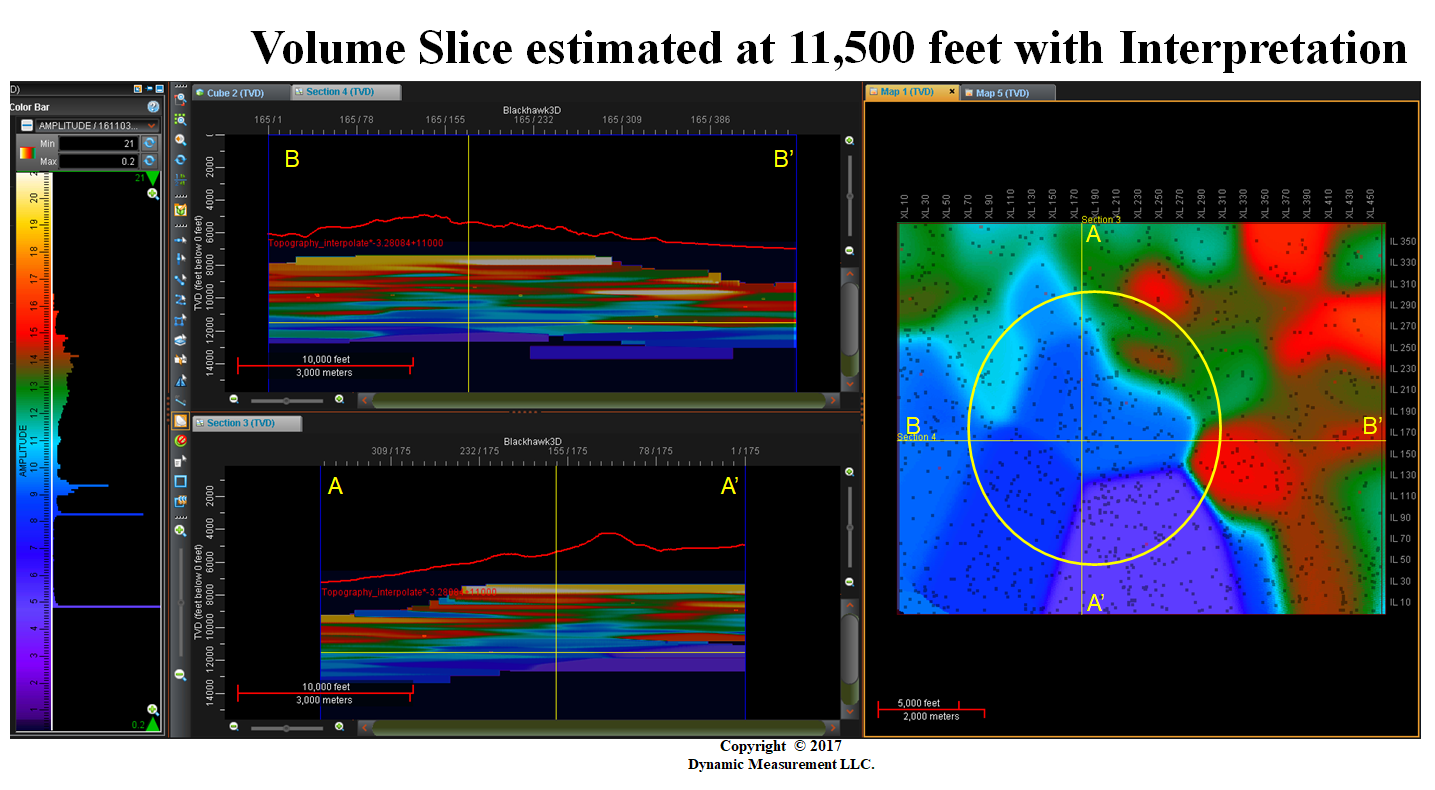
Horizonal-Slice 11,500 Halo | In-Line & Cross-Line Apparent Resistivity |
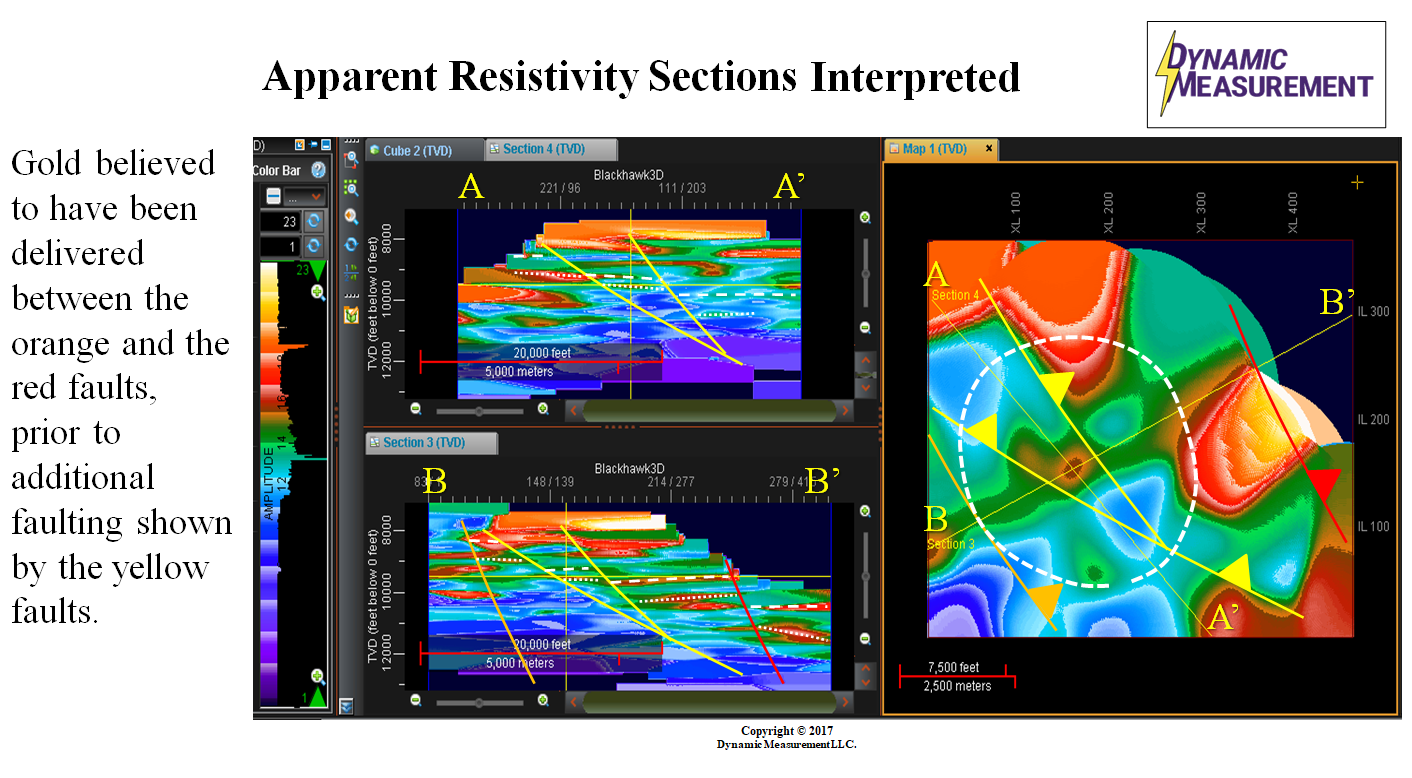
Resistivity Fault & Halo Interpretation | Apparent Resistivity Animation |