 |  |
 |  |
 |  |
 |  |
 |  |
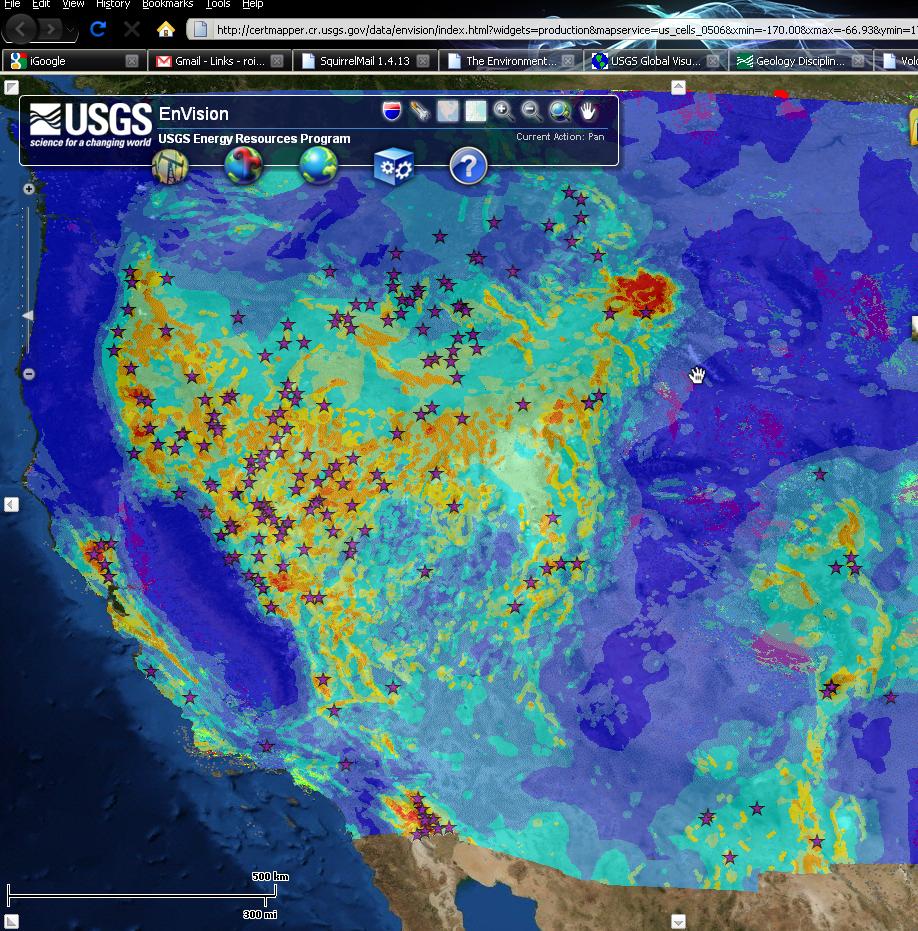
| USGS Map Geothermal Sites | Dynamic's Services |
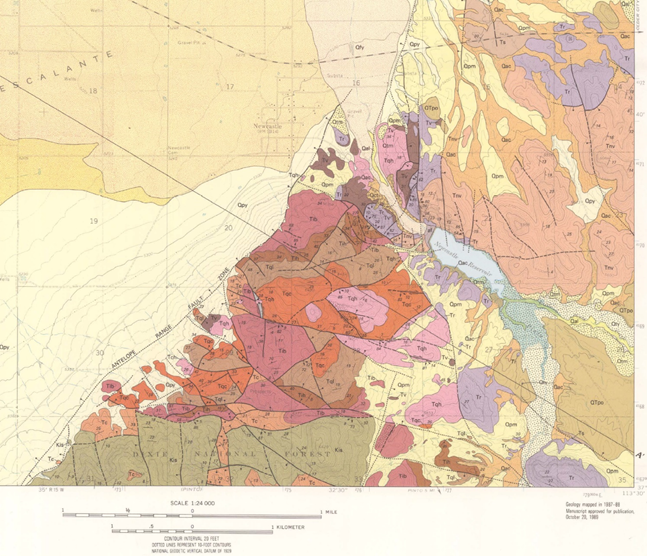
South Utah Potential | USGS Quad Map of Area |
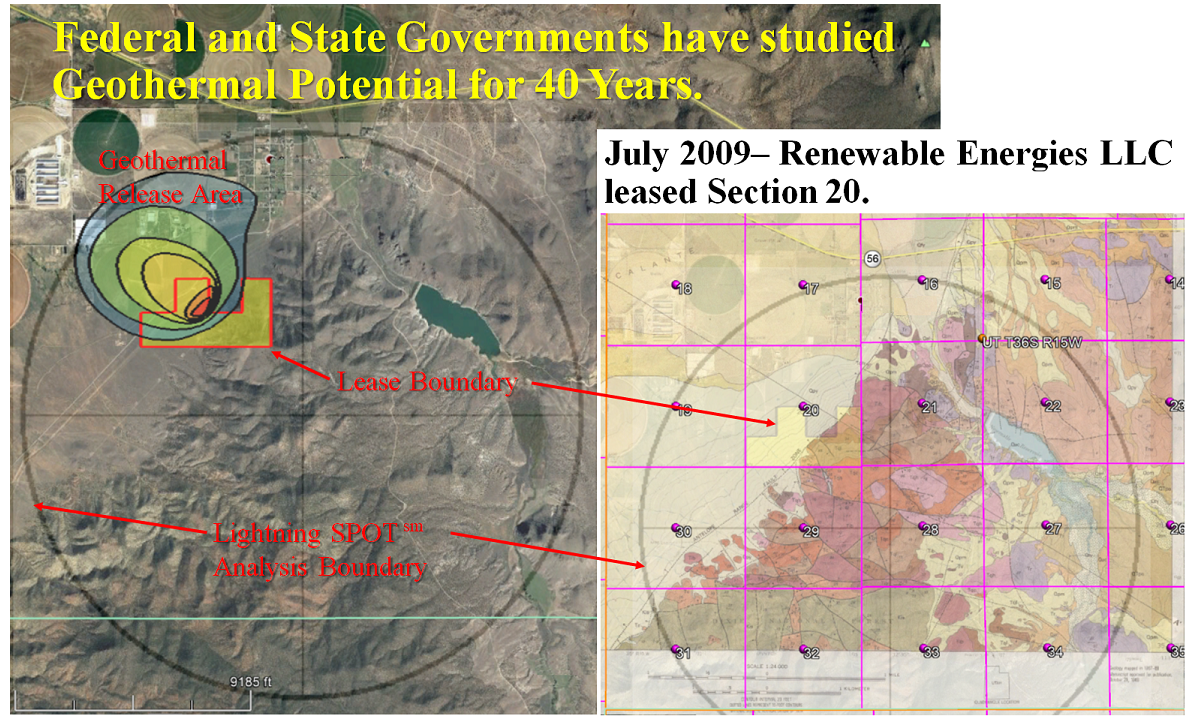
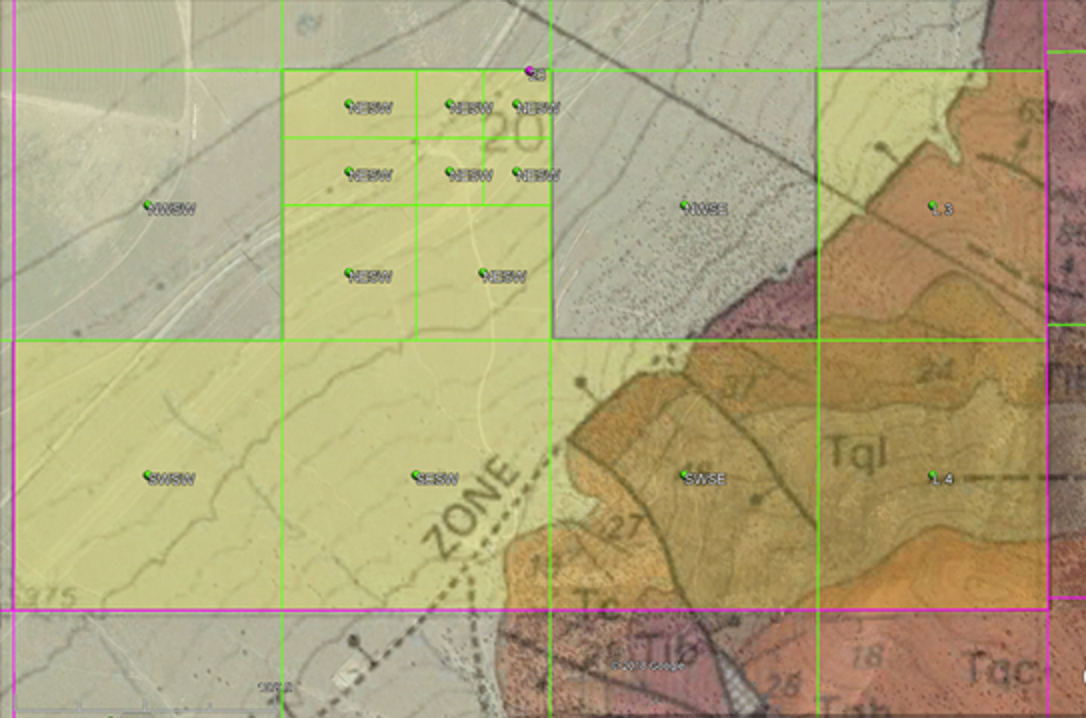
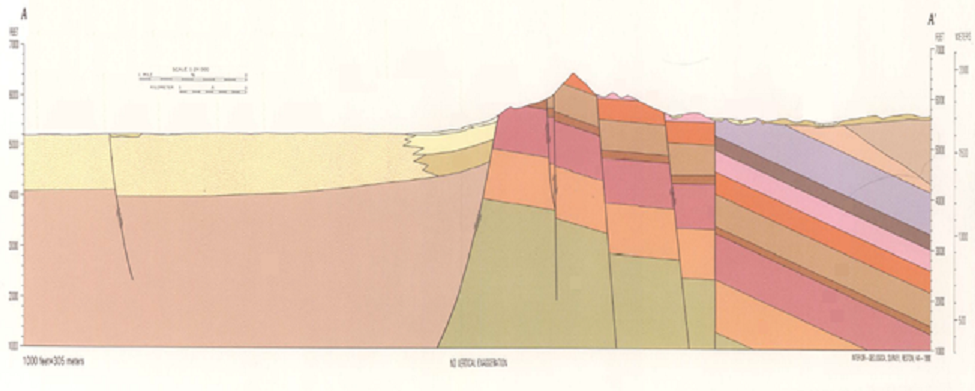
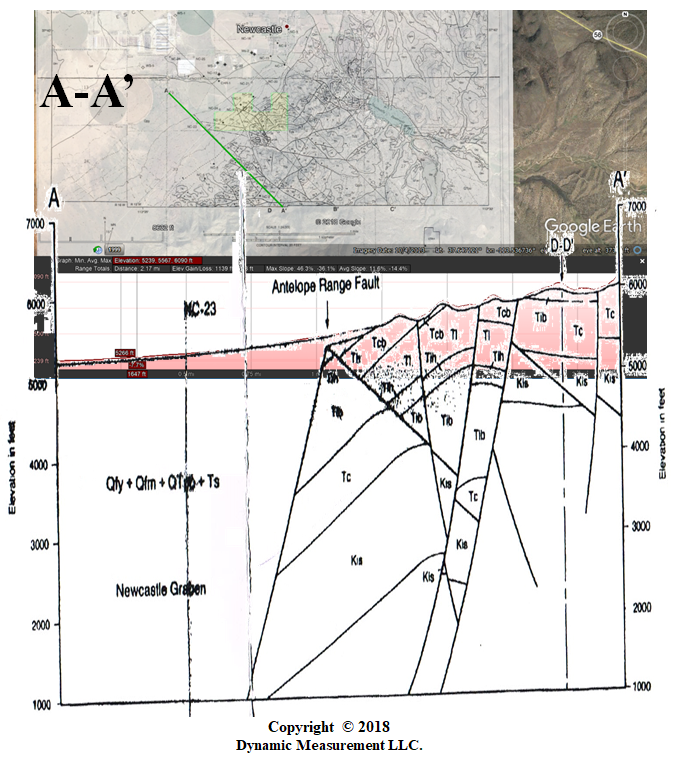
Client's Lease USGS Geology | USGS Cross-Section AA-AA' |
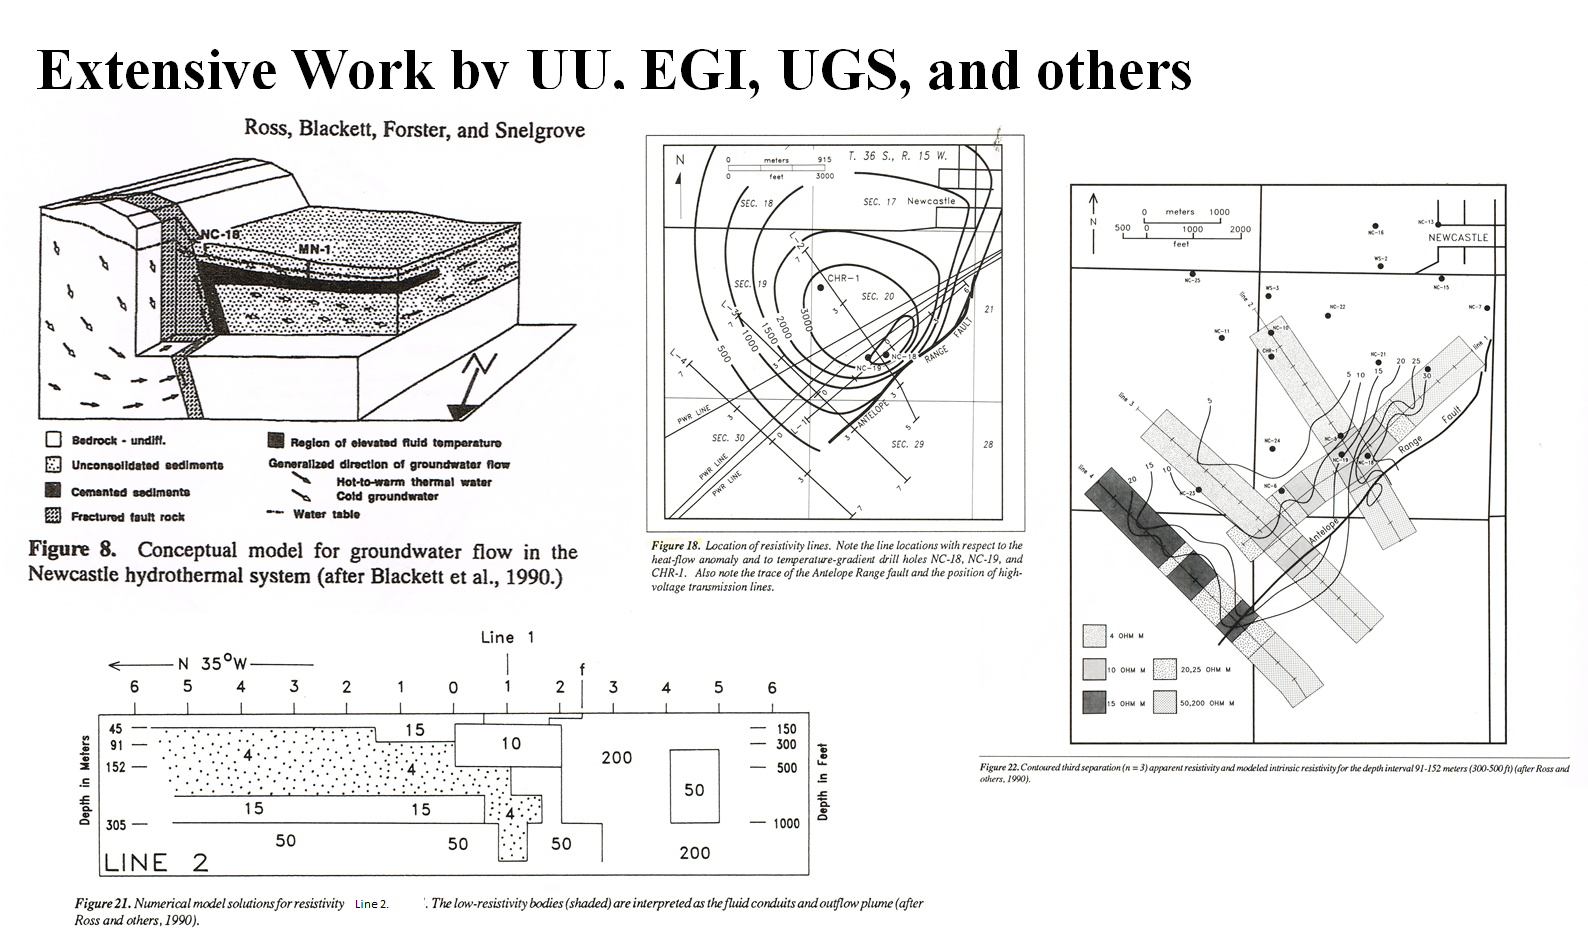
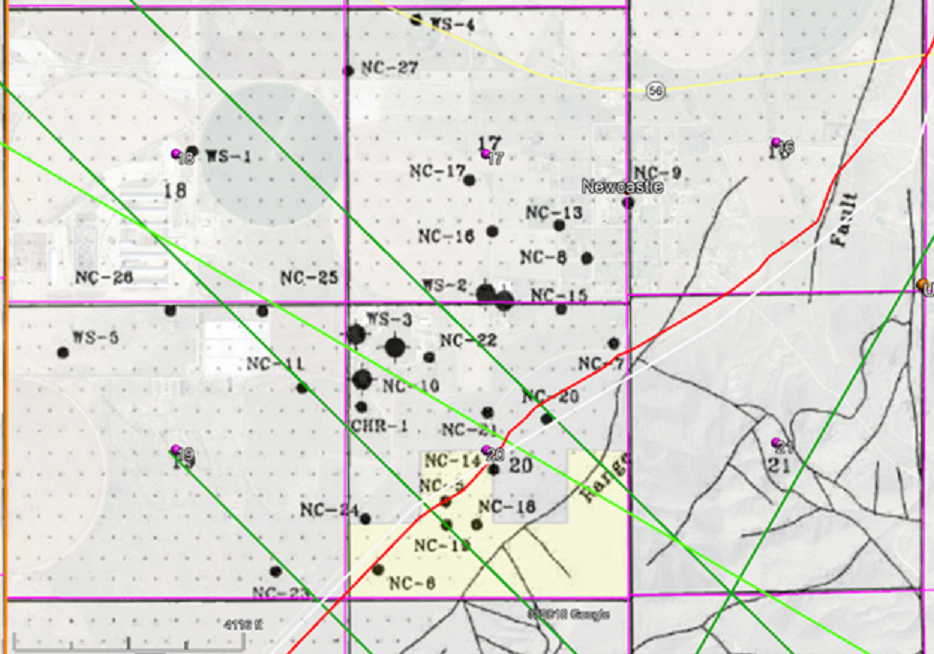
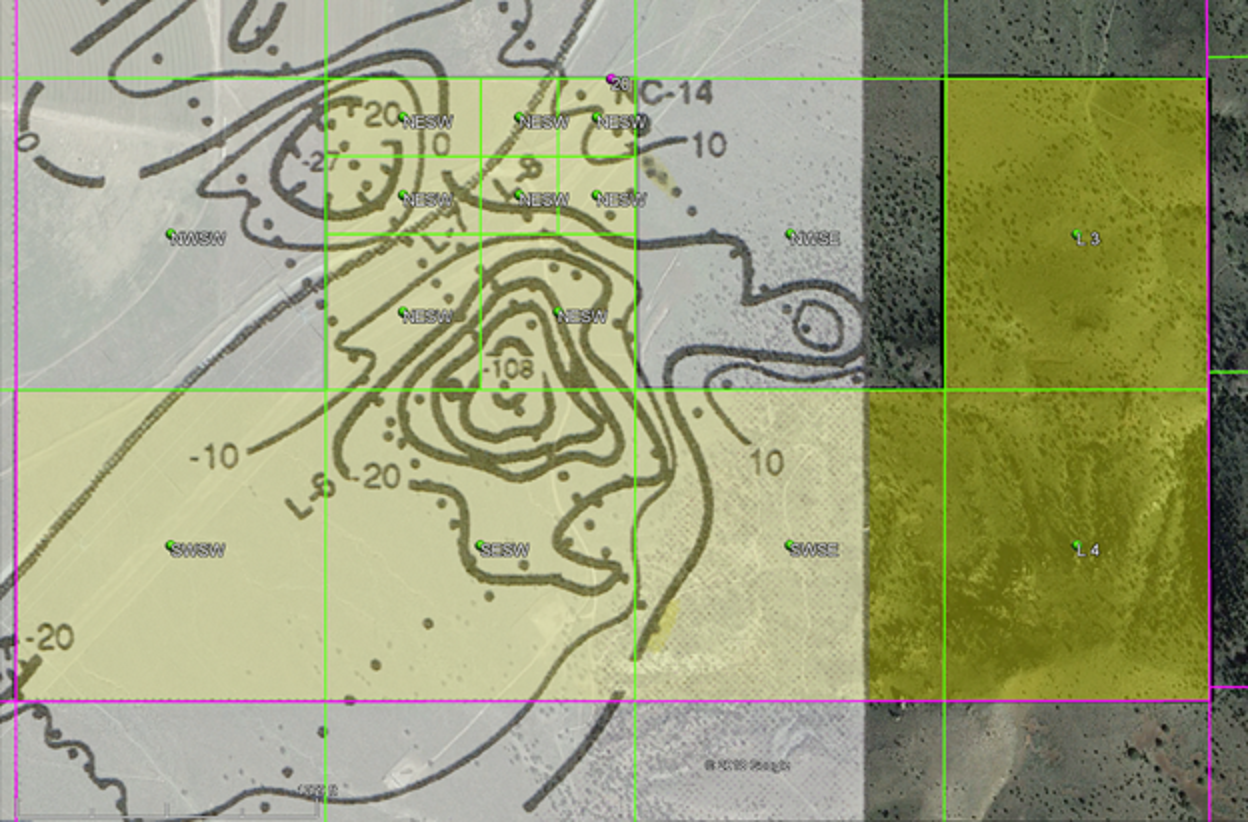
UofU, EGI, UGS & others Work | Wells in the Area |
IP Survey over Claim Area | UGS Cross-Section A-A' |
 |  |
 |  |
 |  |
 |  |
 |  |
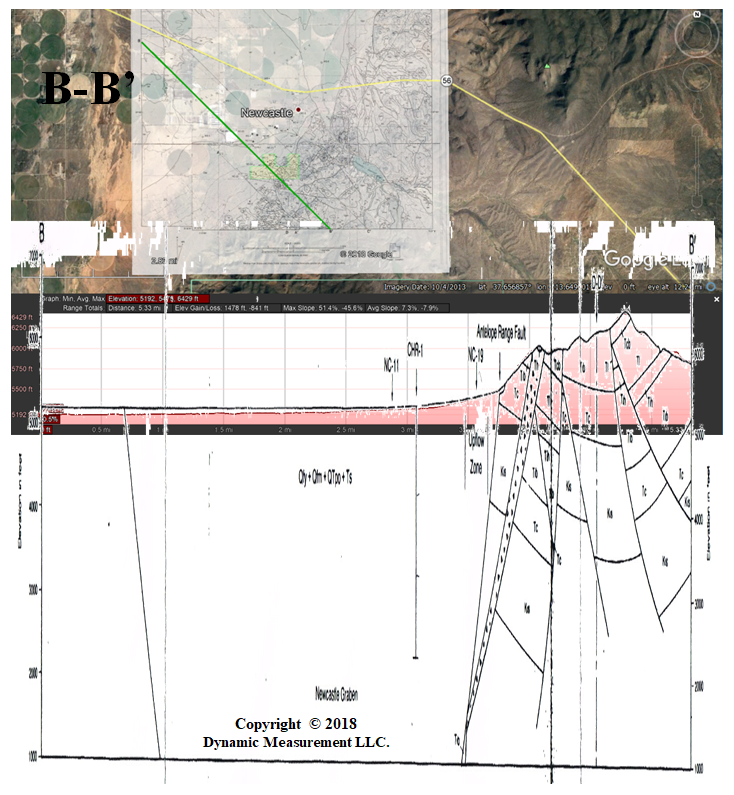
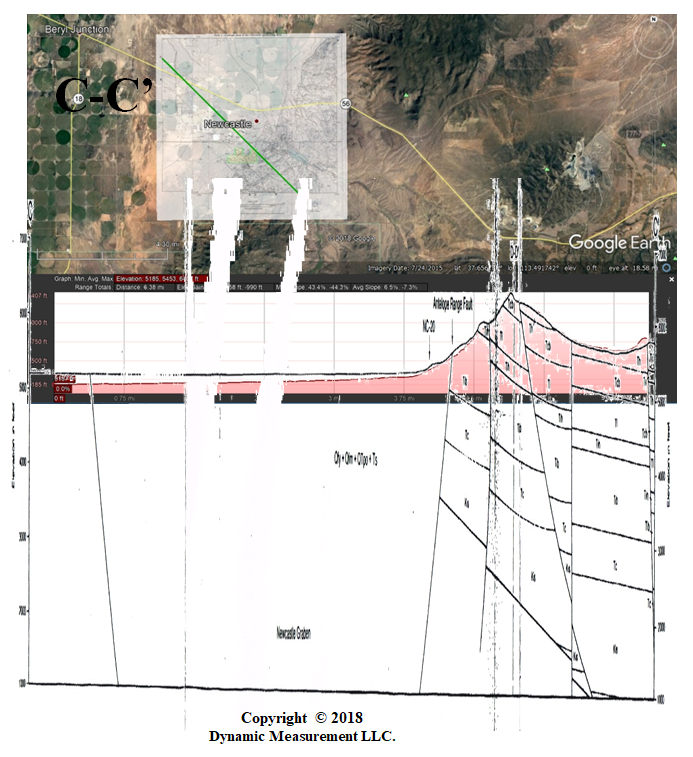
| UGS Cross-Section B-B' | UGS Cross-Section C-C' |
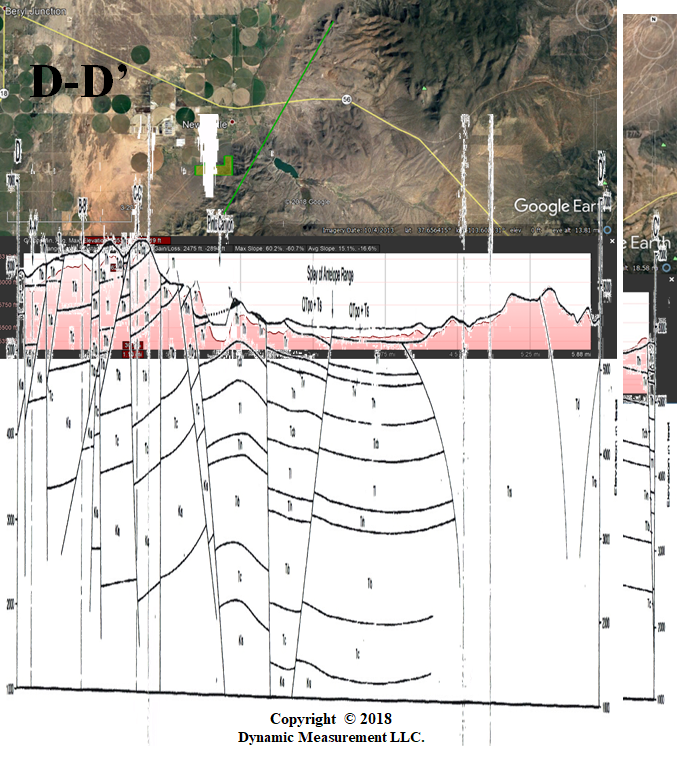
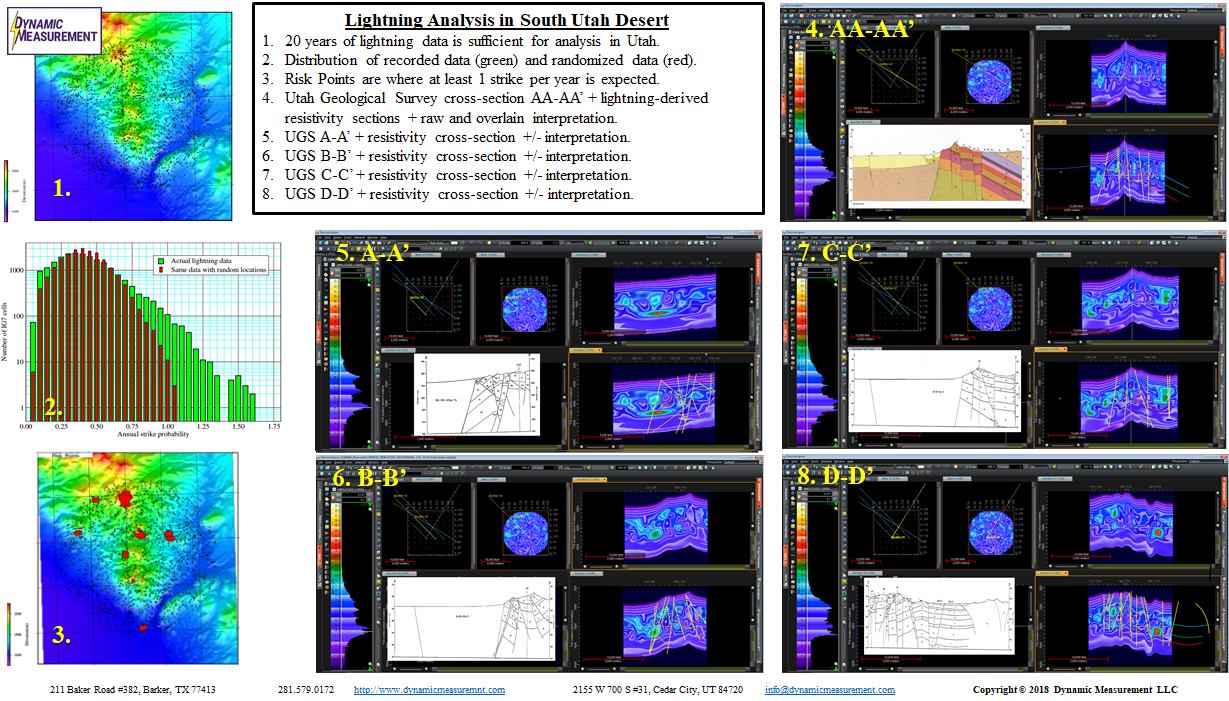
UGS Cross-Section D-D' | Summary Slide of Work in Area |
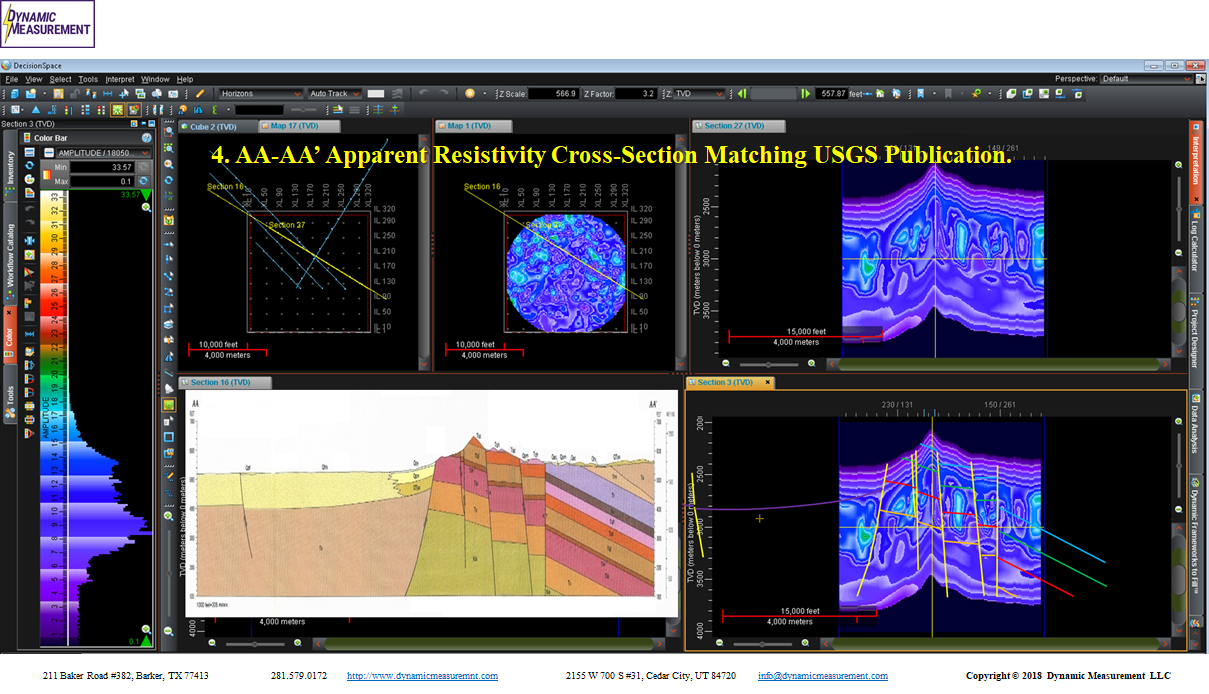
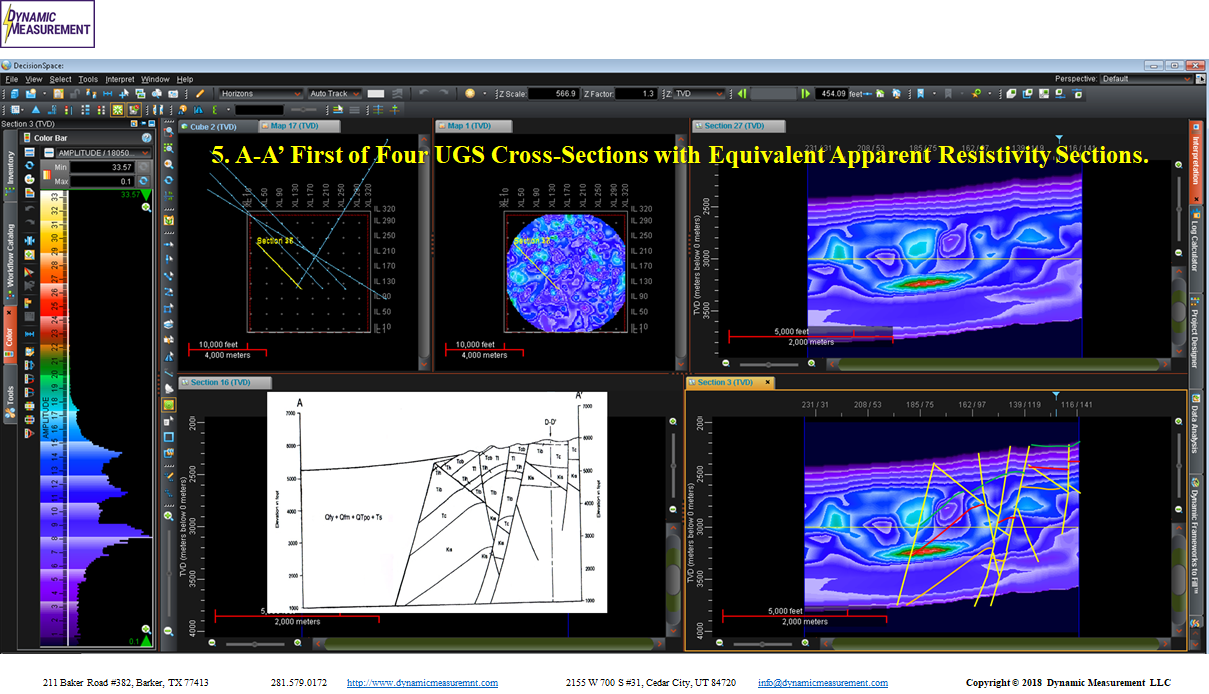
USGS AA-AA' with Resistivity | UGS A-A' with Resistivity |
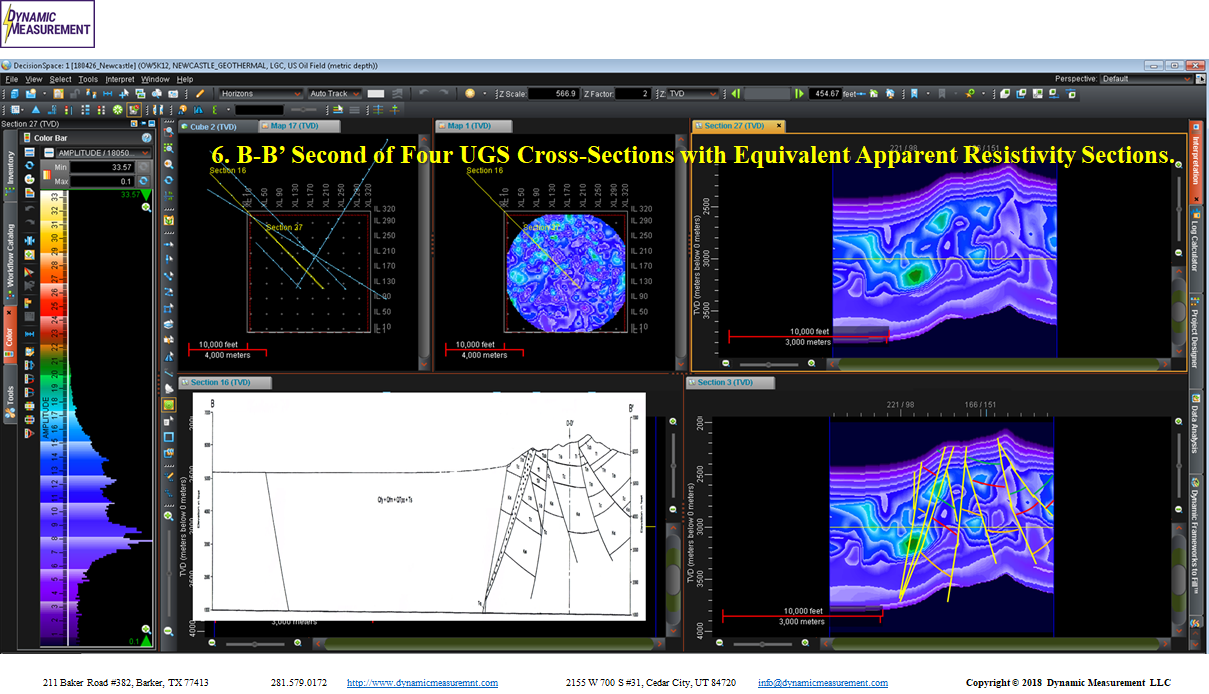
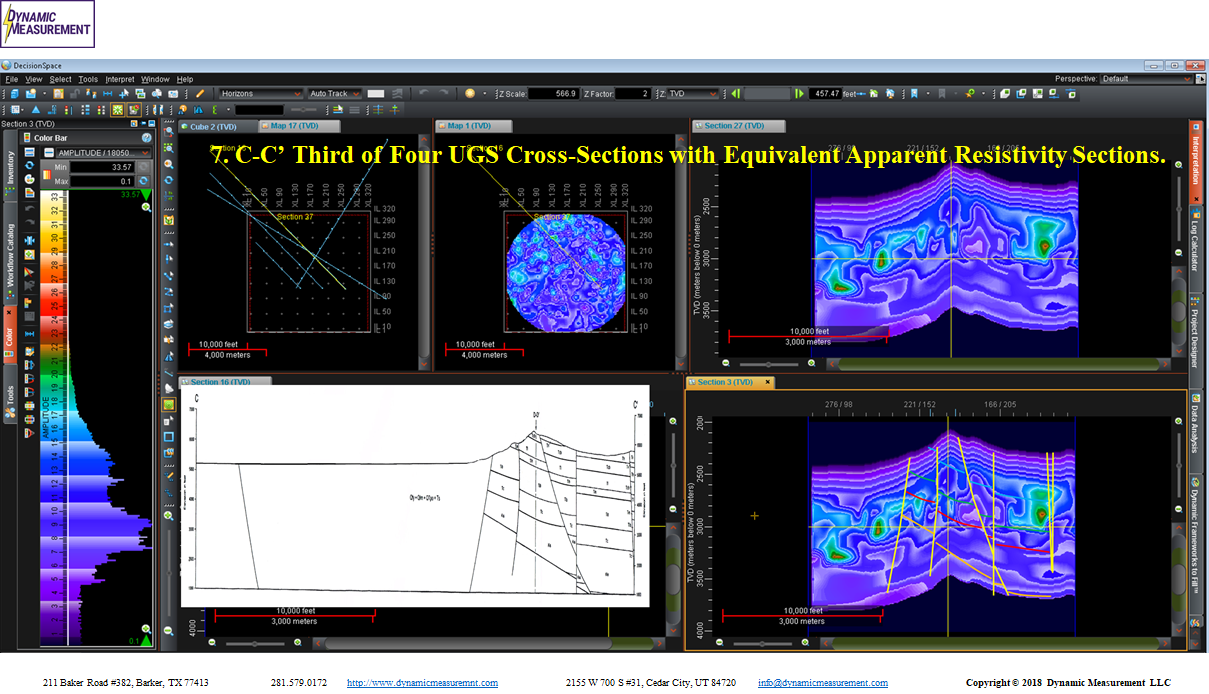
UGS B-B' with Resistivity | UGS C-C' with Resistivity |
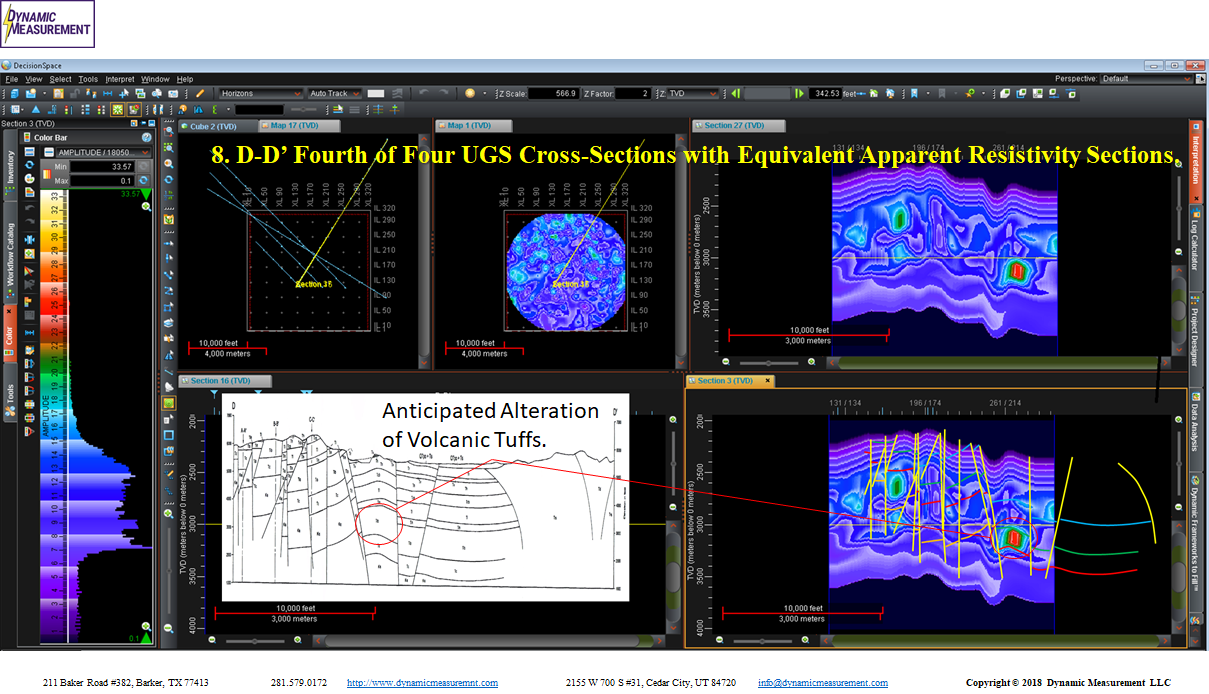
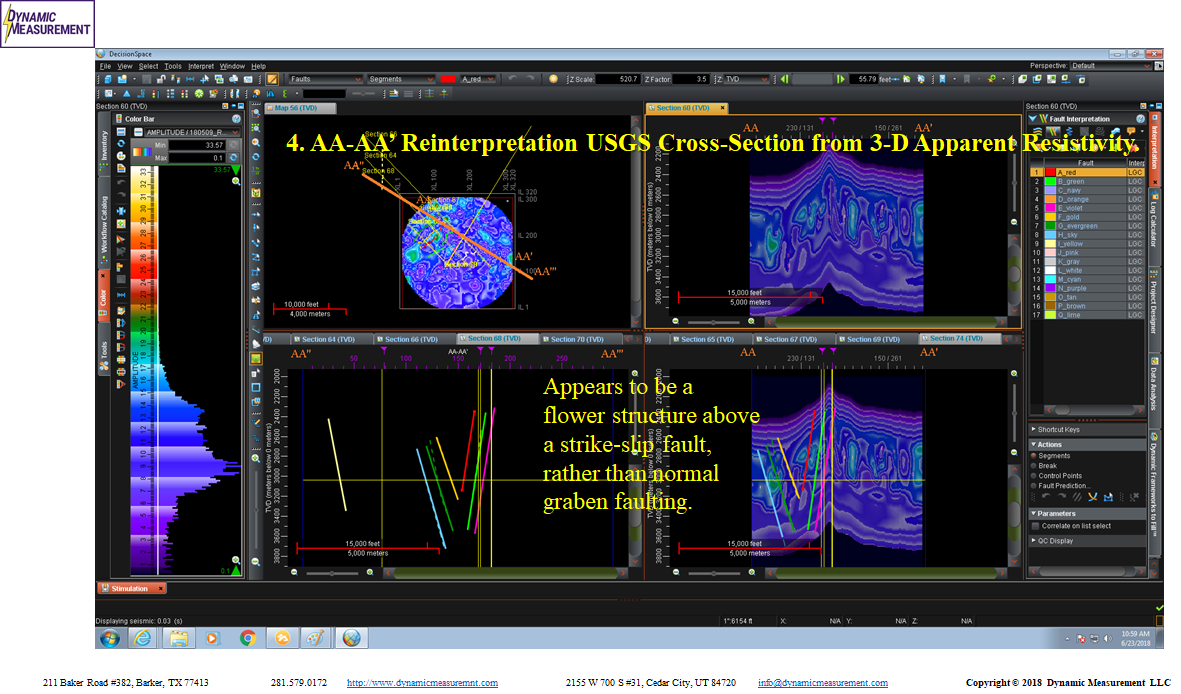
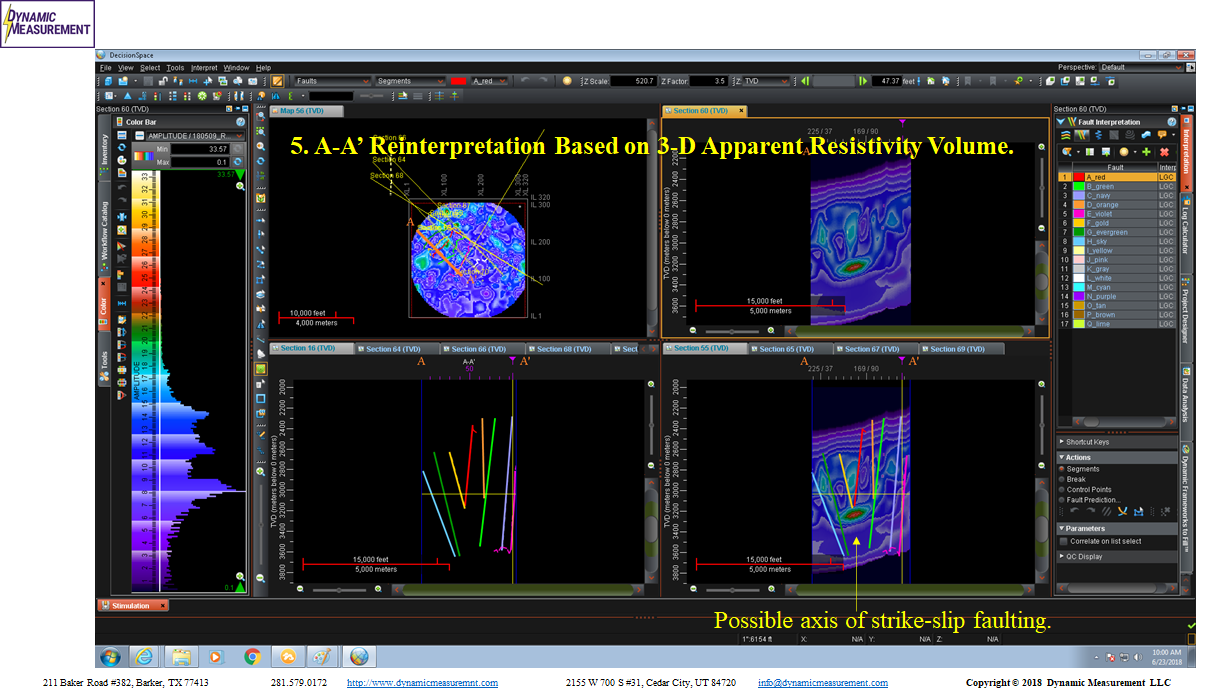
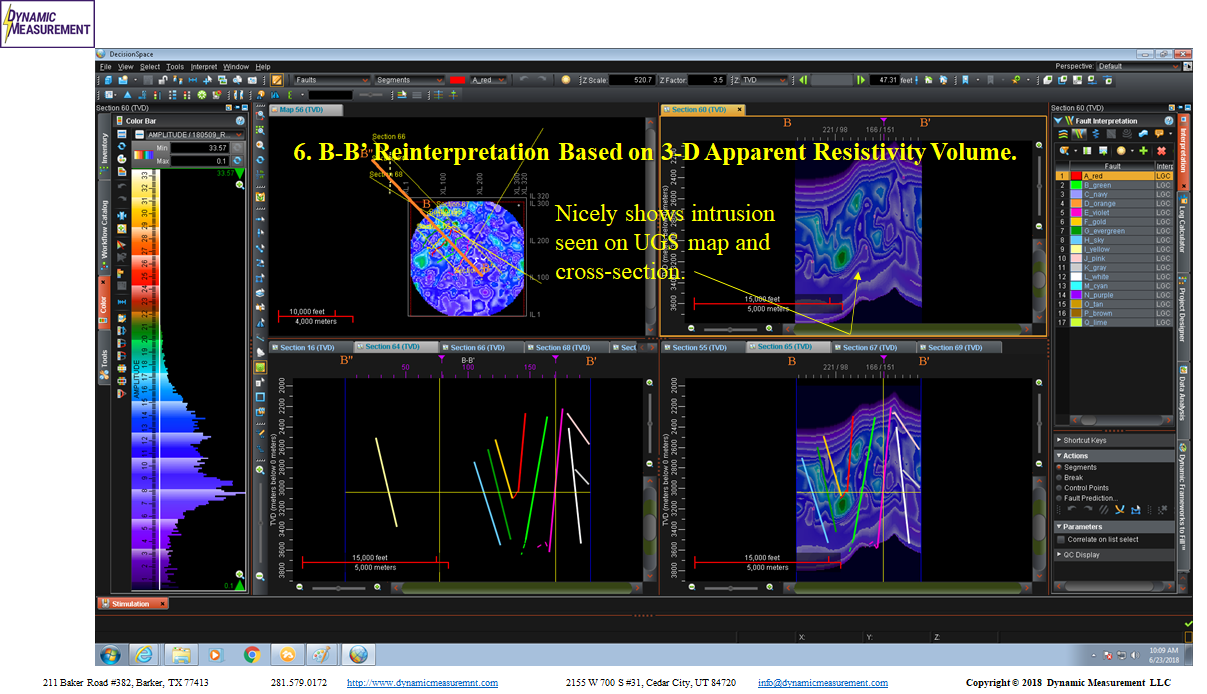
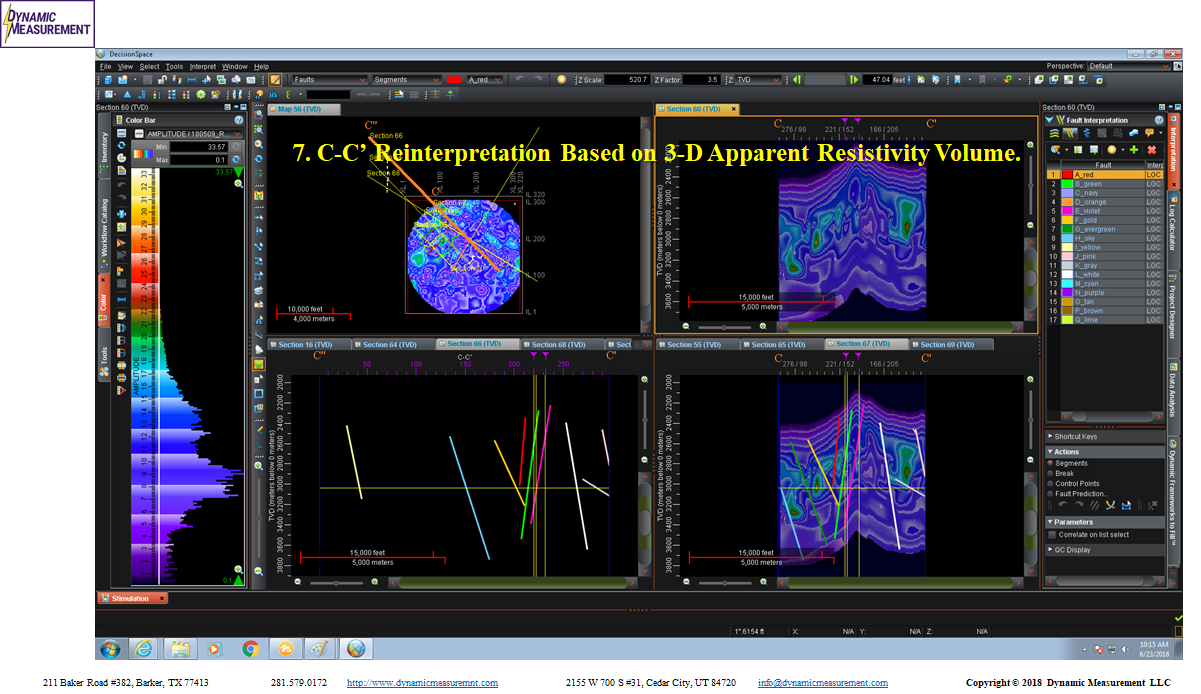
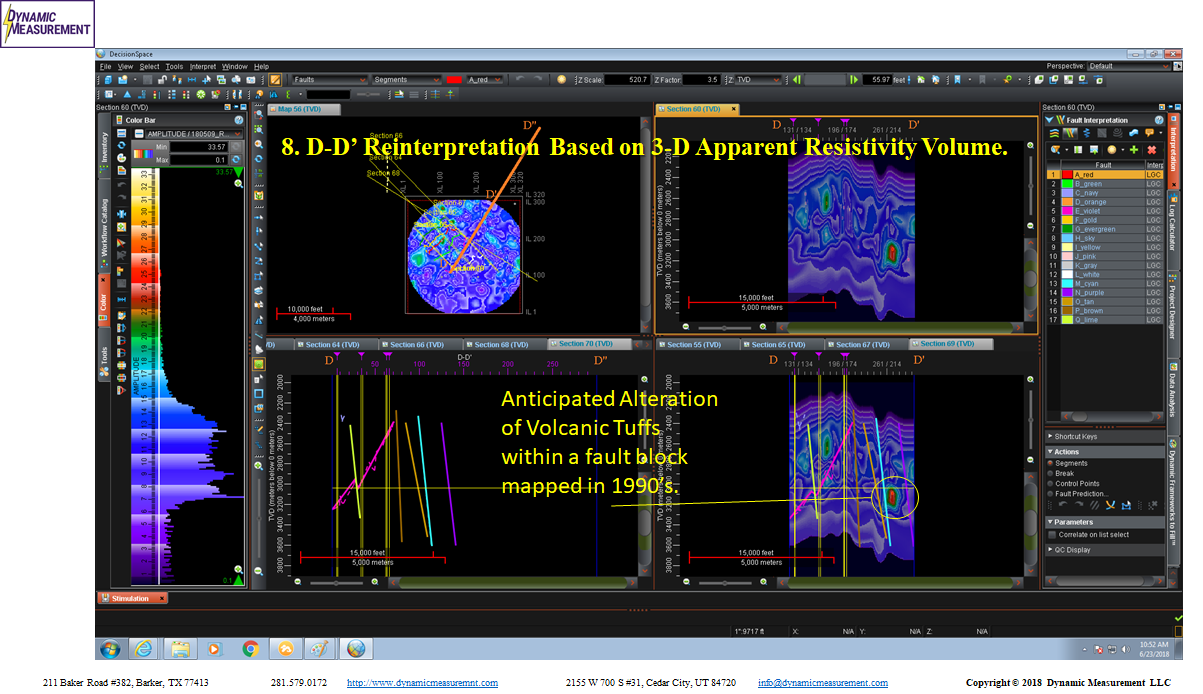
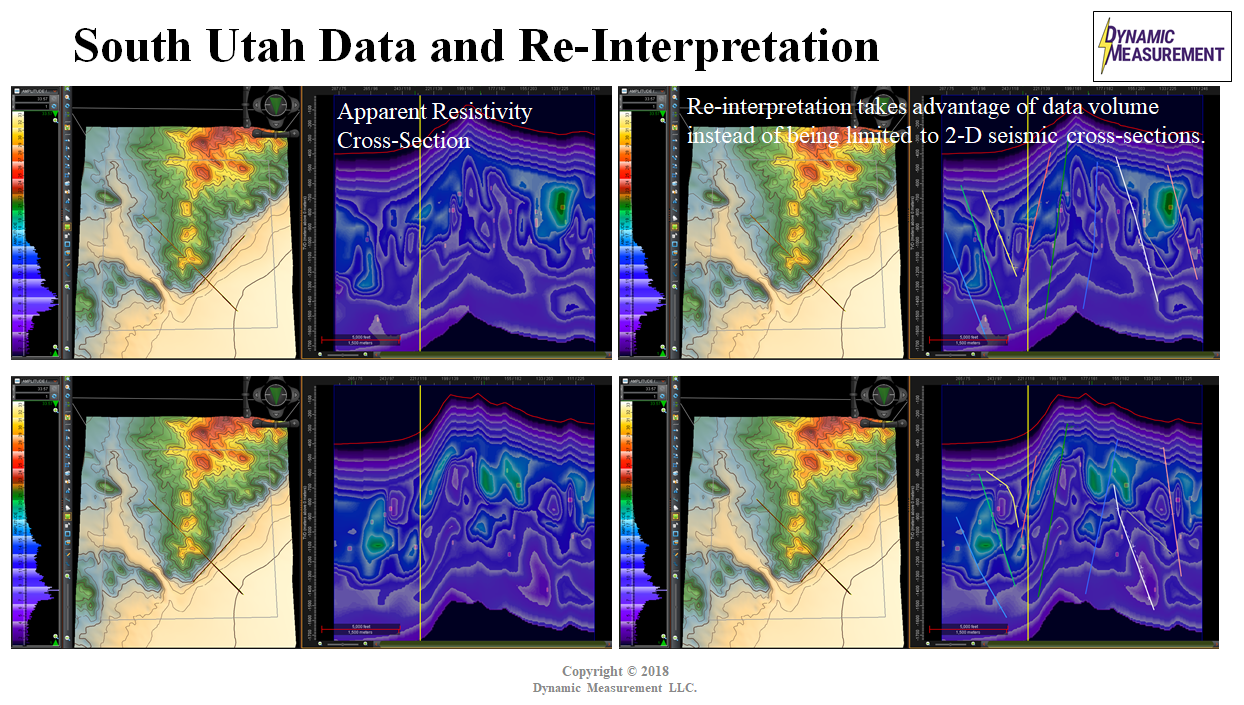
UGS D-D' with Resistivity | Reinterpretation AA-AA' Strike-Slip |
 |  |
 |  |
 |  |
 |  |
 |  |
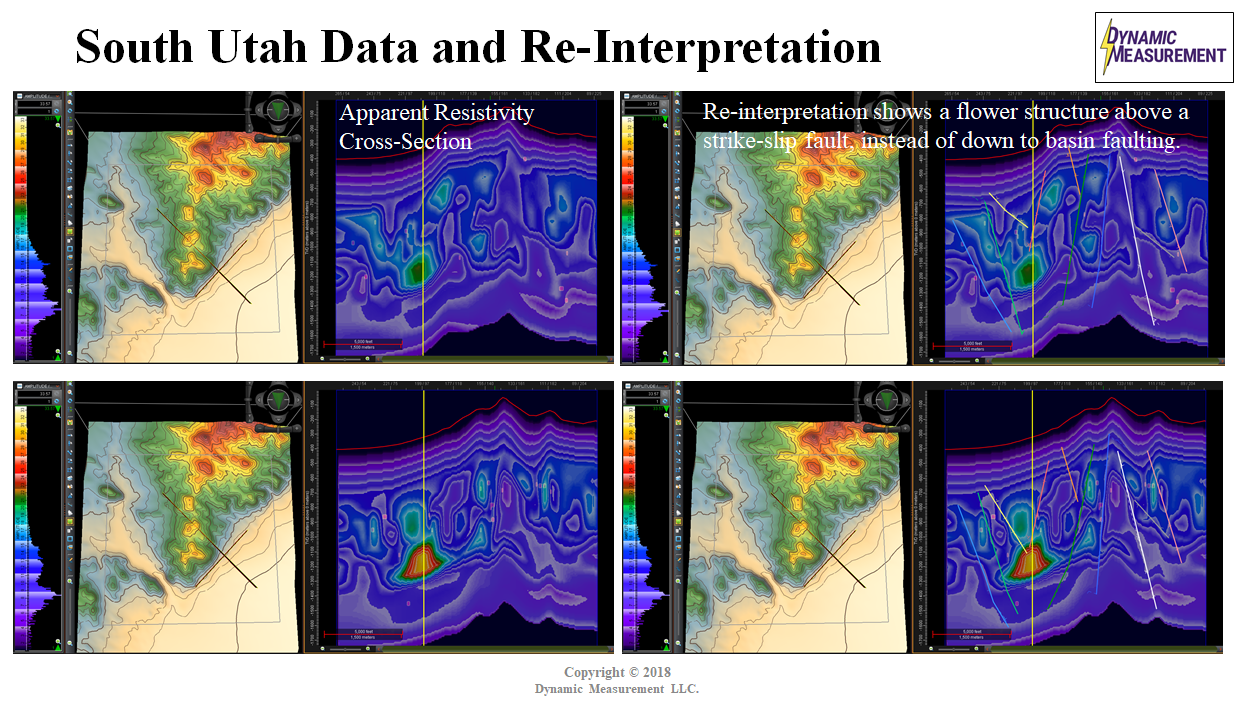
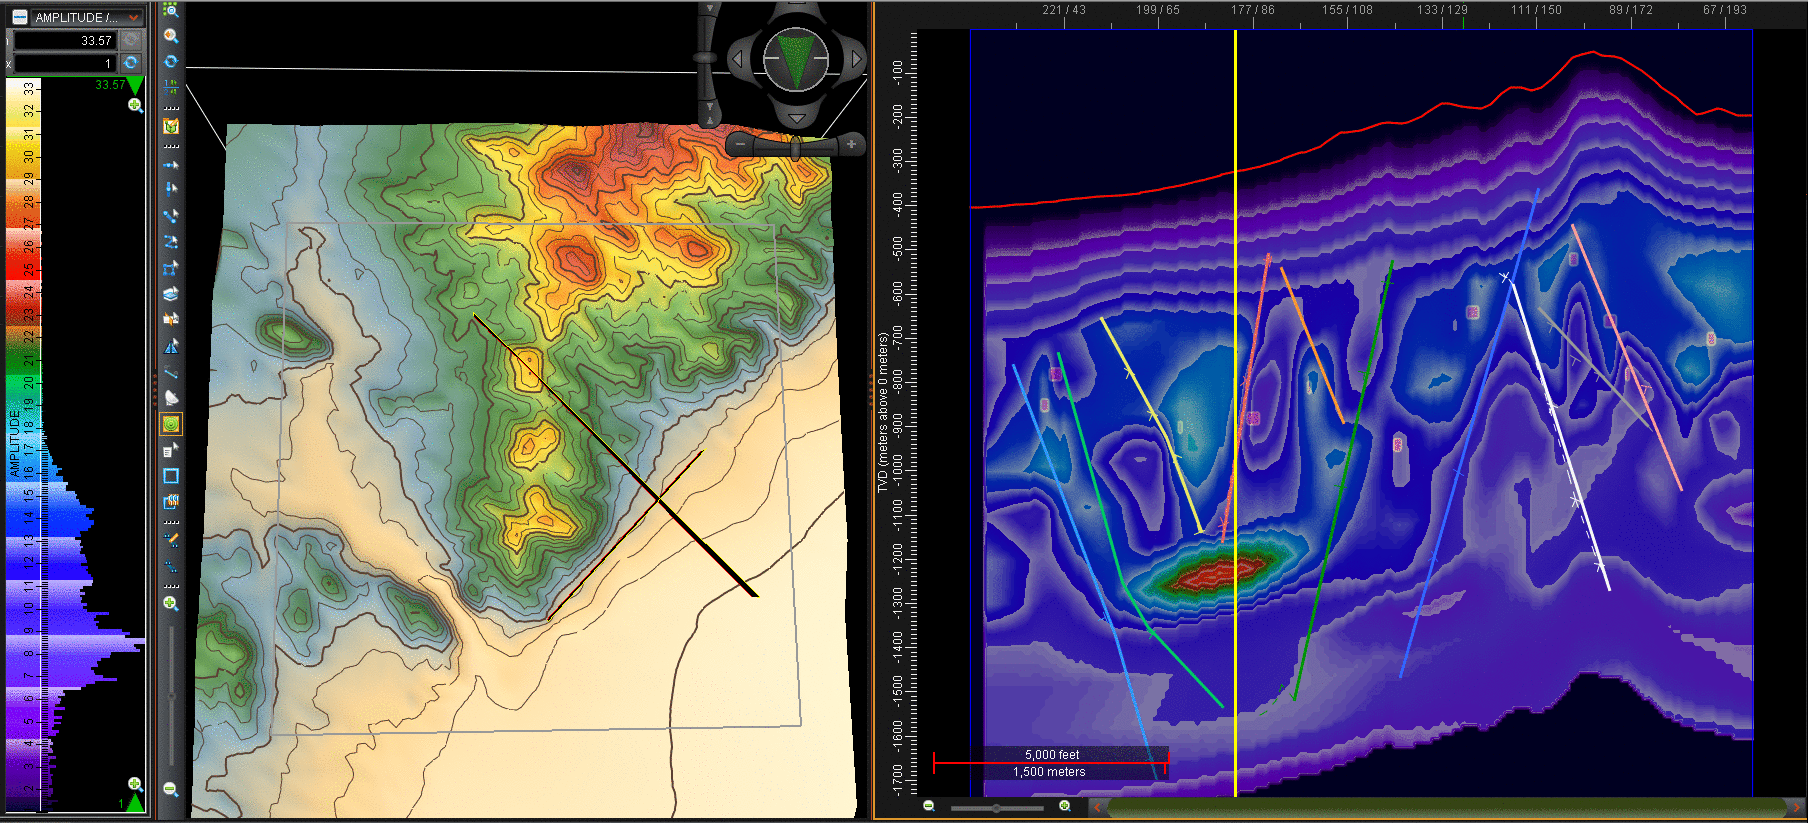
| Reinterpretation A-A' Flower Structure | Reinterpretation B-B' Strike-Slip Structure |
Reinterpretation C-C' Flower Structure | Reinterpretation D-D' Strike-Slip Structure |
4 Re-interpreted Sections to South | 4 Reinterpreted Sections to North |
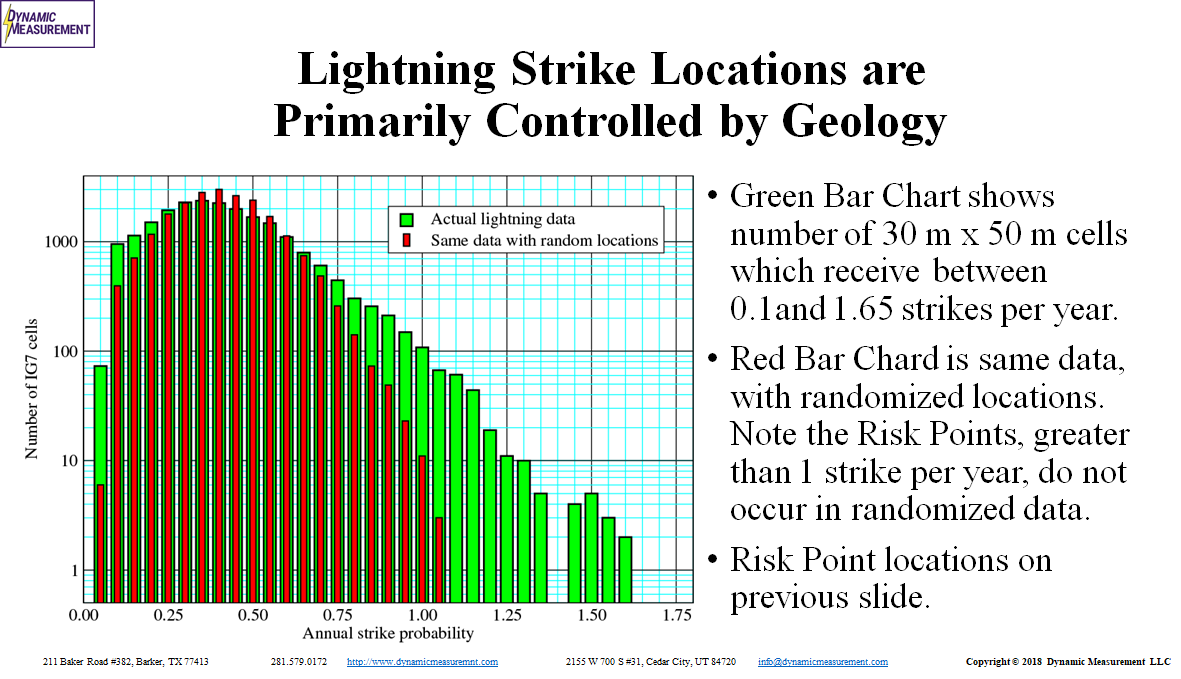
Animation Through Data & Interpretation | Plot Random vs. Raw, Risk Points > 1 Strike/Year |
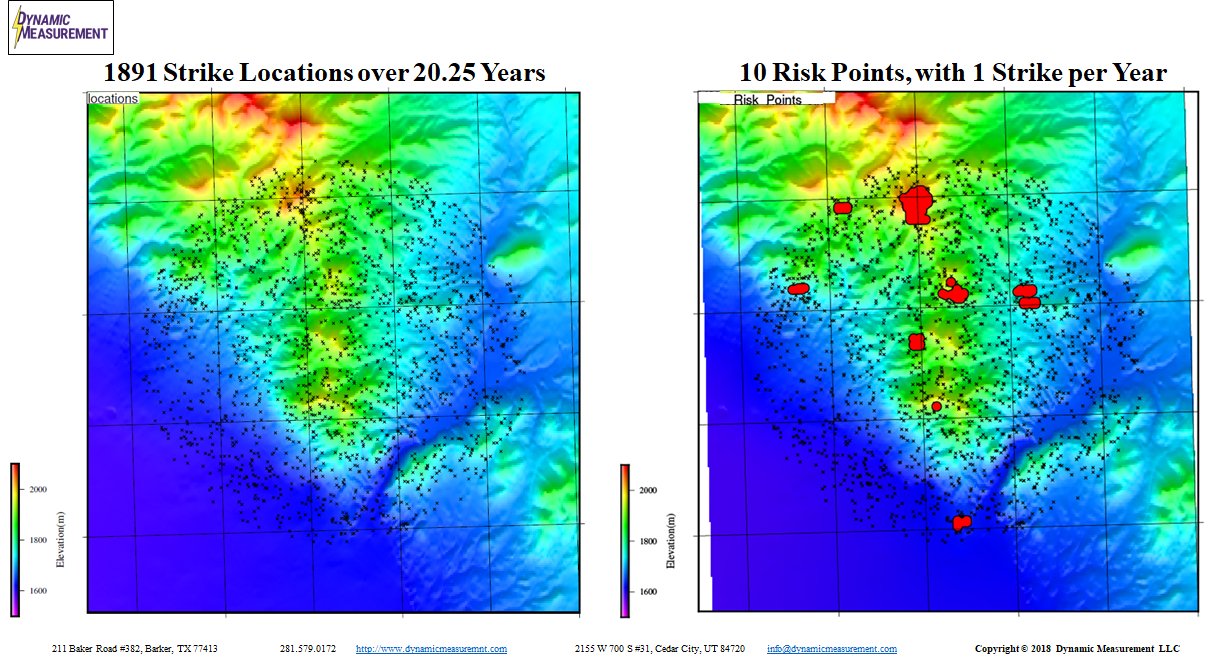
1891 Strike & 10 Risk Point Locations | Risk Point Maps South UT, South TX, CA, AZ & TX |
 |  |
 |  |
 |  |
 |  |
 |  |
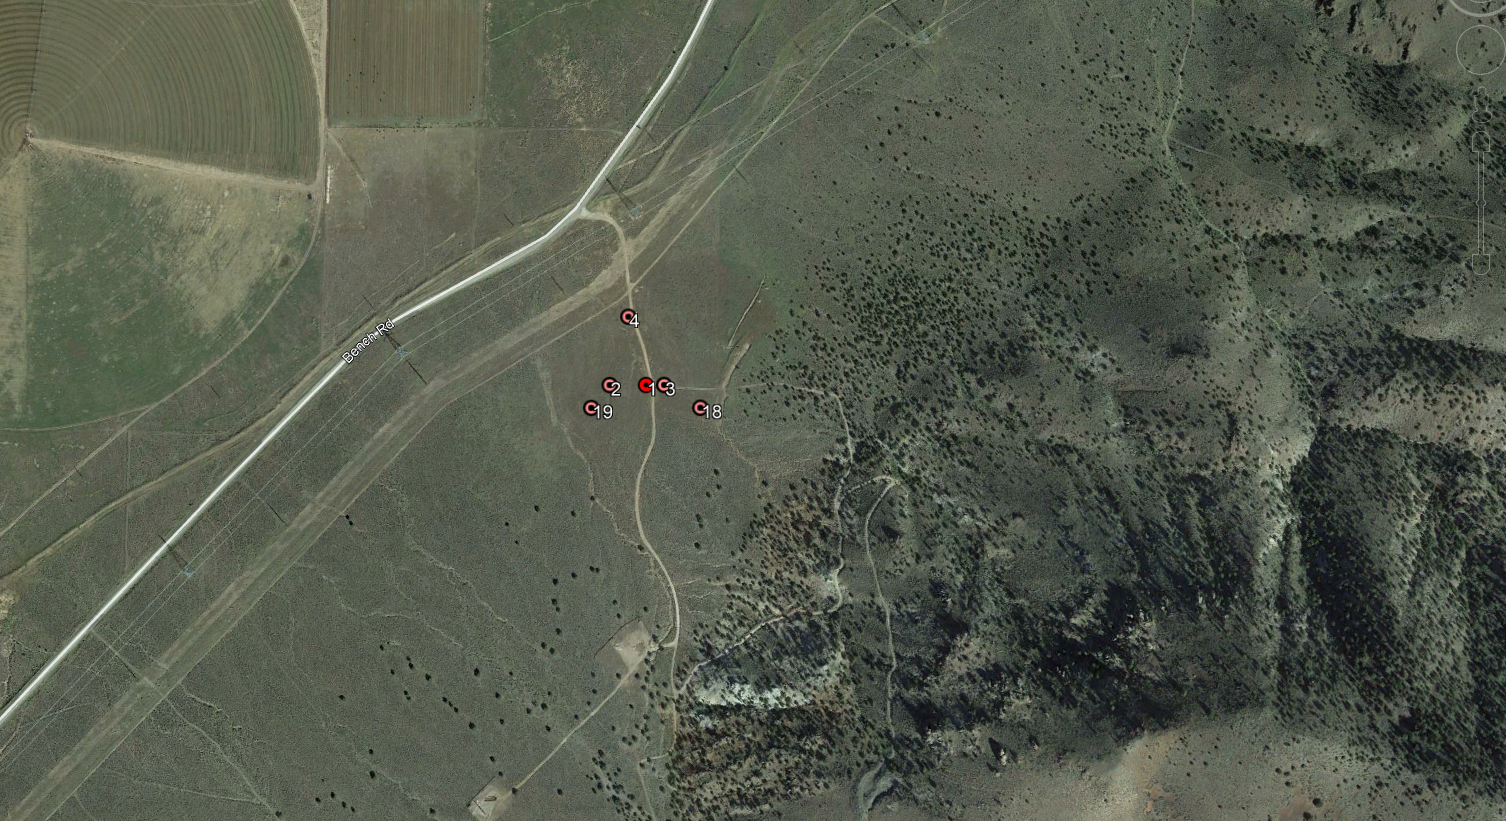
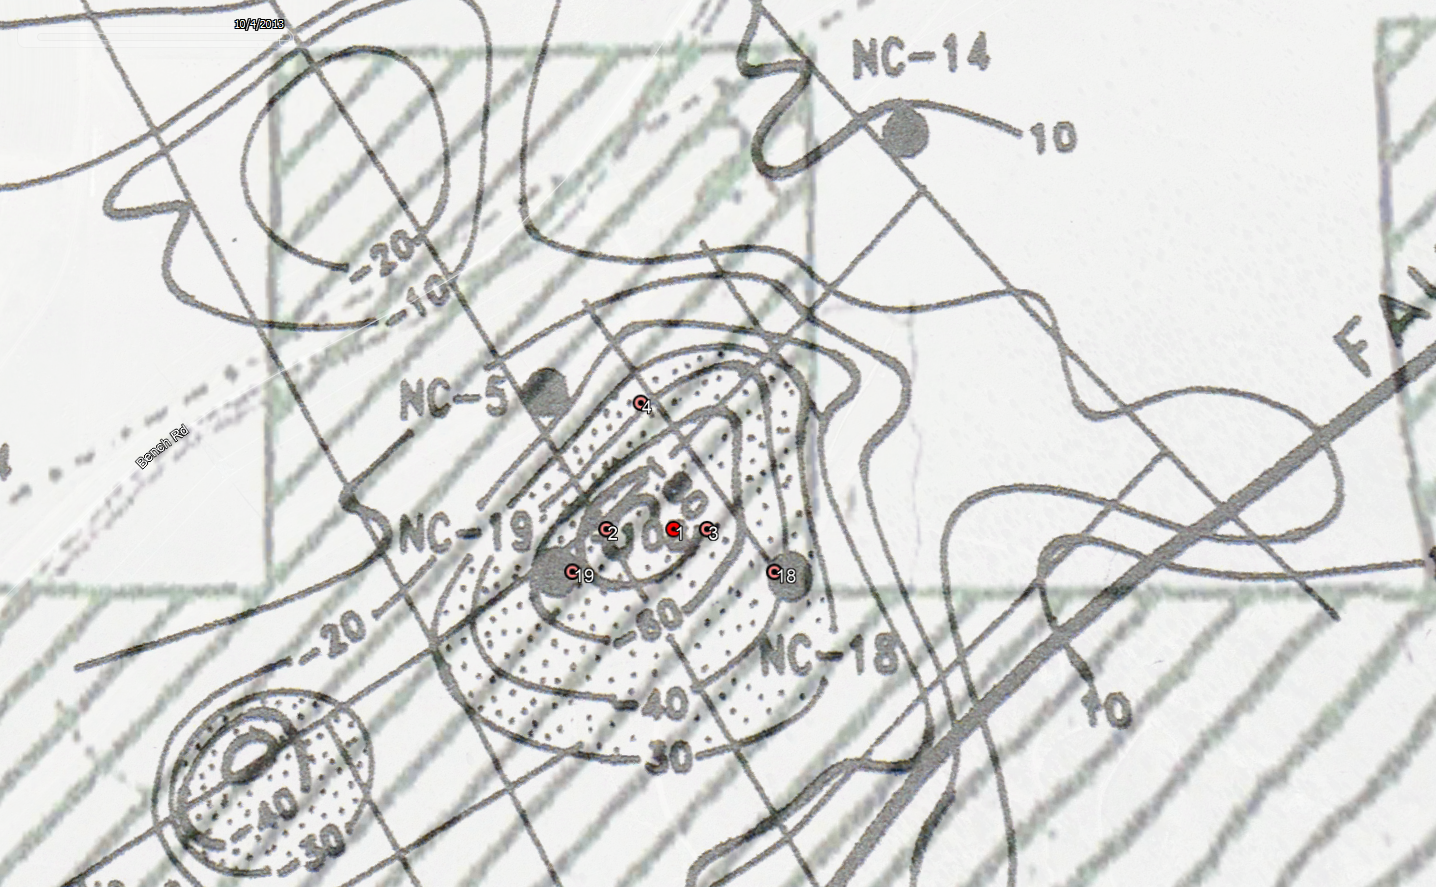
| GoogleEarth with Gradient Wells | Gradient Wells with IP Survey |
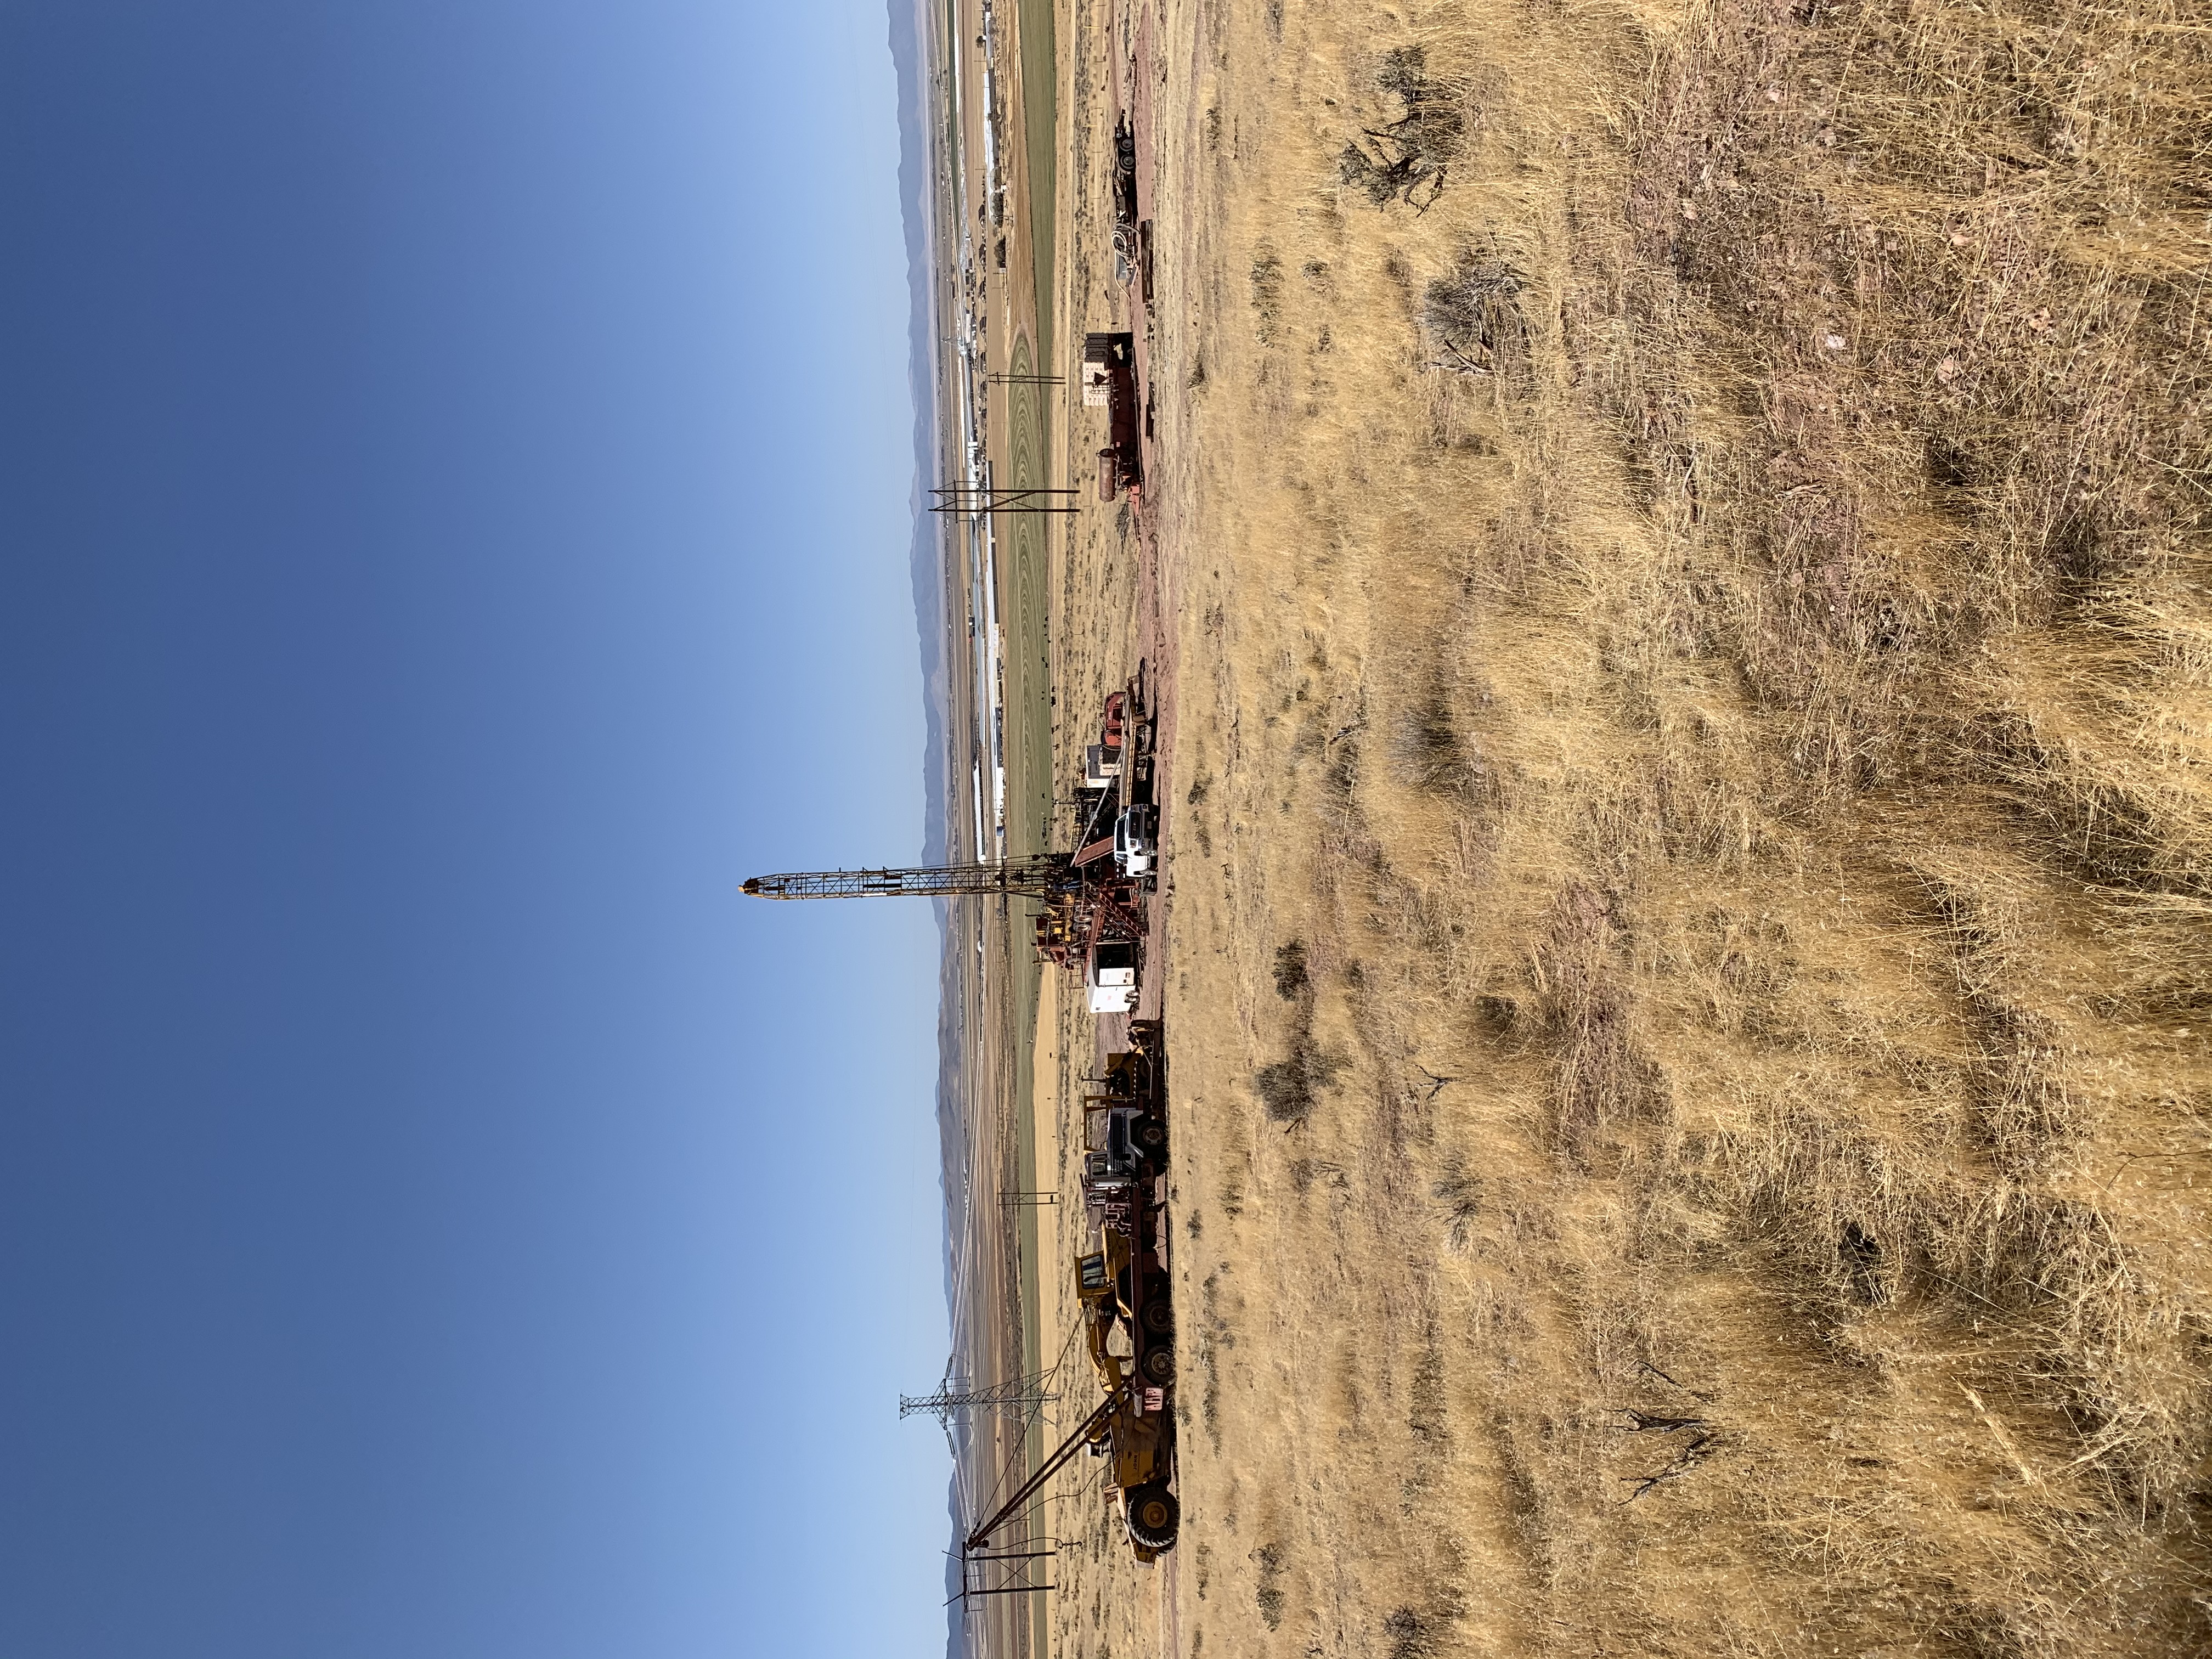
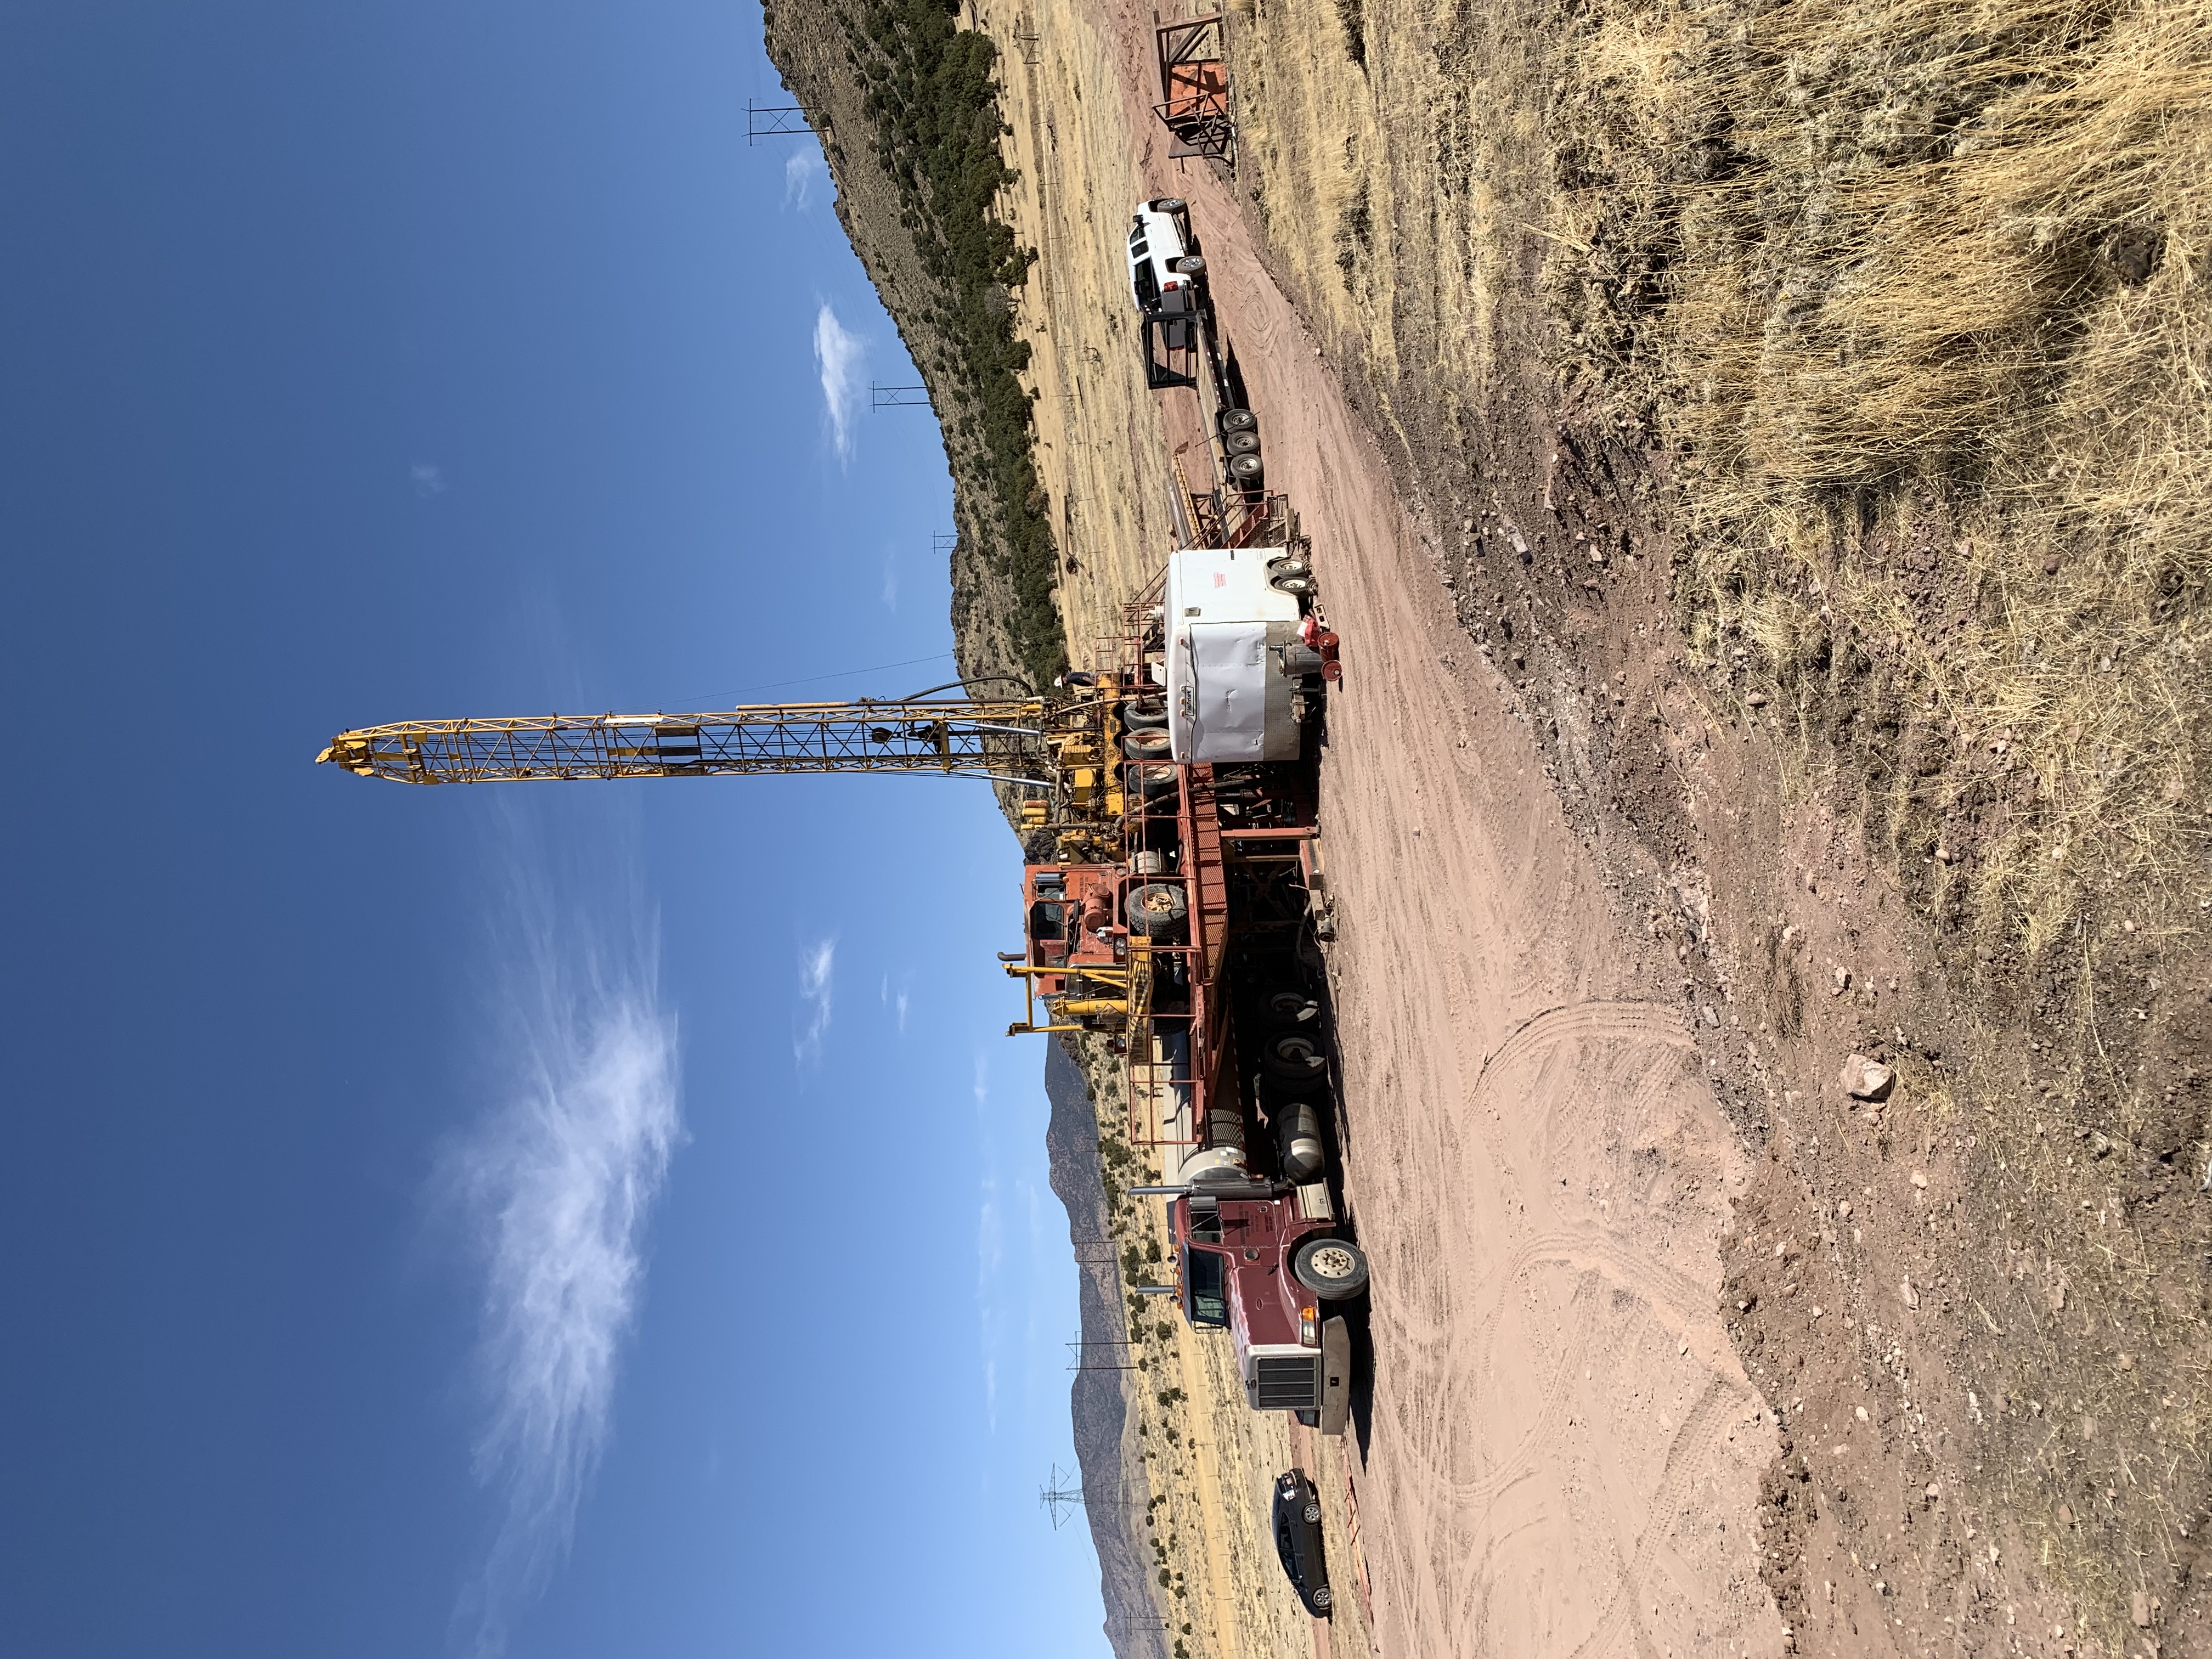
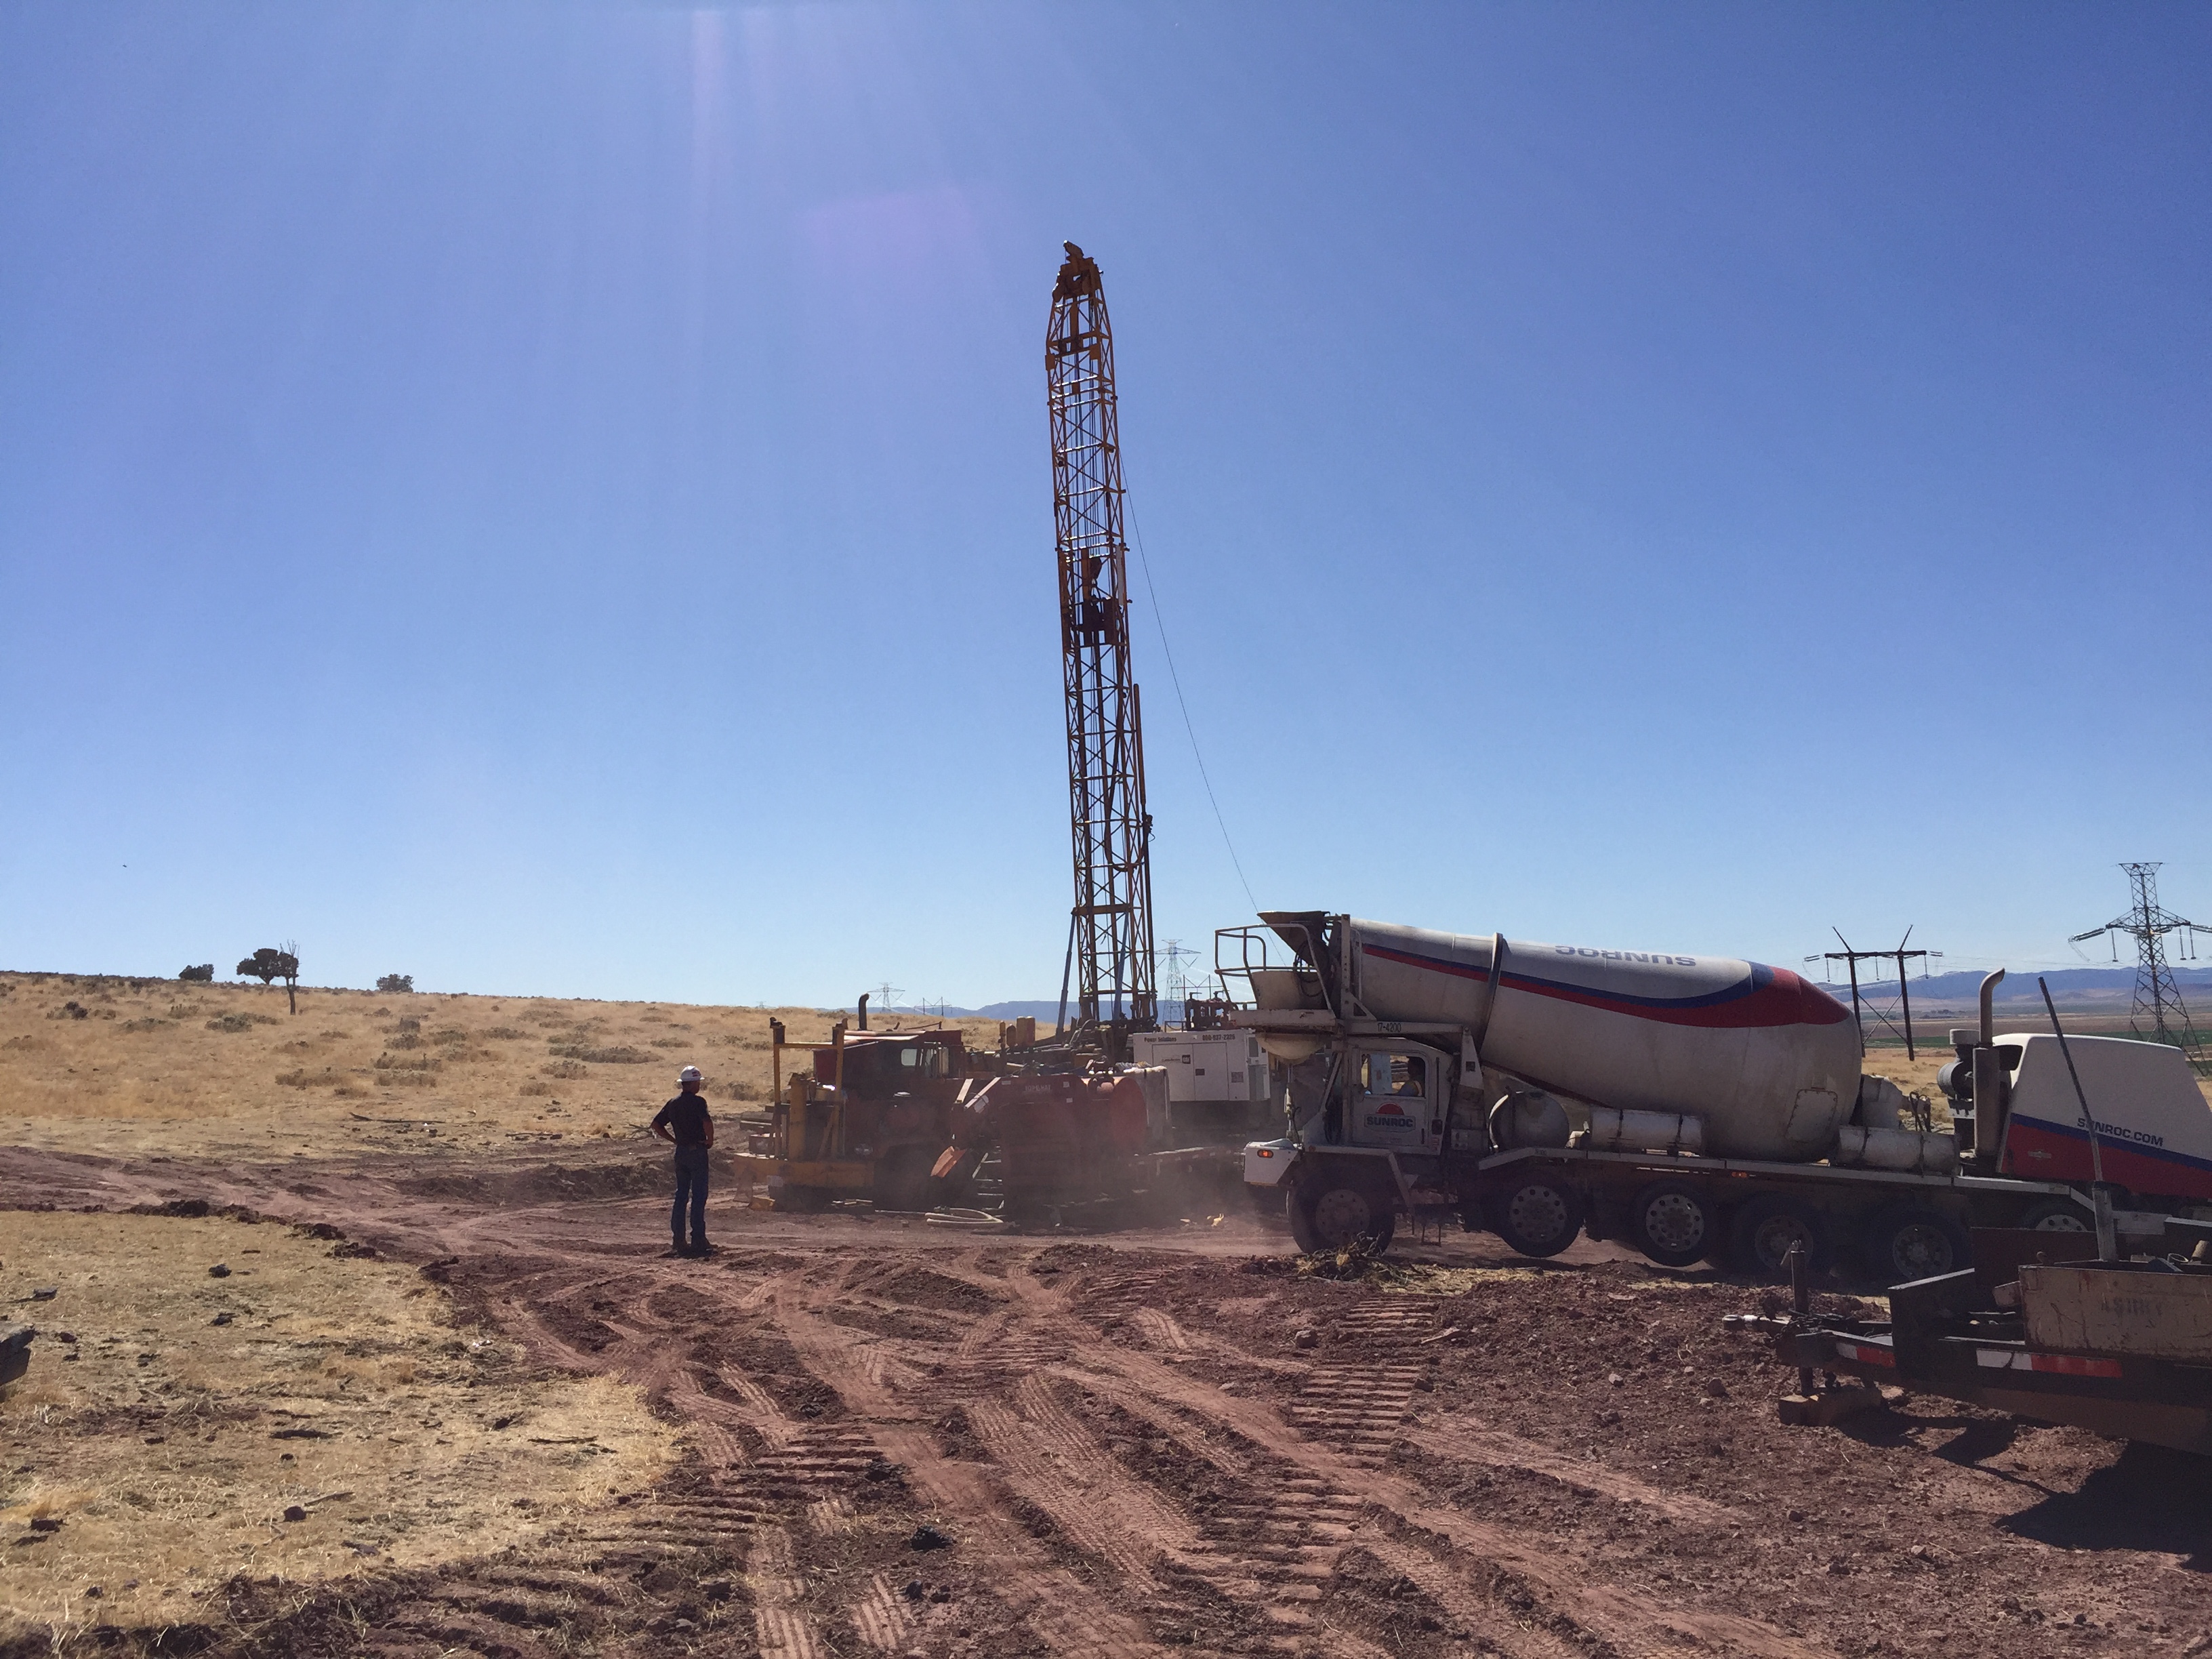
Area Snow Melt with T&R | First Gradient Hole to northwest |
First Gradient Hole to southeast | First Gradient Hole to southwest |
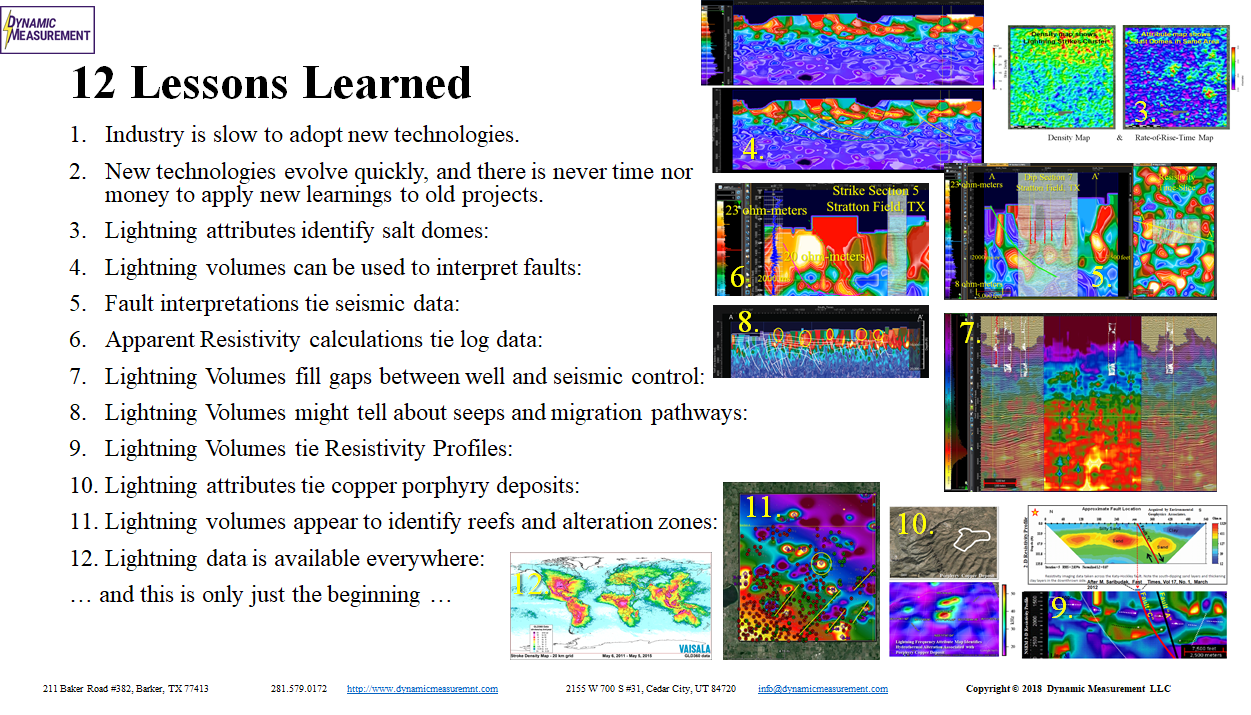
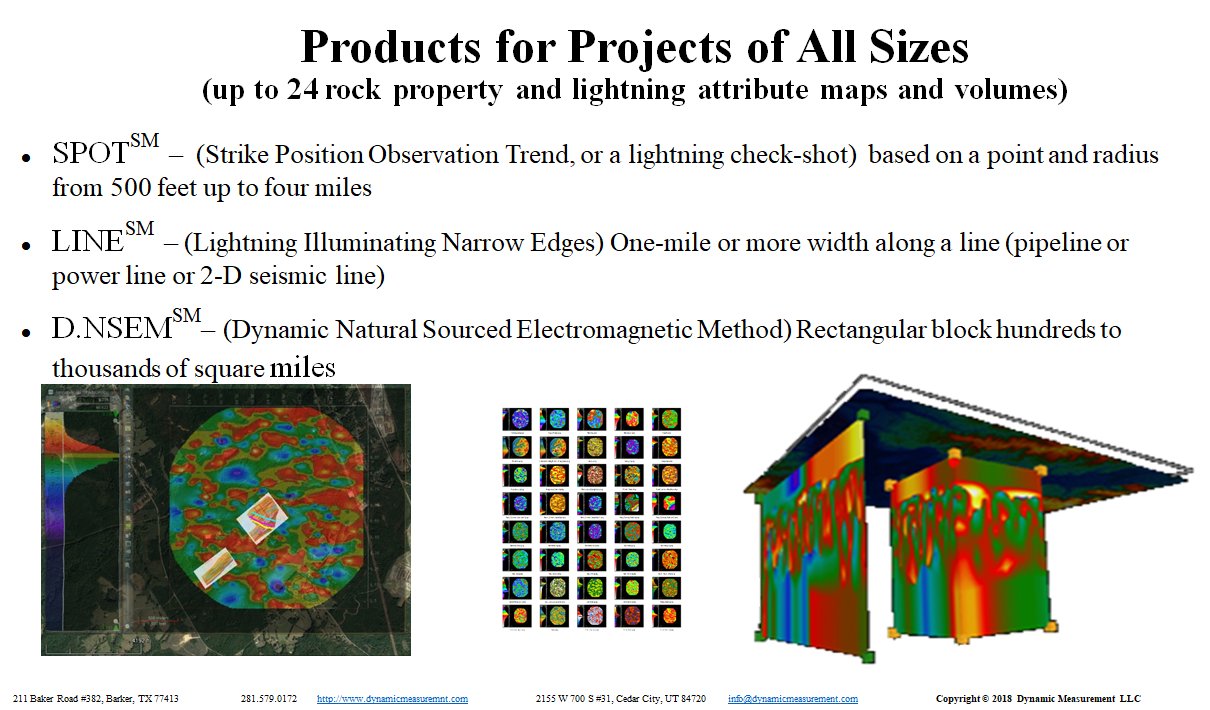
Lessons Learned | SPOTsm, Linesm, d.NSEM Products |
Contact Information | Background Photo |
 |  |
 |  |
 |  |
 |  |
 |  |
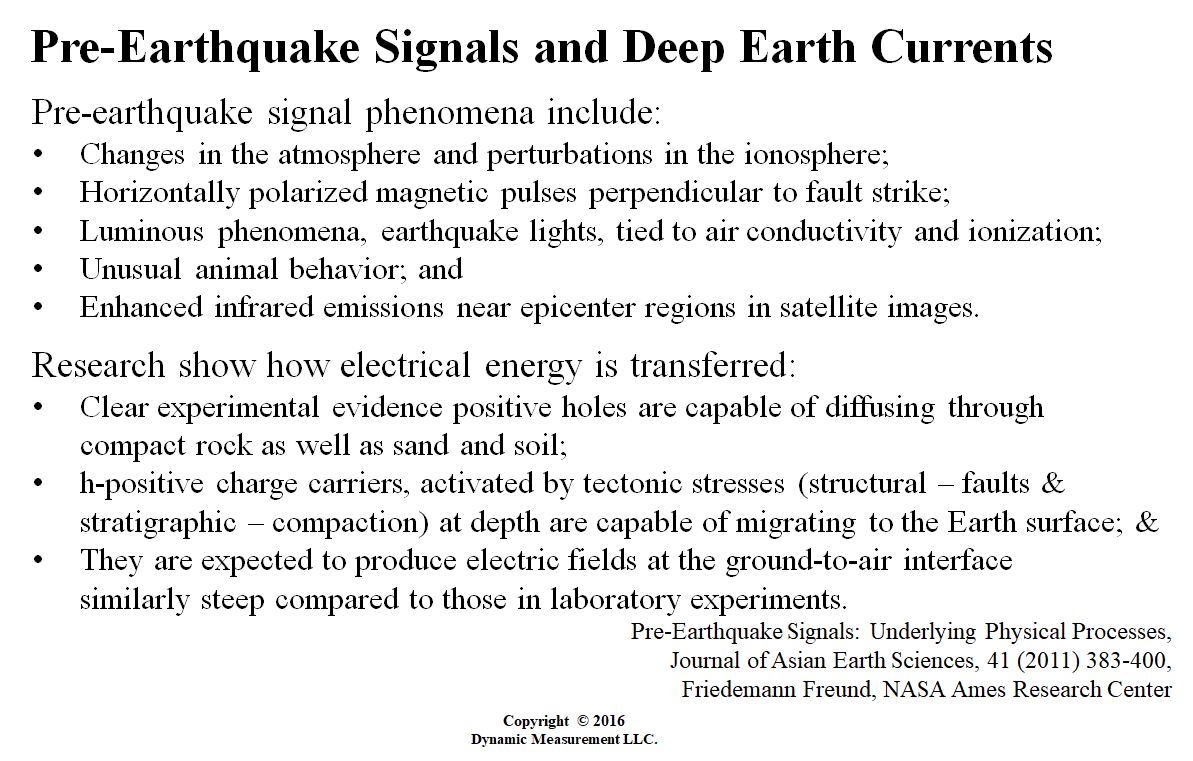
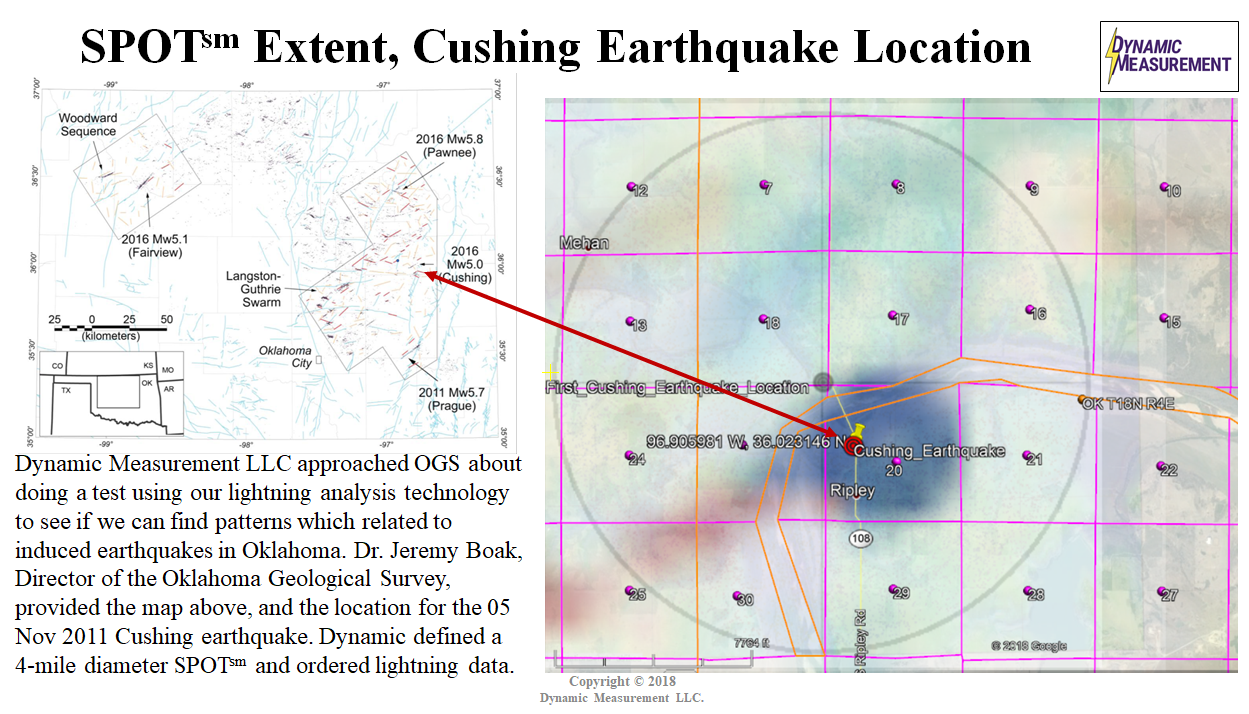
| Could lightning databases be used to predict earthquakes? | Lightning data +11 & -9 years of Cushing, OK earthquake. |
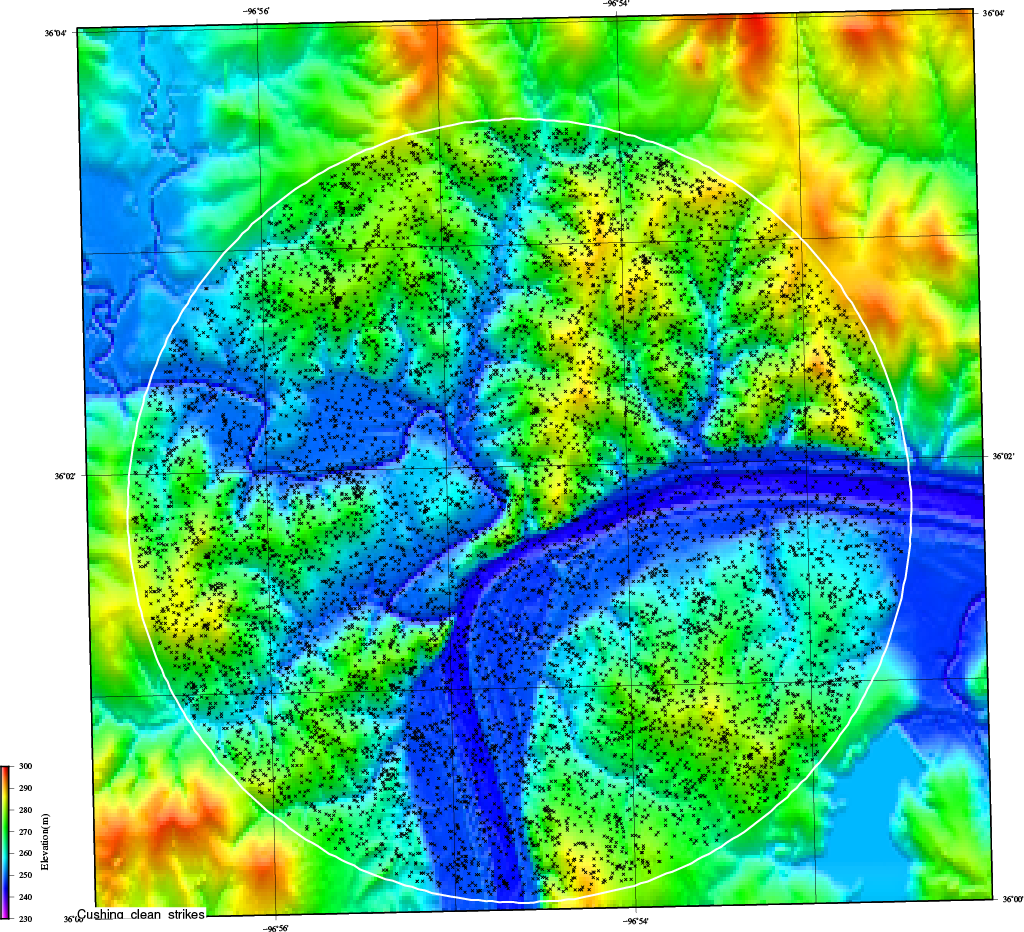
Hypothesis: pressure increase conductive, release resistive | Raw Lightning Strikes Cushing, Oklahoma 20+ Years |
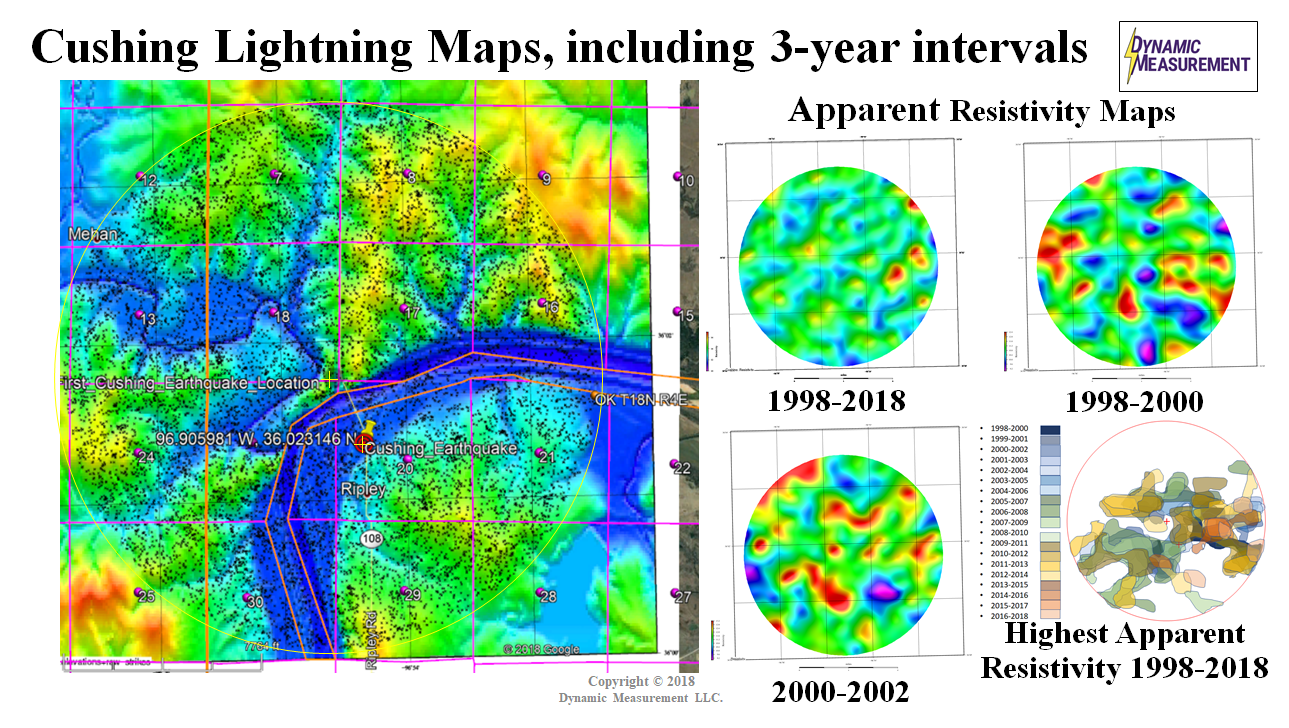
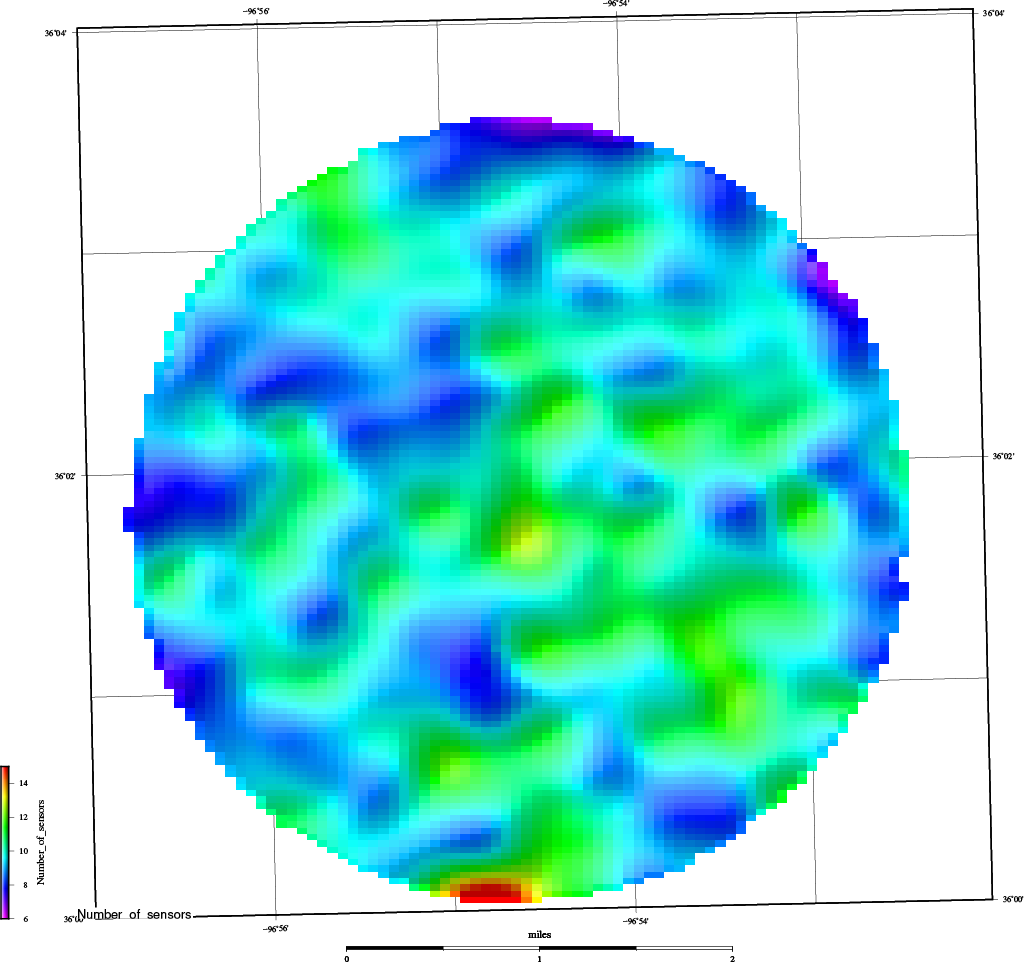
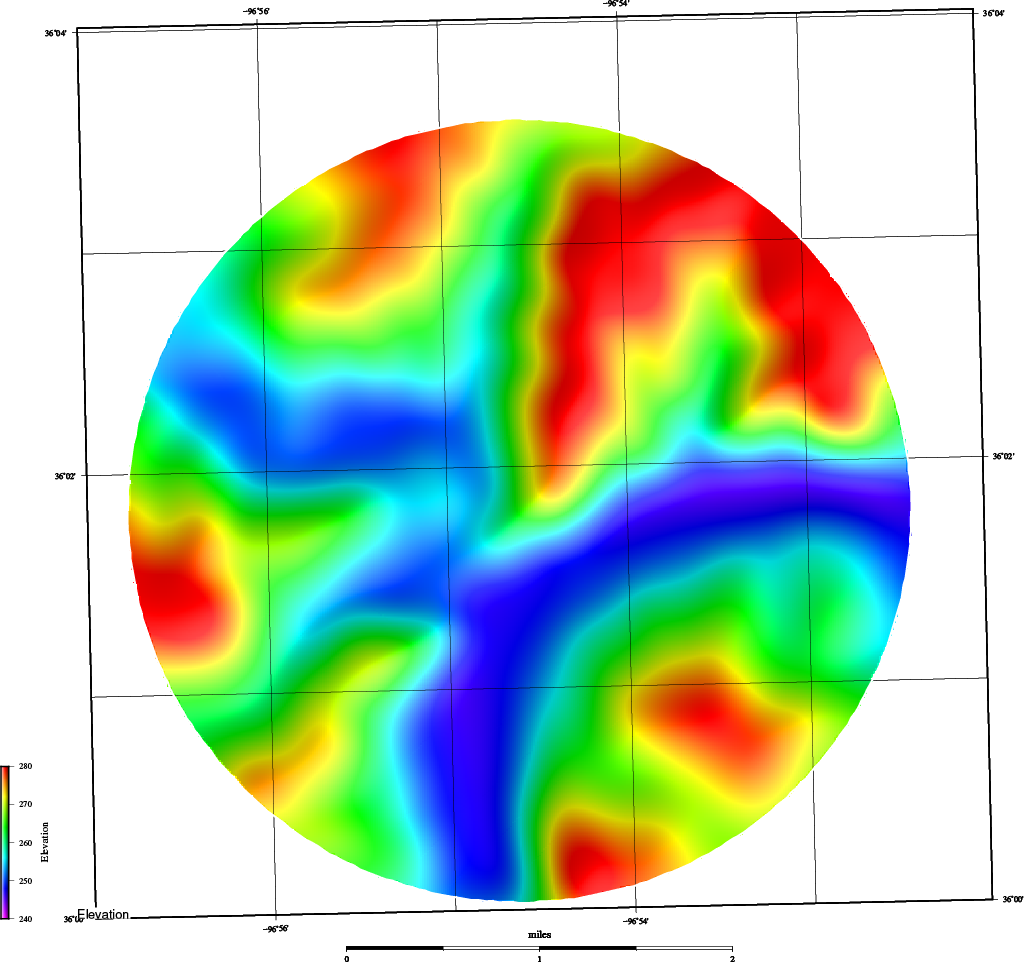
Cleaned Lightning Strikes Cushing, Oklahoma 20+ Years | IG6 Interpolation (250x150 m cells) # Sensors Recording Strikes |
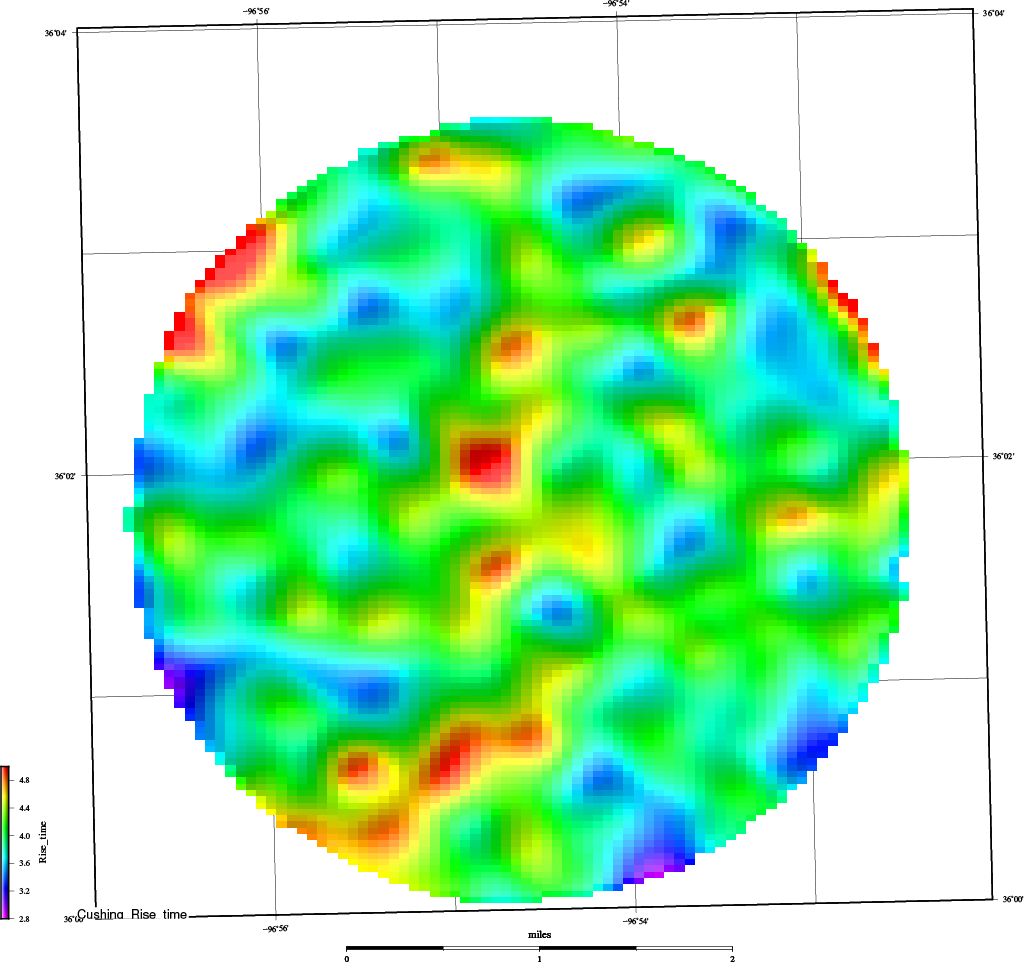
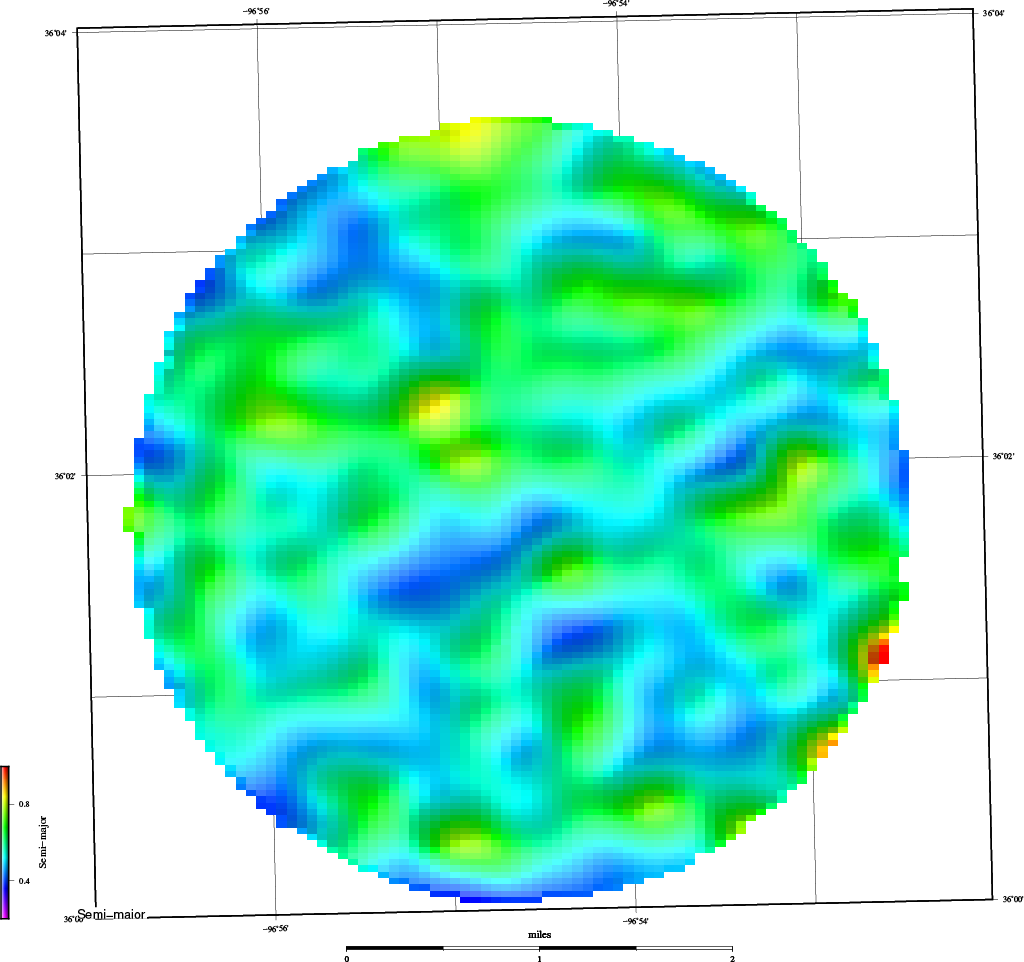
IG6 Interpolation Rise-Time Data (Start Time to Peak Current) | IG6 Interpolation Semi-Major Axis (major axis error sensor recordings) |
IG6 Interpolation Semi-Minor Axis (minor axis error sensor recordings) | IG7 Interpolation (50x30 m cells) of U.S. Topography Data |
 |  |
 |  |
 |  |
 |  |
 |  |
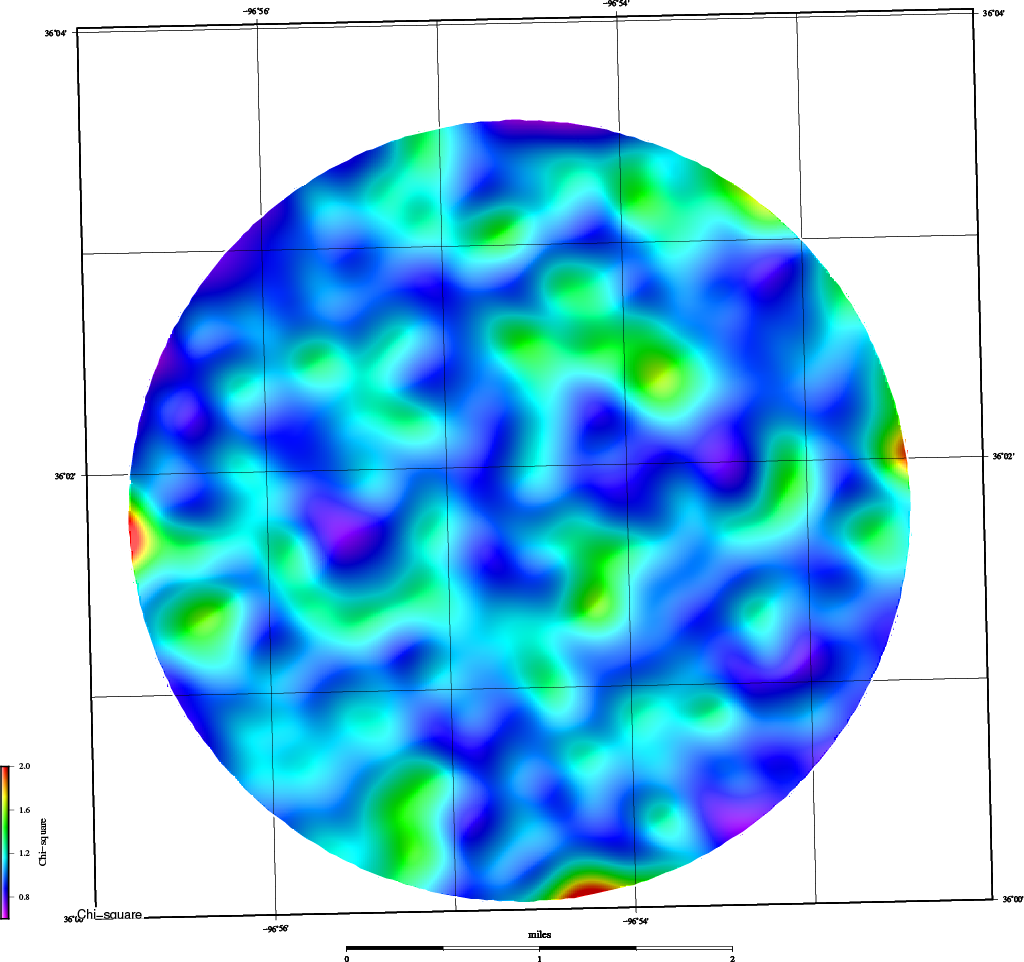
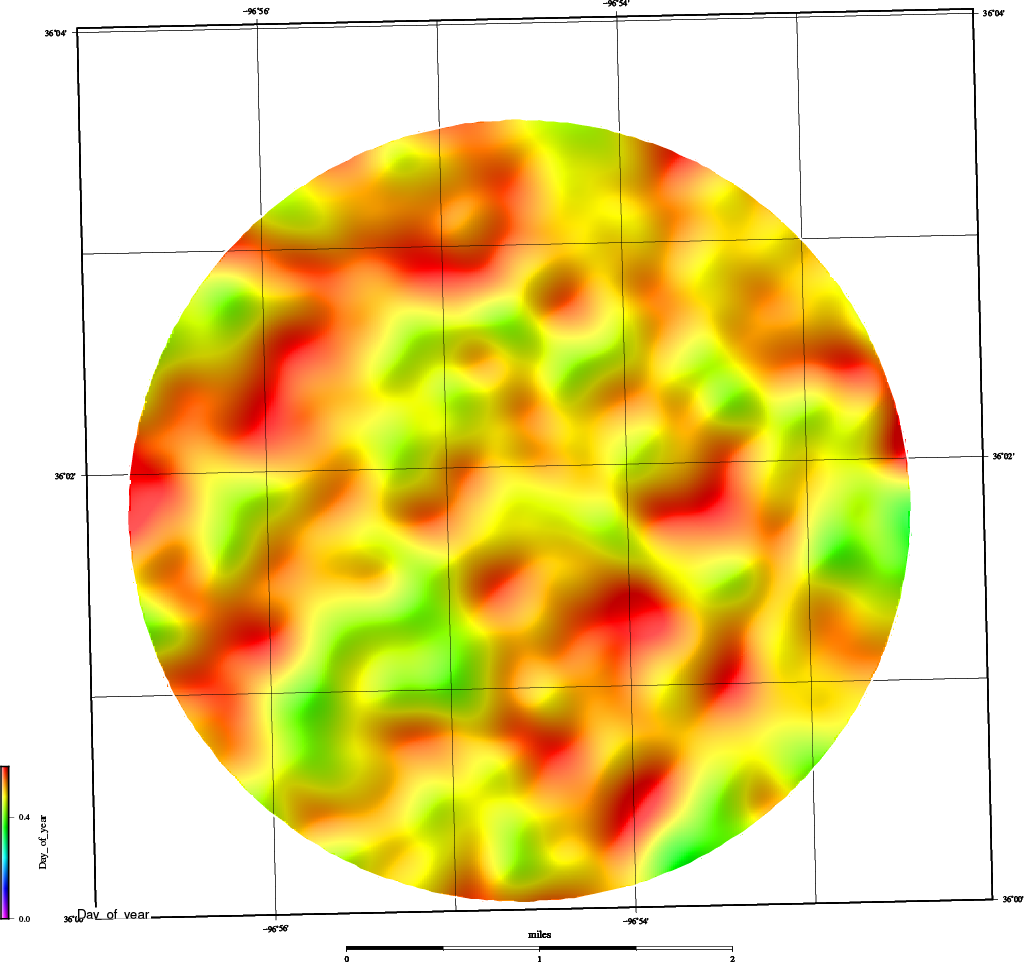
| IG7 Chi Squared (quality measure) | IG7 # Strikes on Day-of-Year |
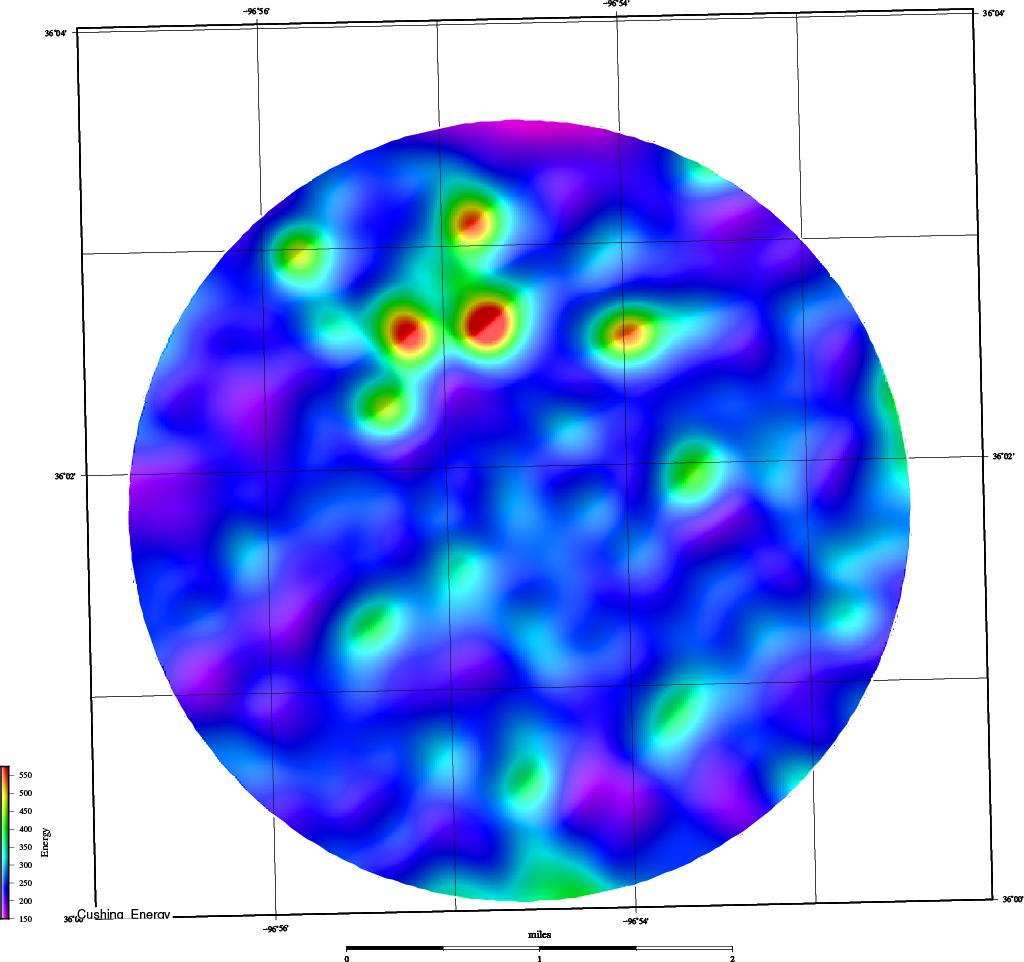
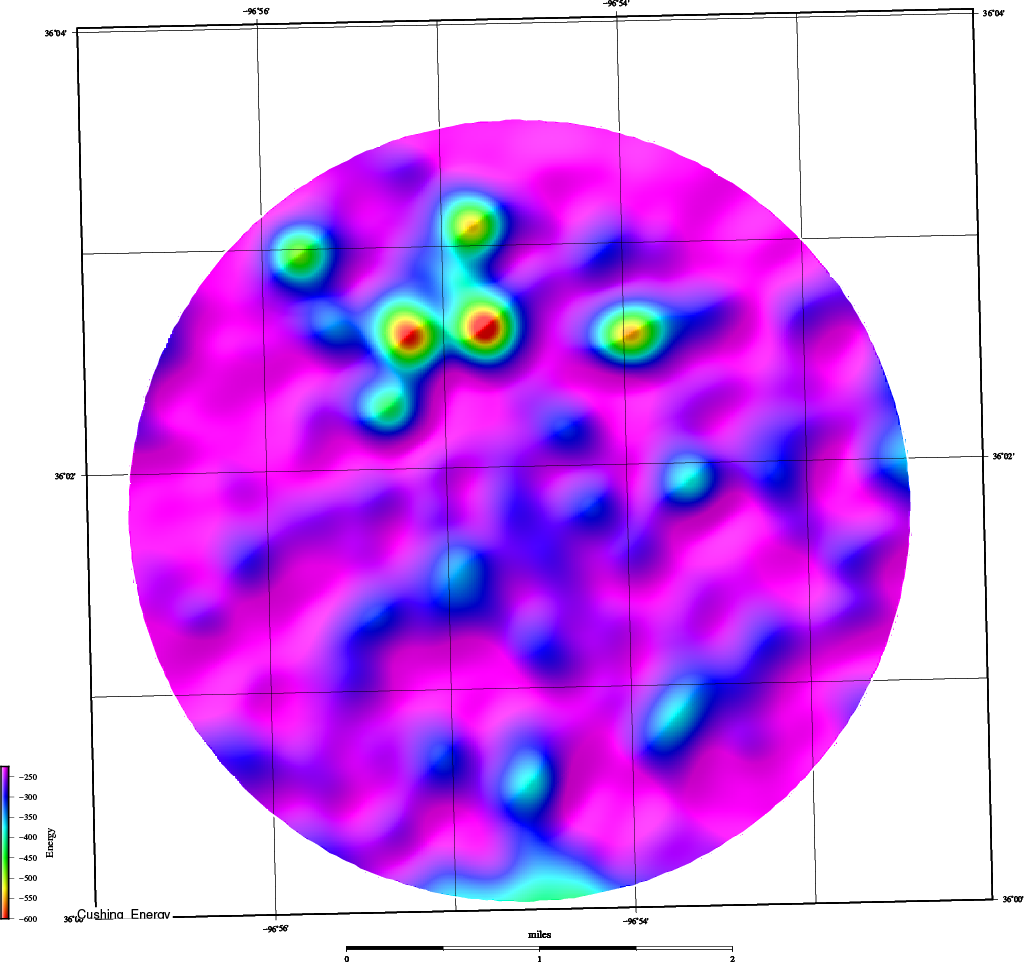
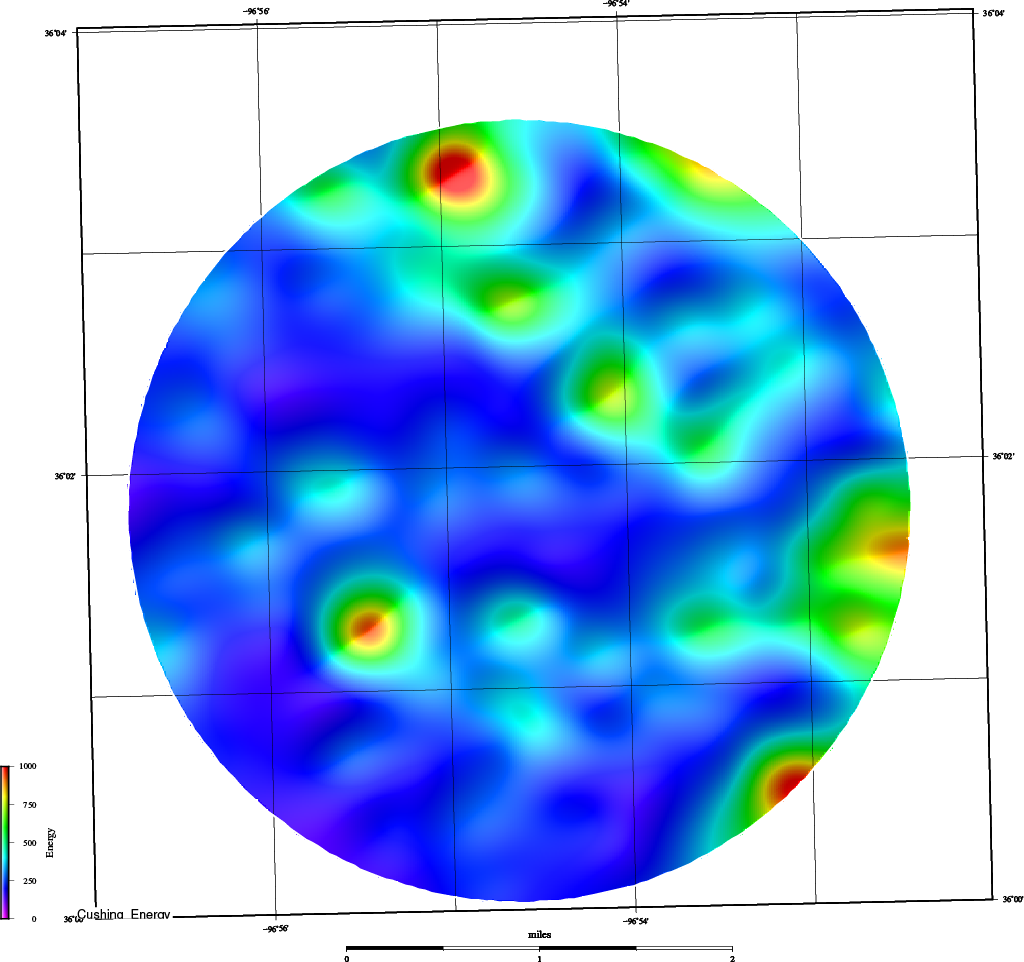
IG7 Average Energy (area) | IG7 Negative Energy (under) |
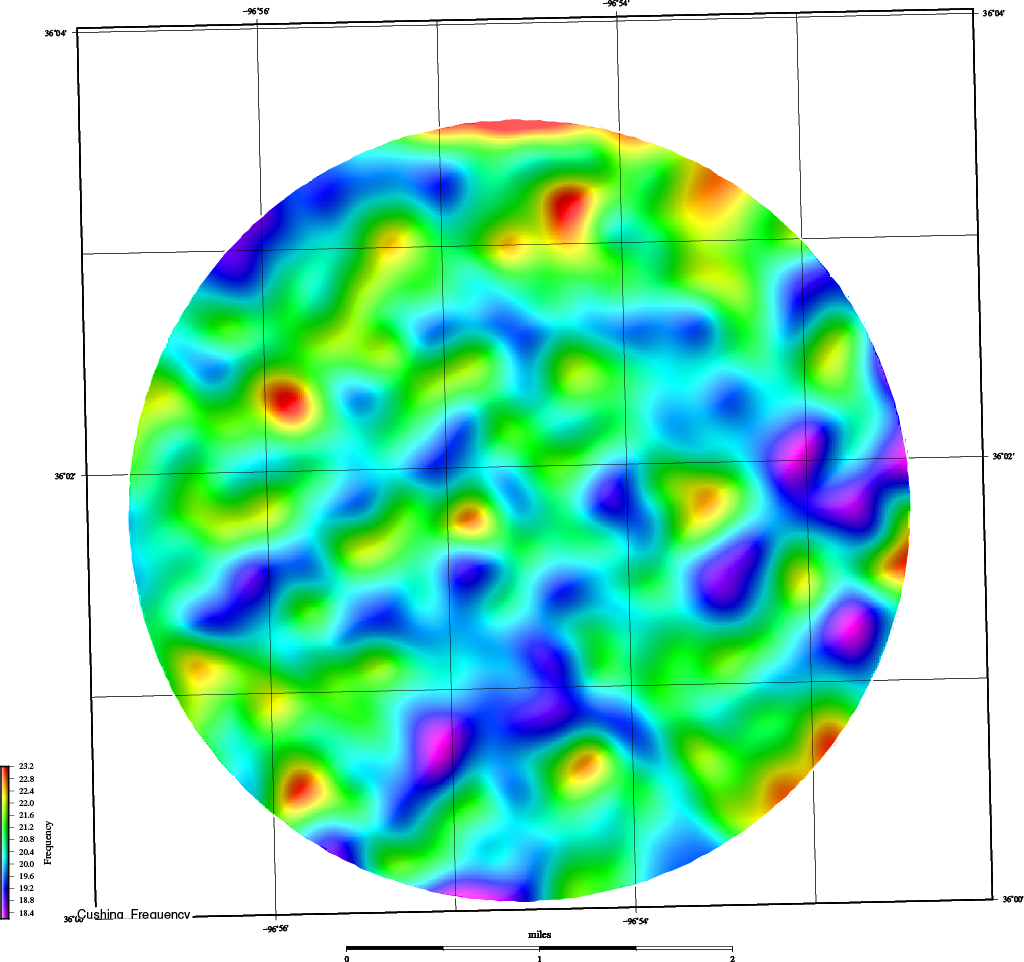
IG7 Positive Energy (curve) | IG7 Interpolation Frequency |
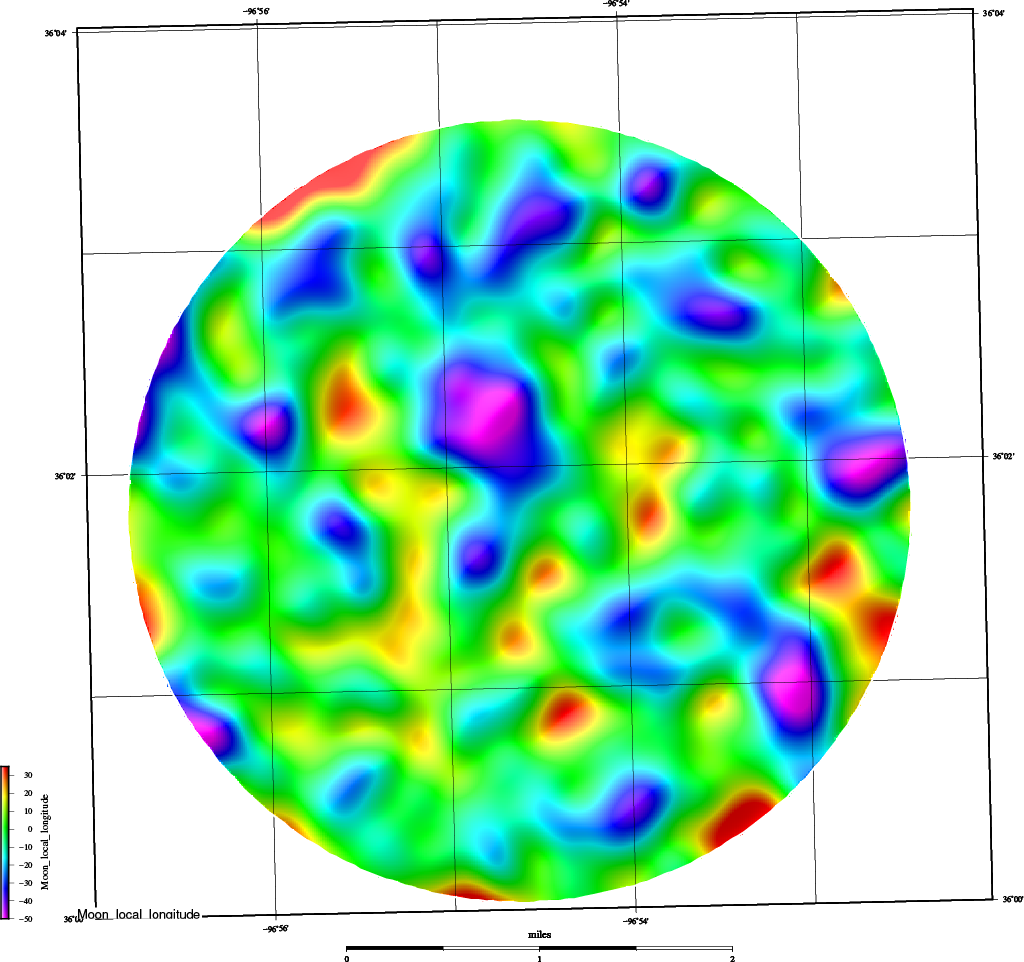
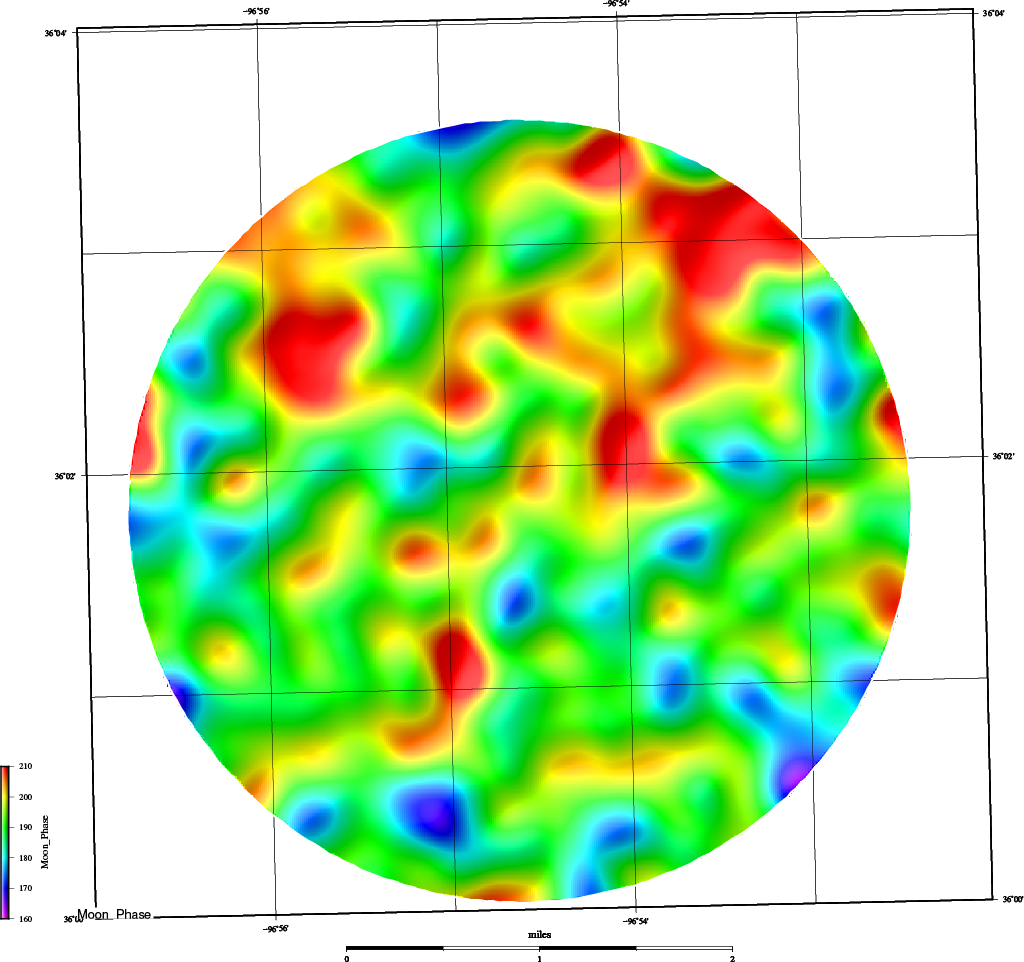
IG7 Moon Local Longitude | IG7 Strikes at Moon Phase |
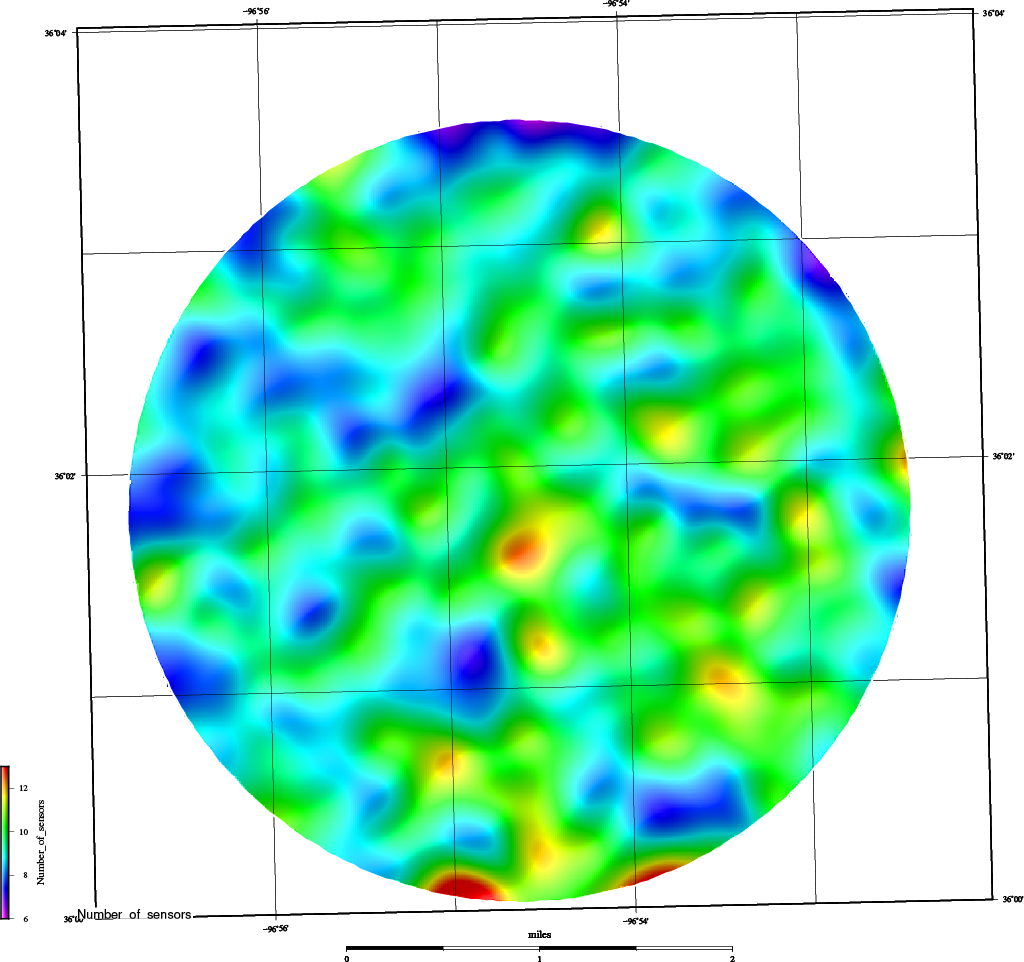
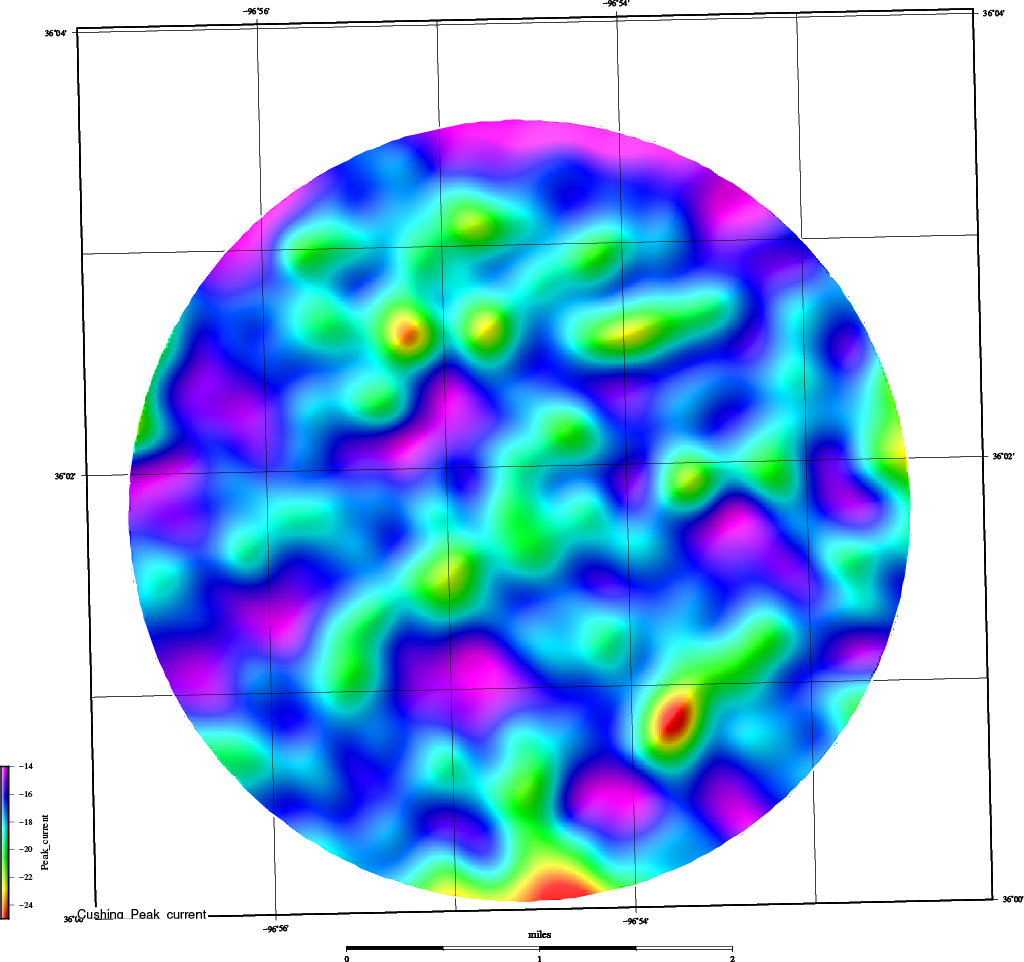
IG7 # Sensors Recording Strike | IG7 Average Peak Current |
 |  |
 |  |
 |  |
 |  |
 |  |
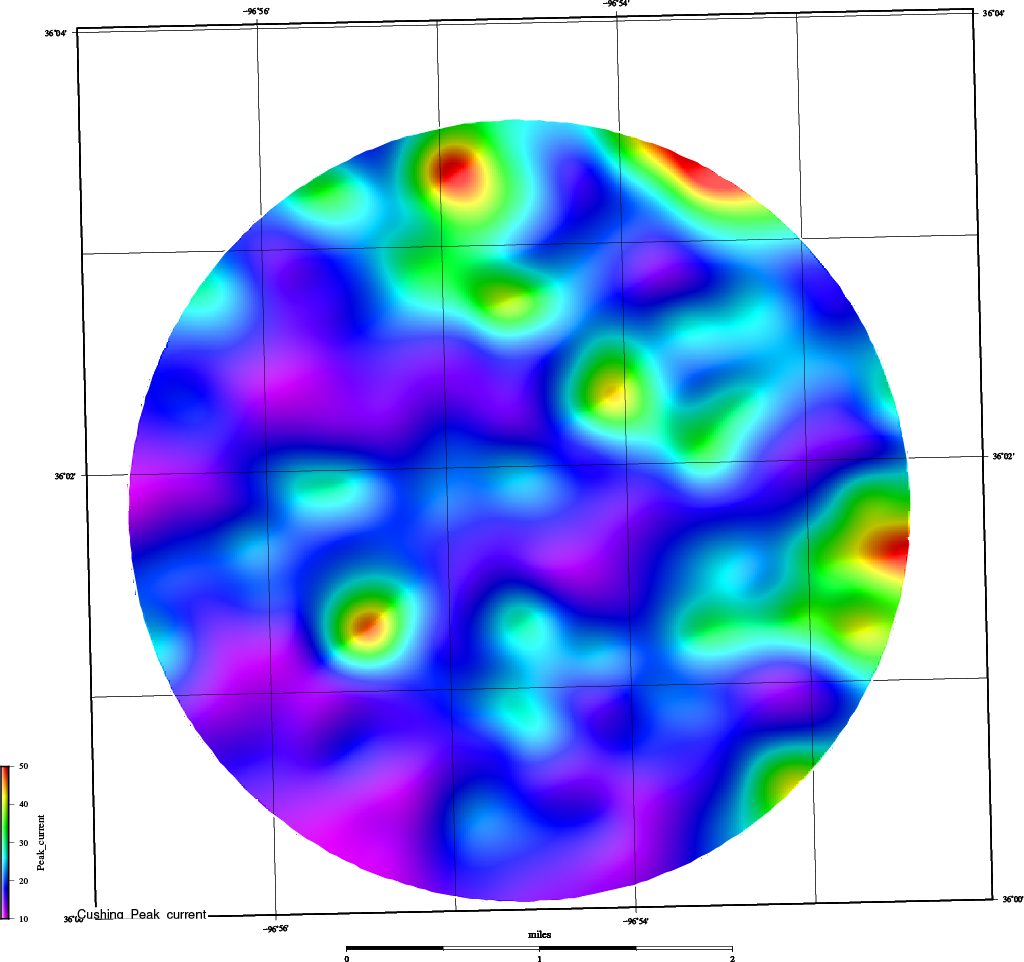
| IG7 Negative Peak Current | IG7 Positive Peak Current |
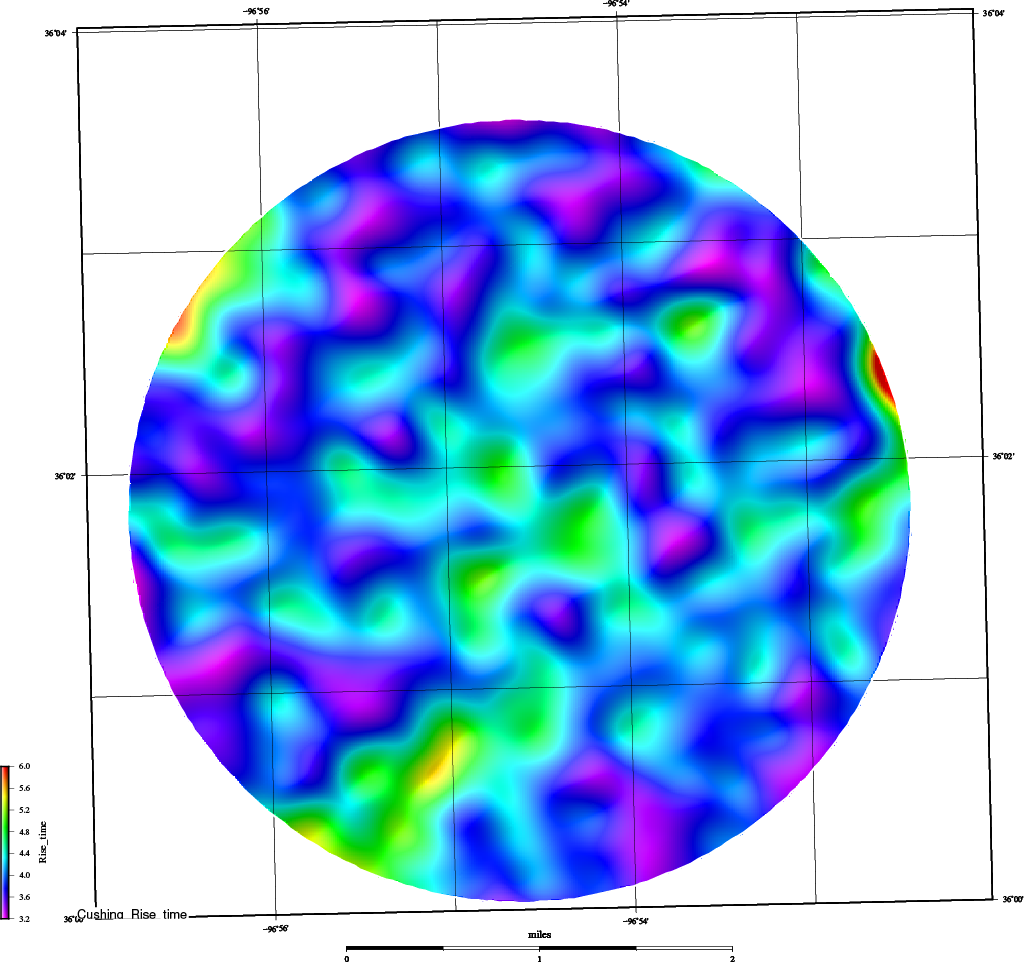
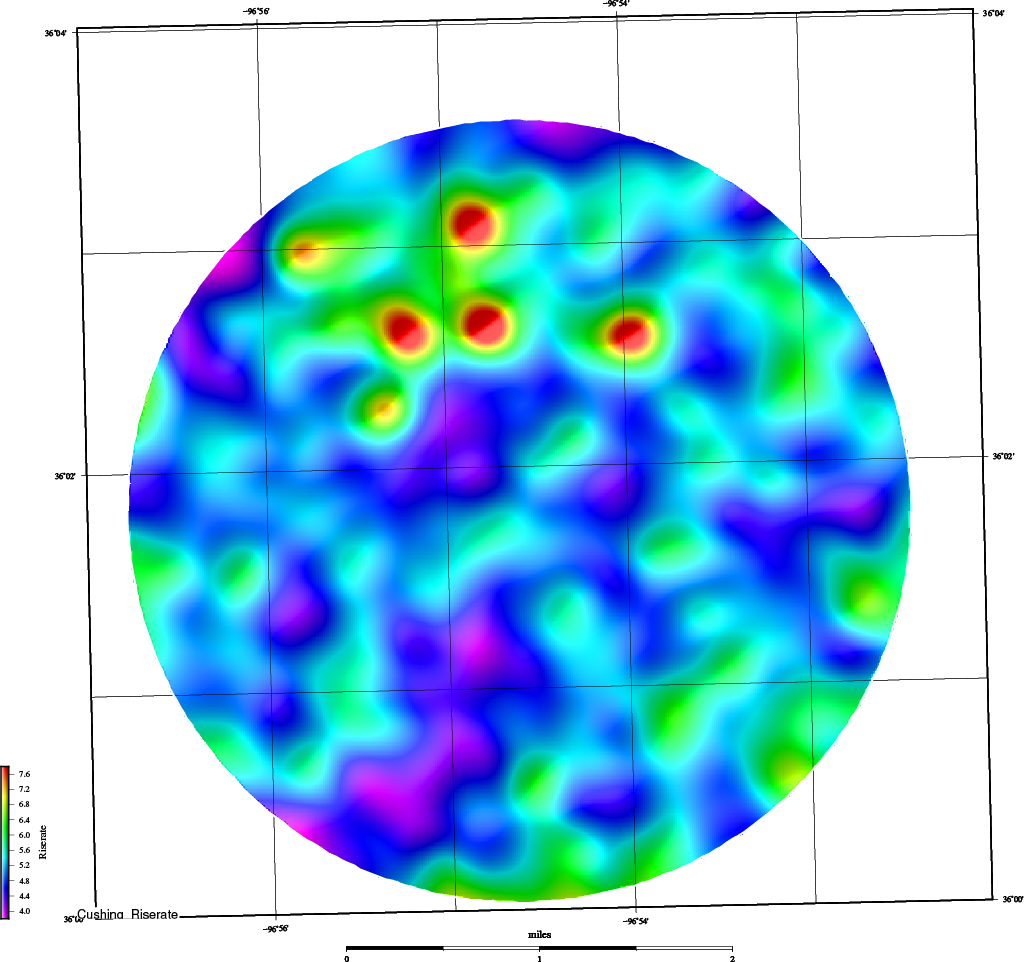
IG7 Rise-Time of Each Strike | IG7 Rate of Rise-Time of Strike |
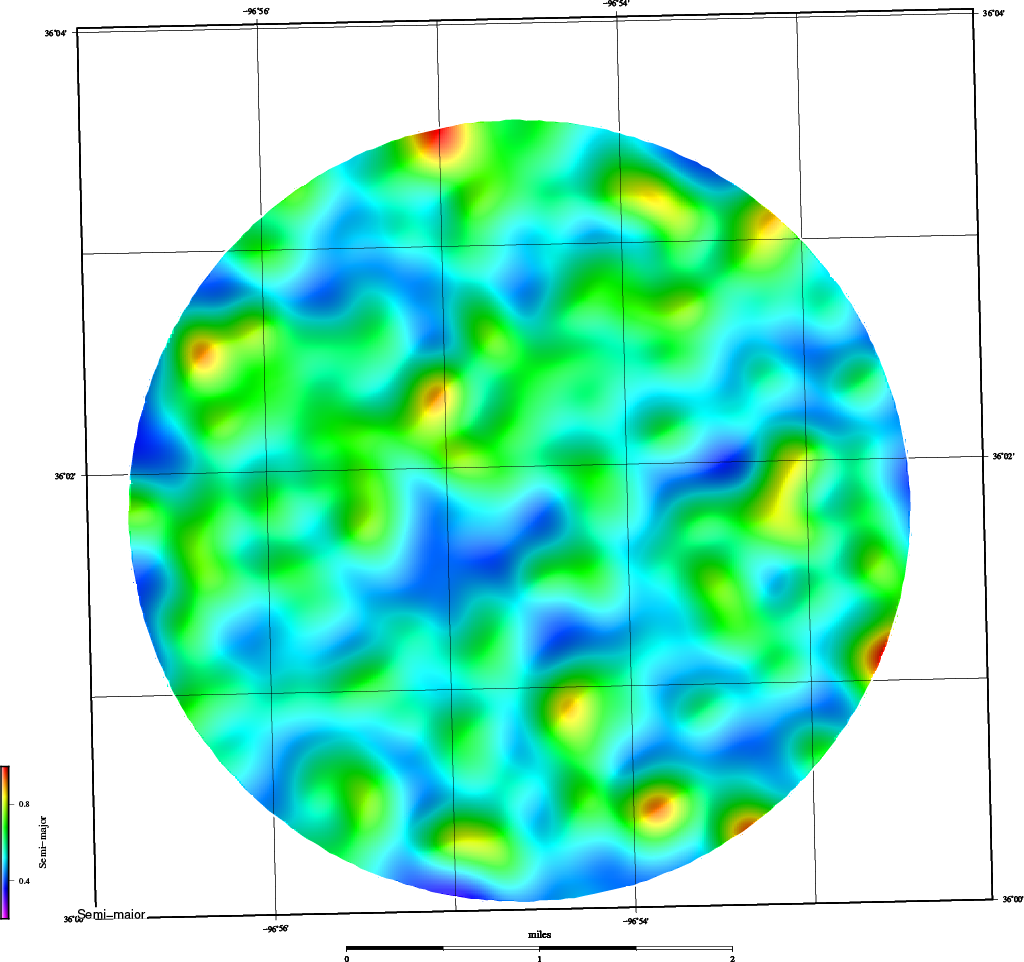
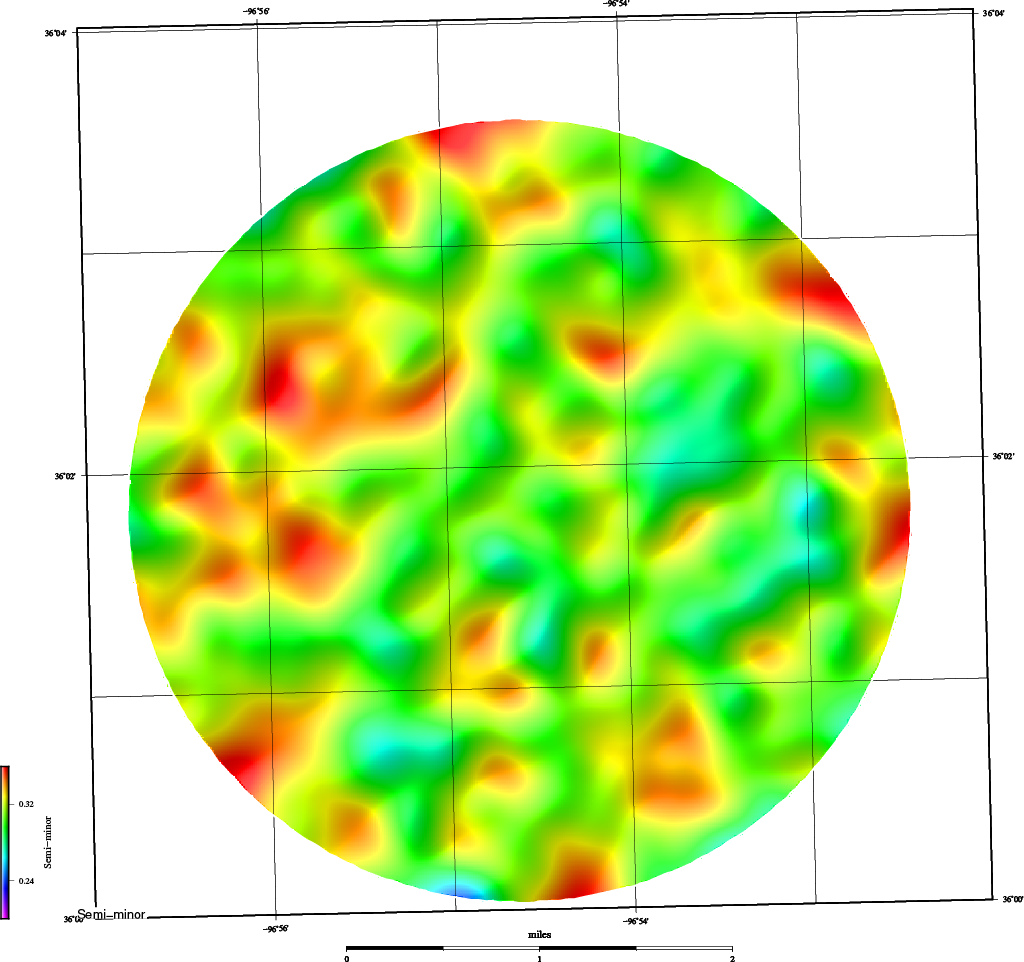
IG7 Interpolation Semi-Major Axis | IG7 Interpolation Semi-Minor Axis |
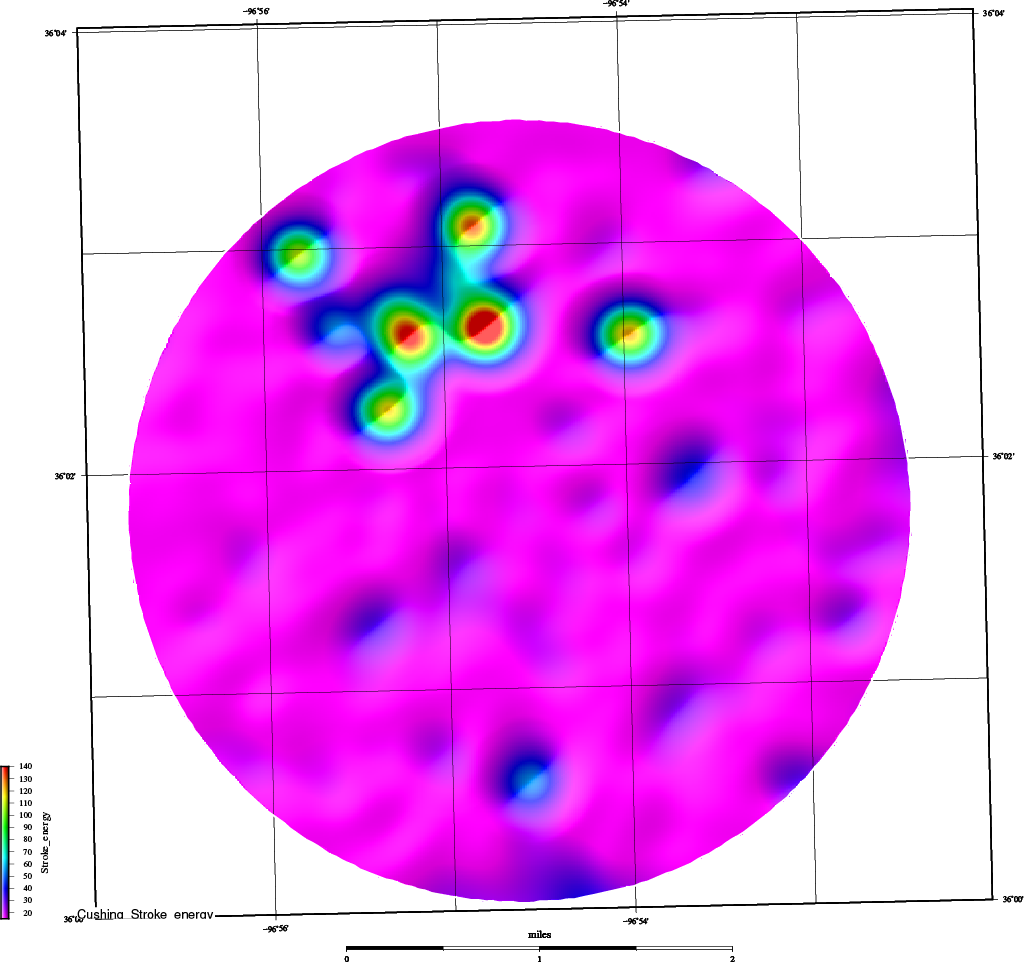
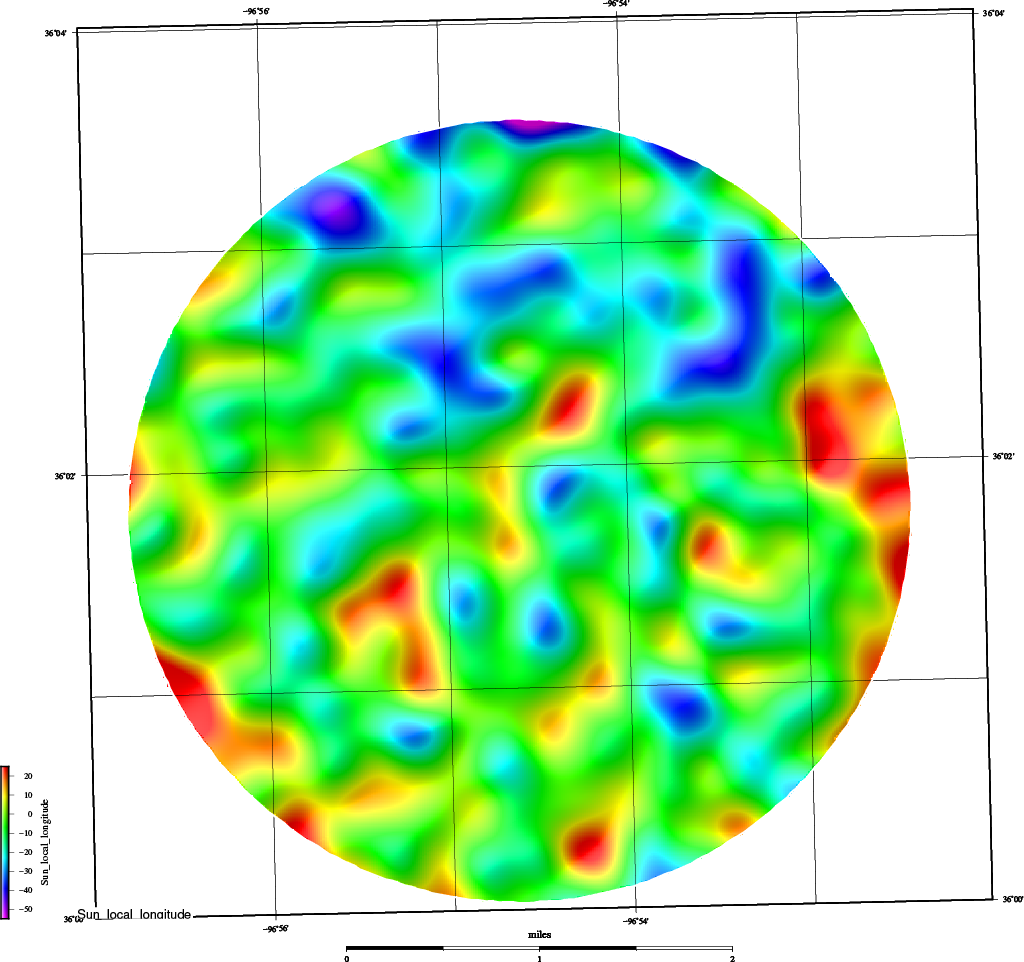
IG7 Total Stroke Energy | IG7 Sun Local Longitude |
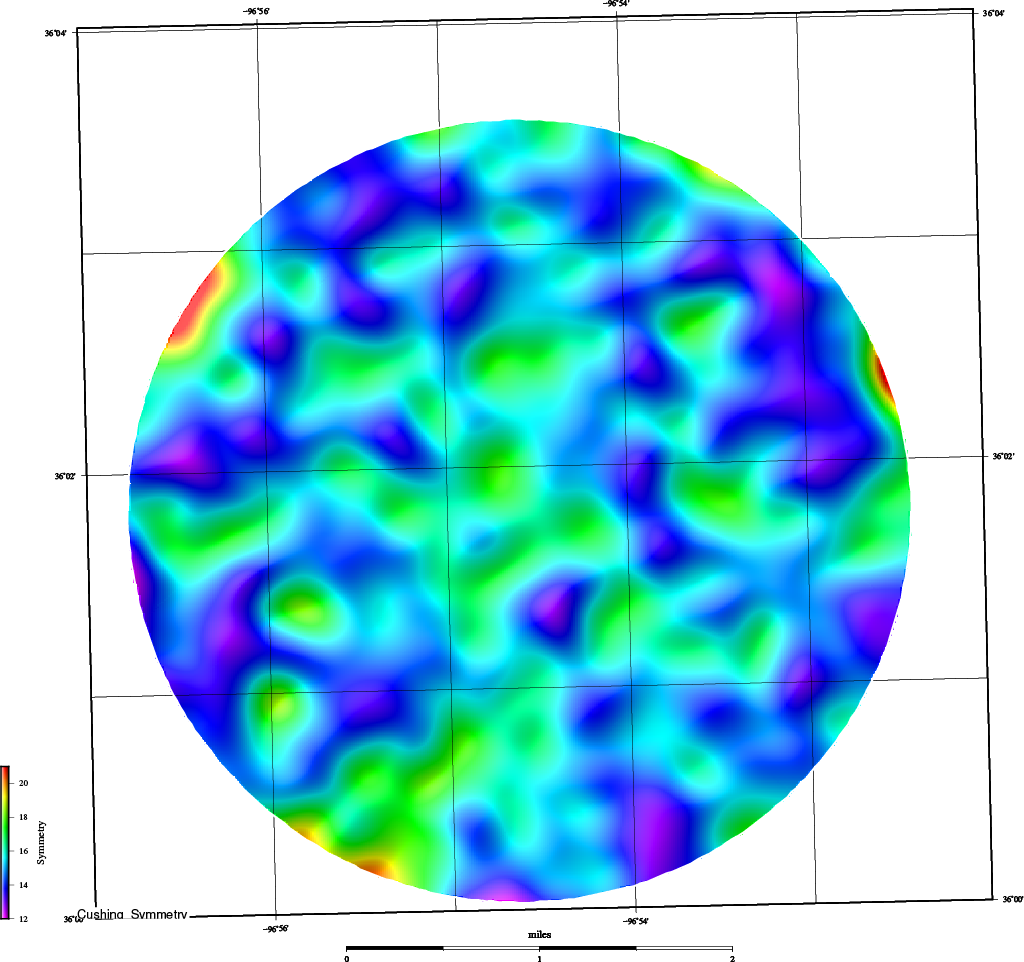
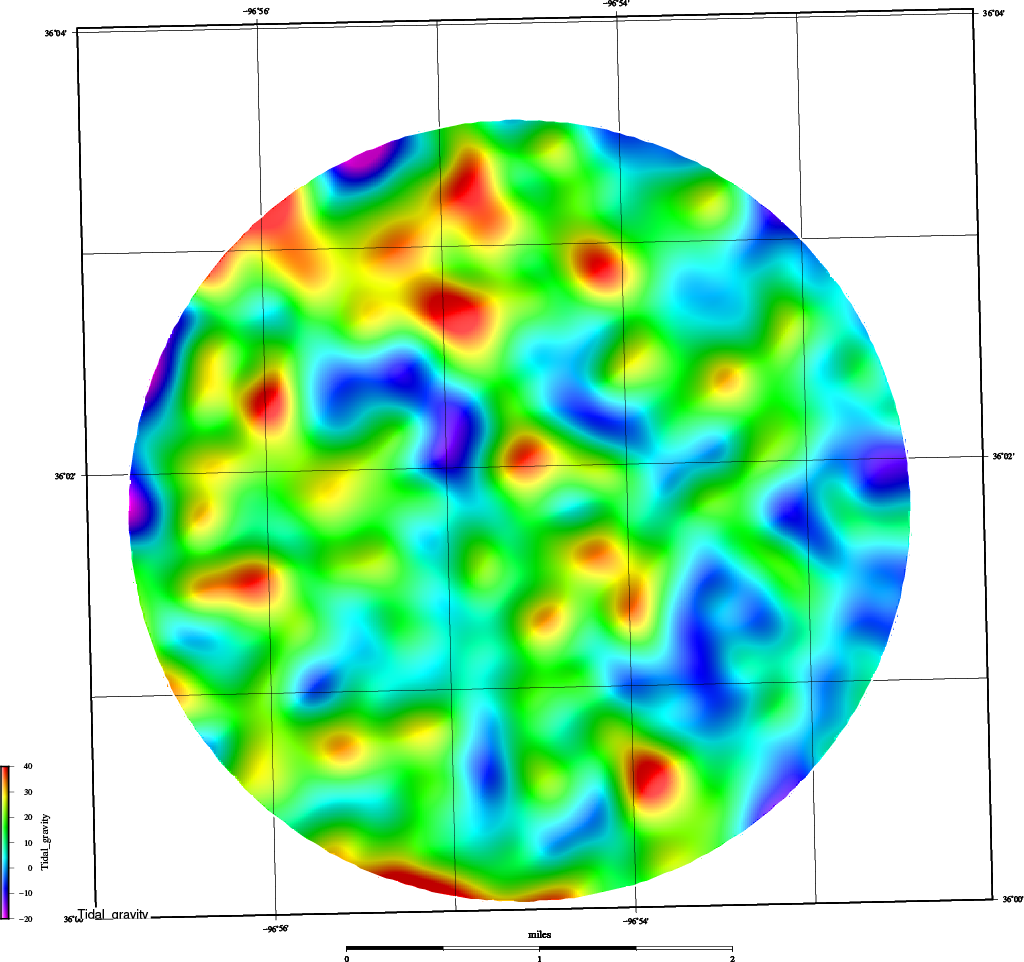
IG7 Wavelet Symmetry | IG7 # Tidal Gravity (at stroke) |
 |  |
 |  |
 |  |
 |  |
 |  |
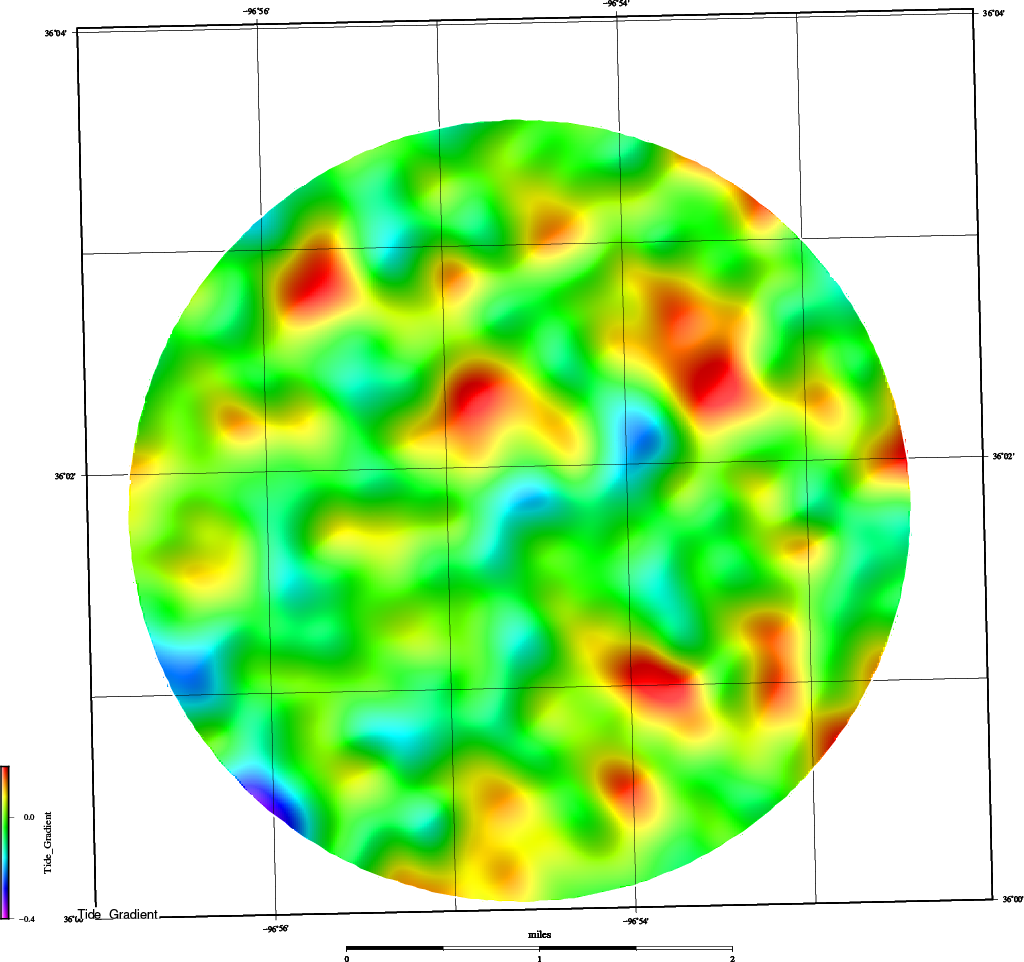
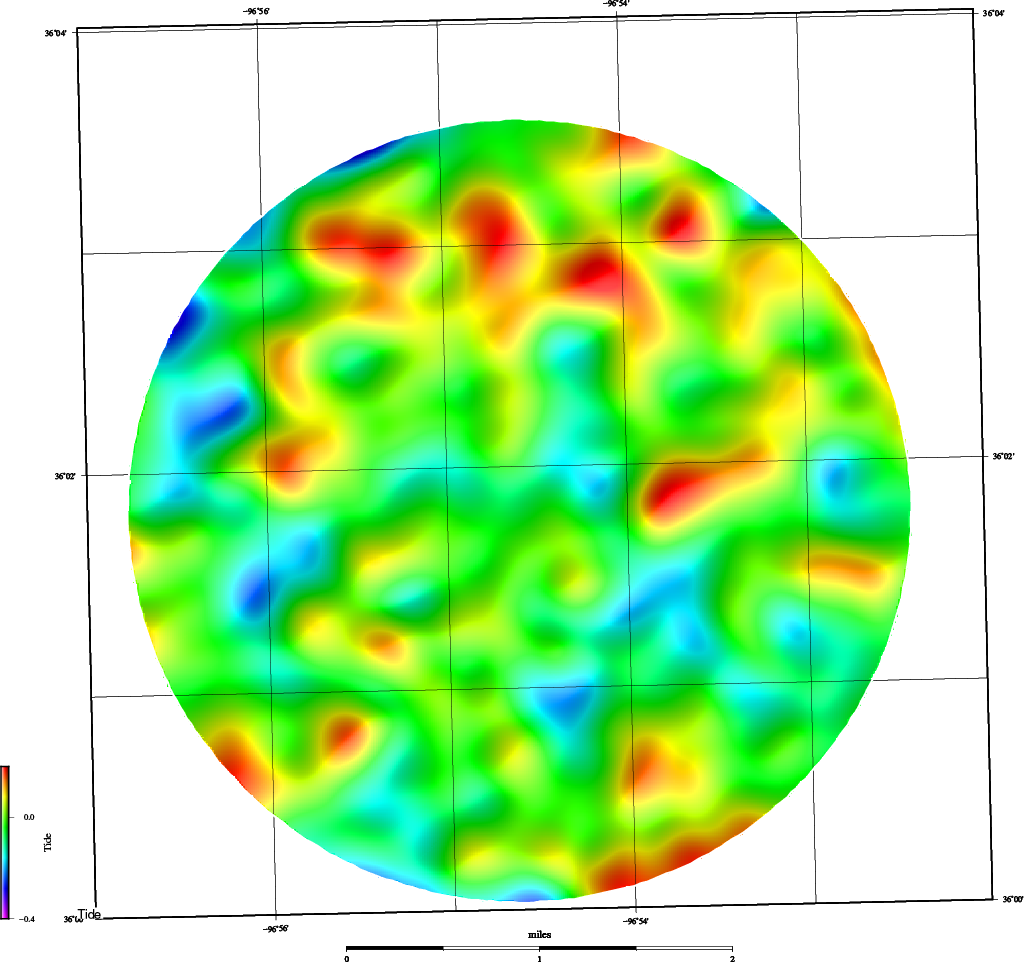
| IG7 Tide Gradient (at stroke) | IG7 Tide when Stroke Occurred |
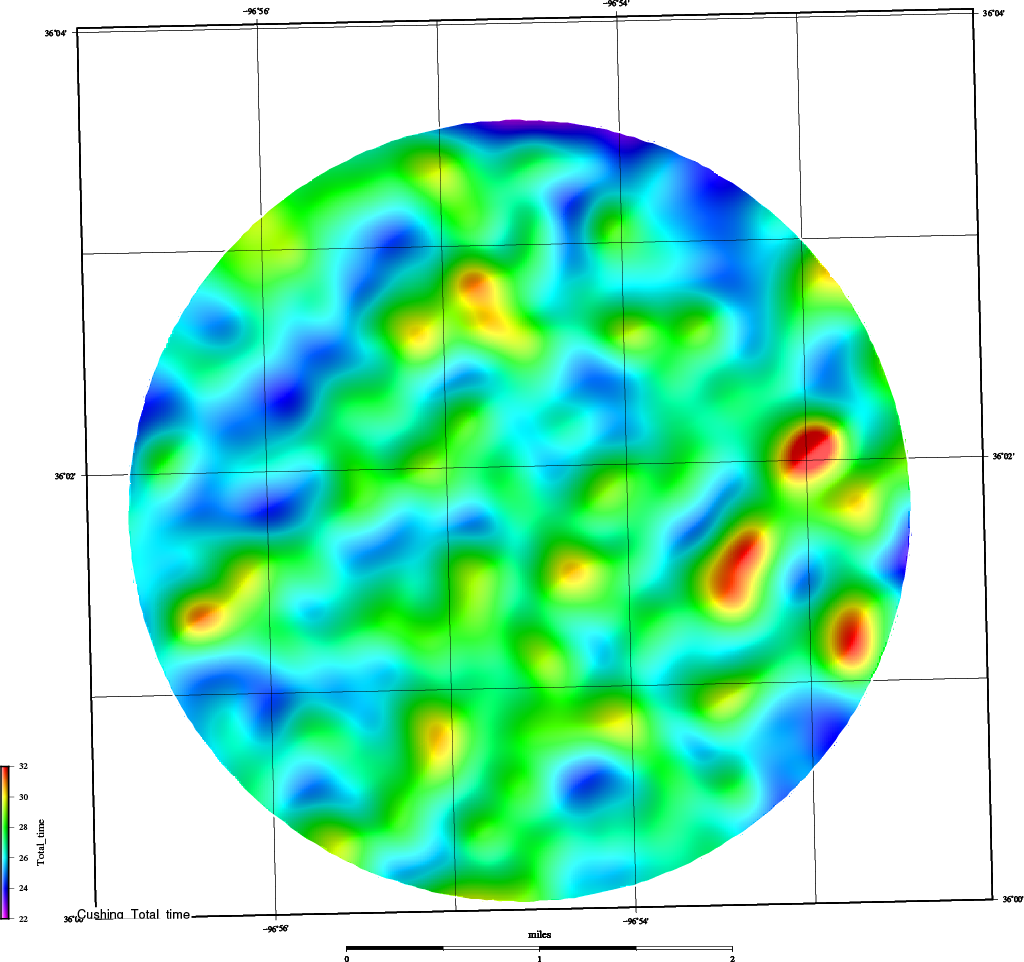
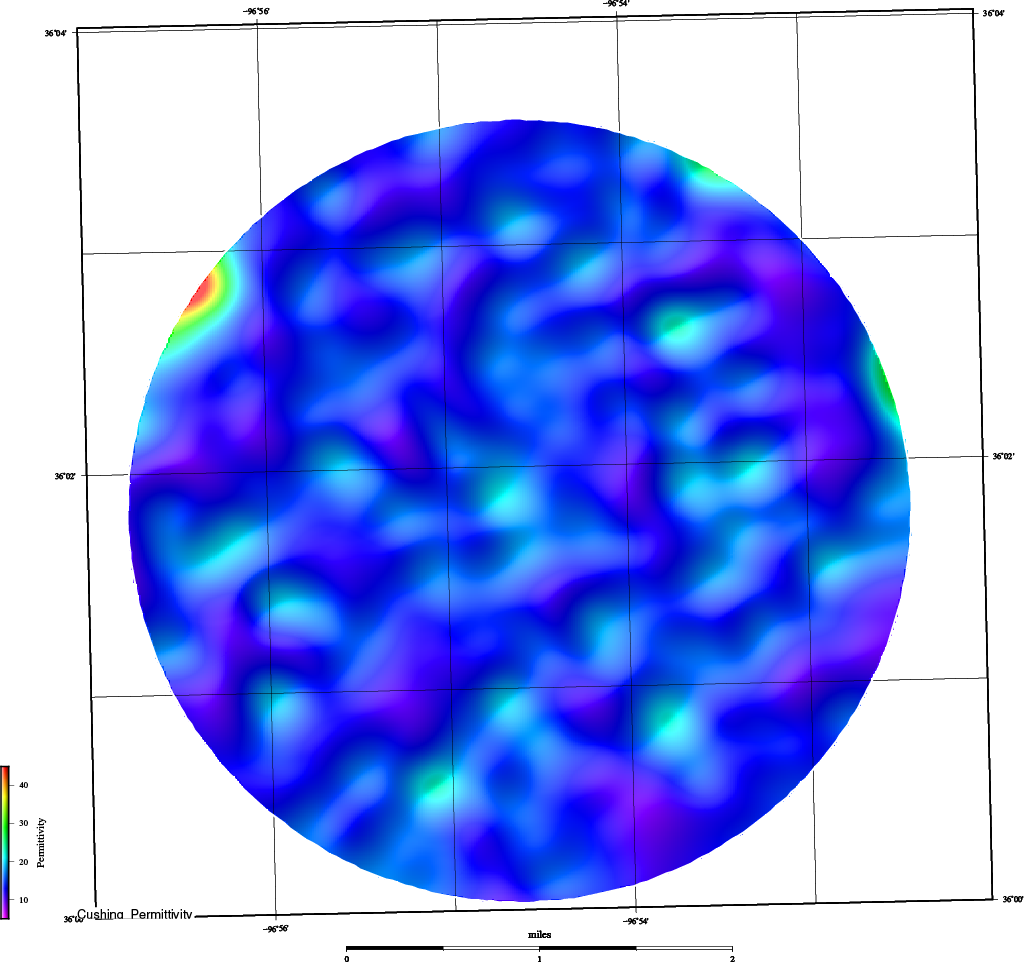
IG7 Total Wavelet Time of Strike | IG7 Permittivity 20+ Years |
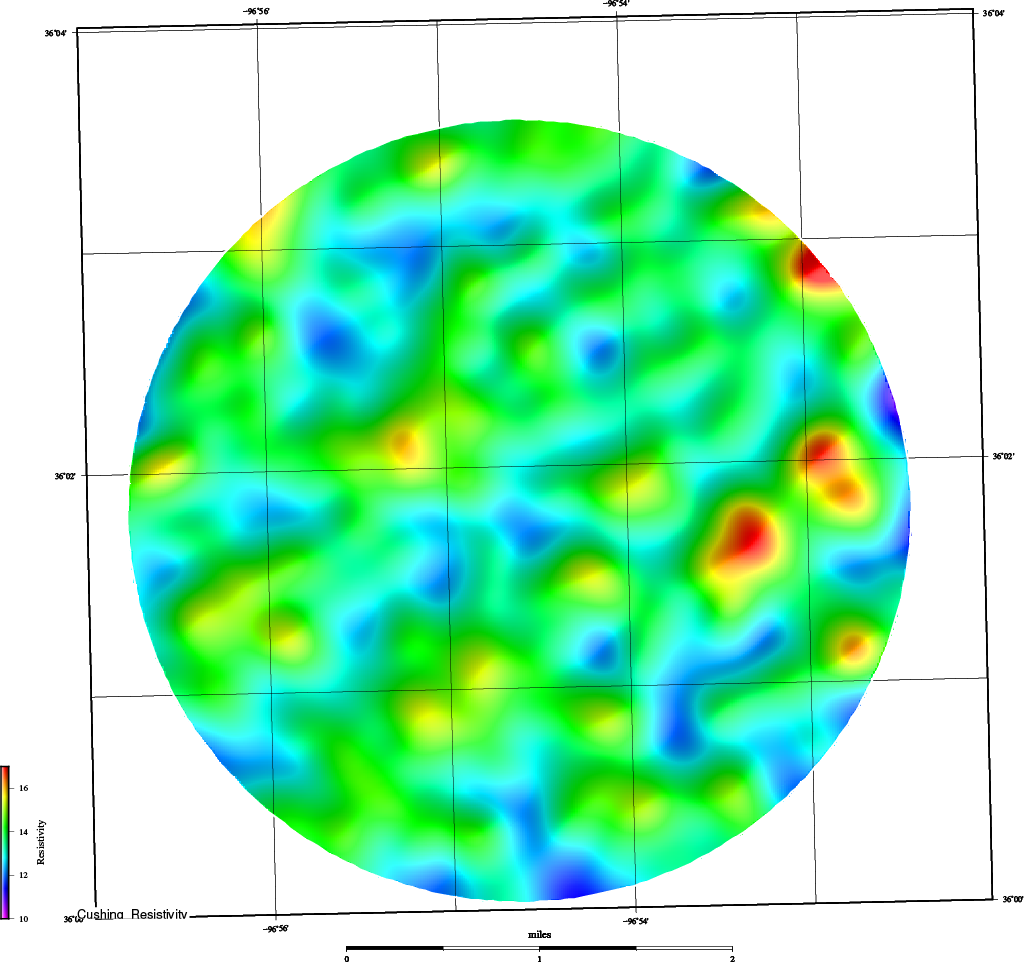
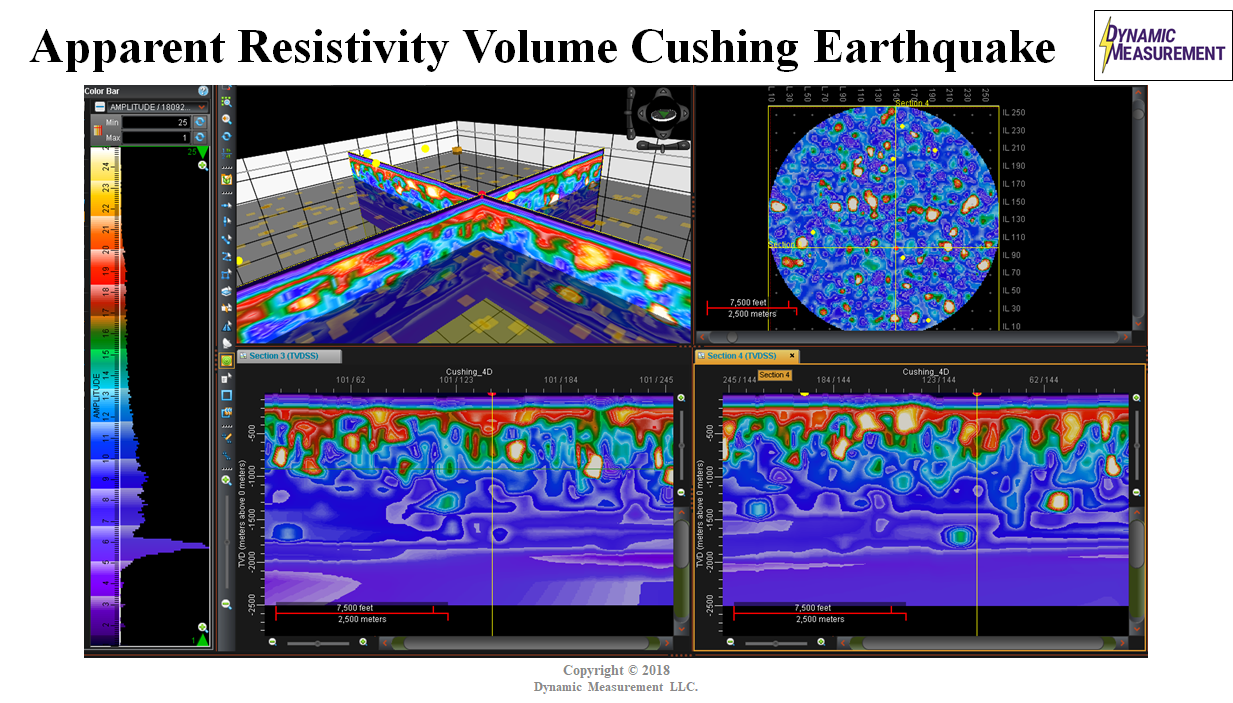
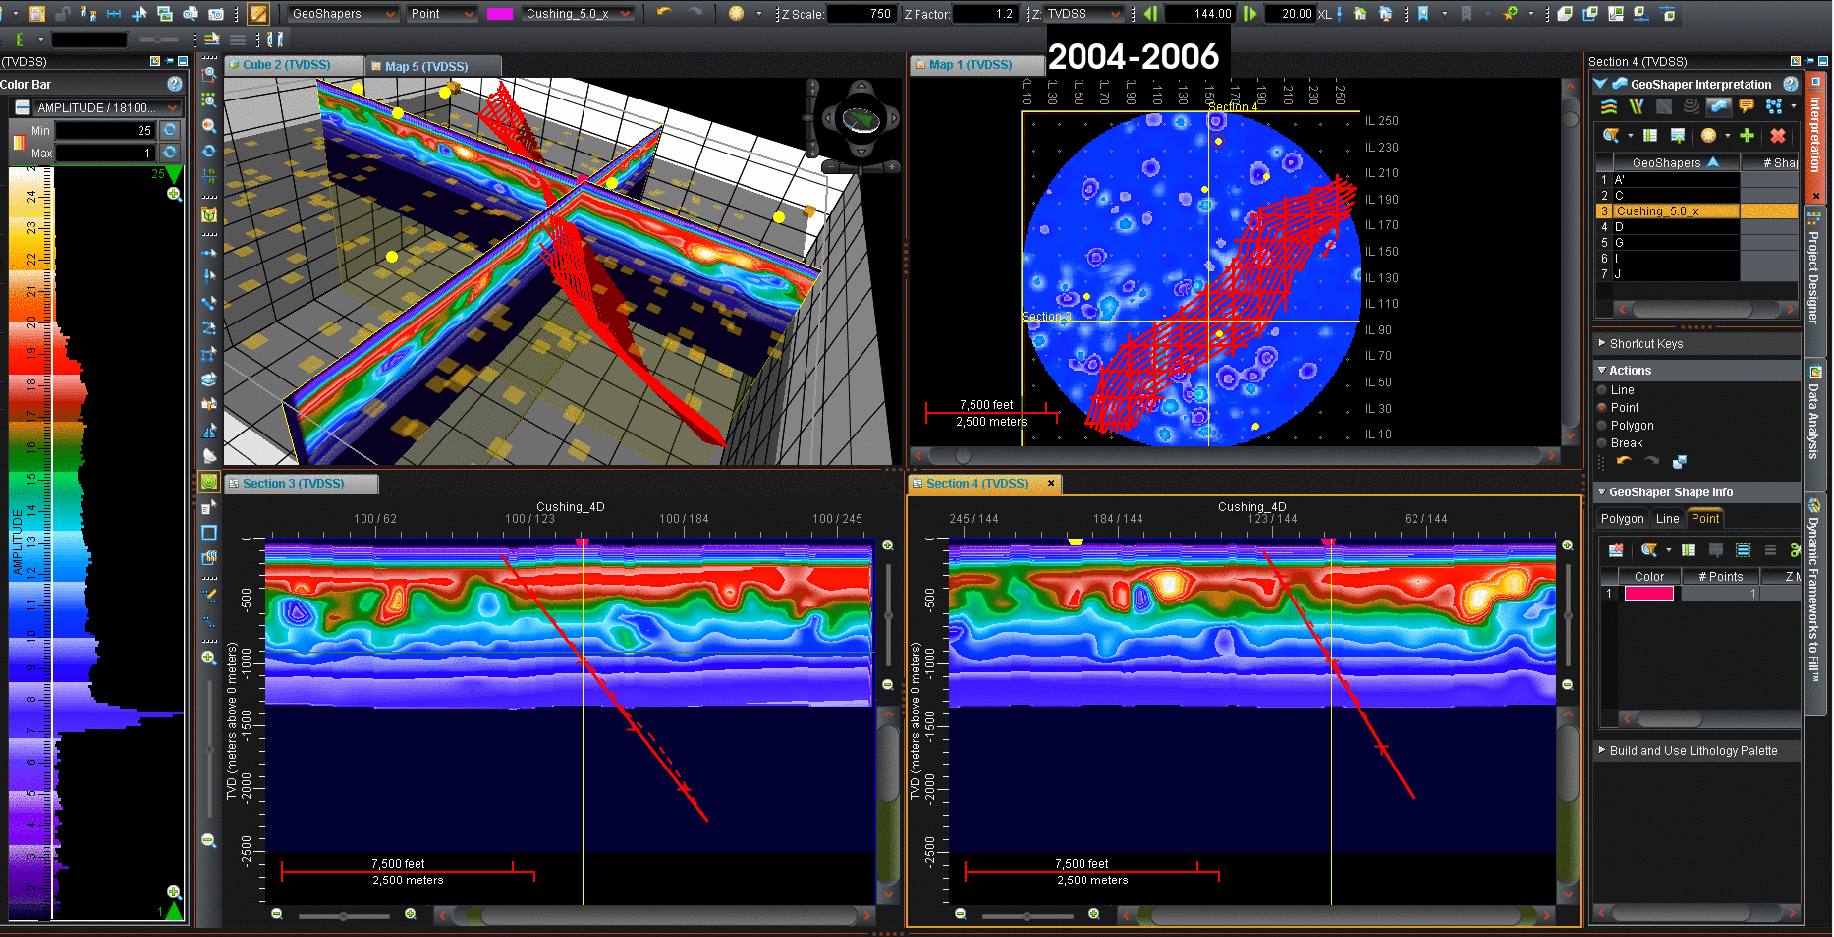
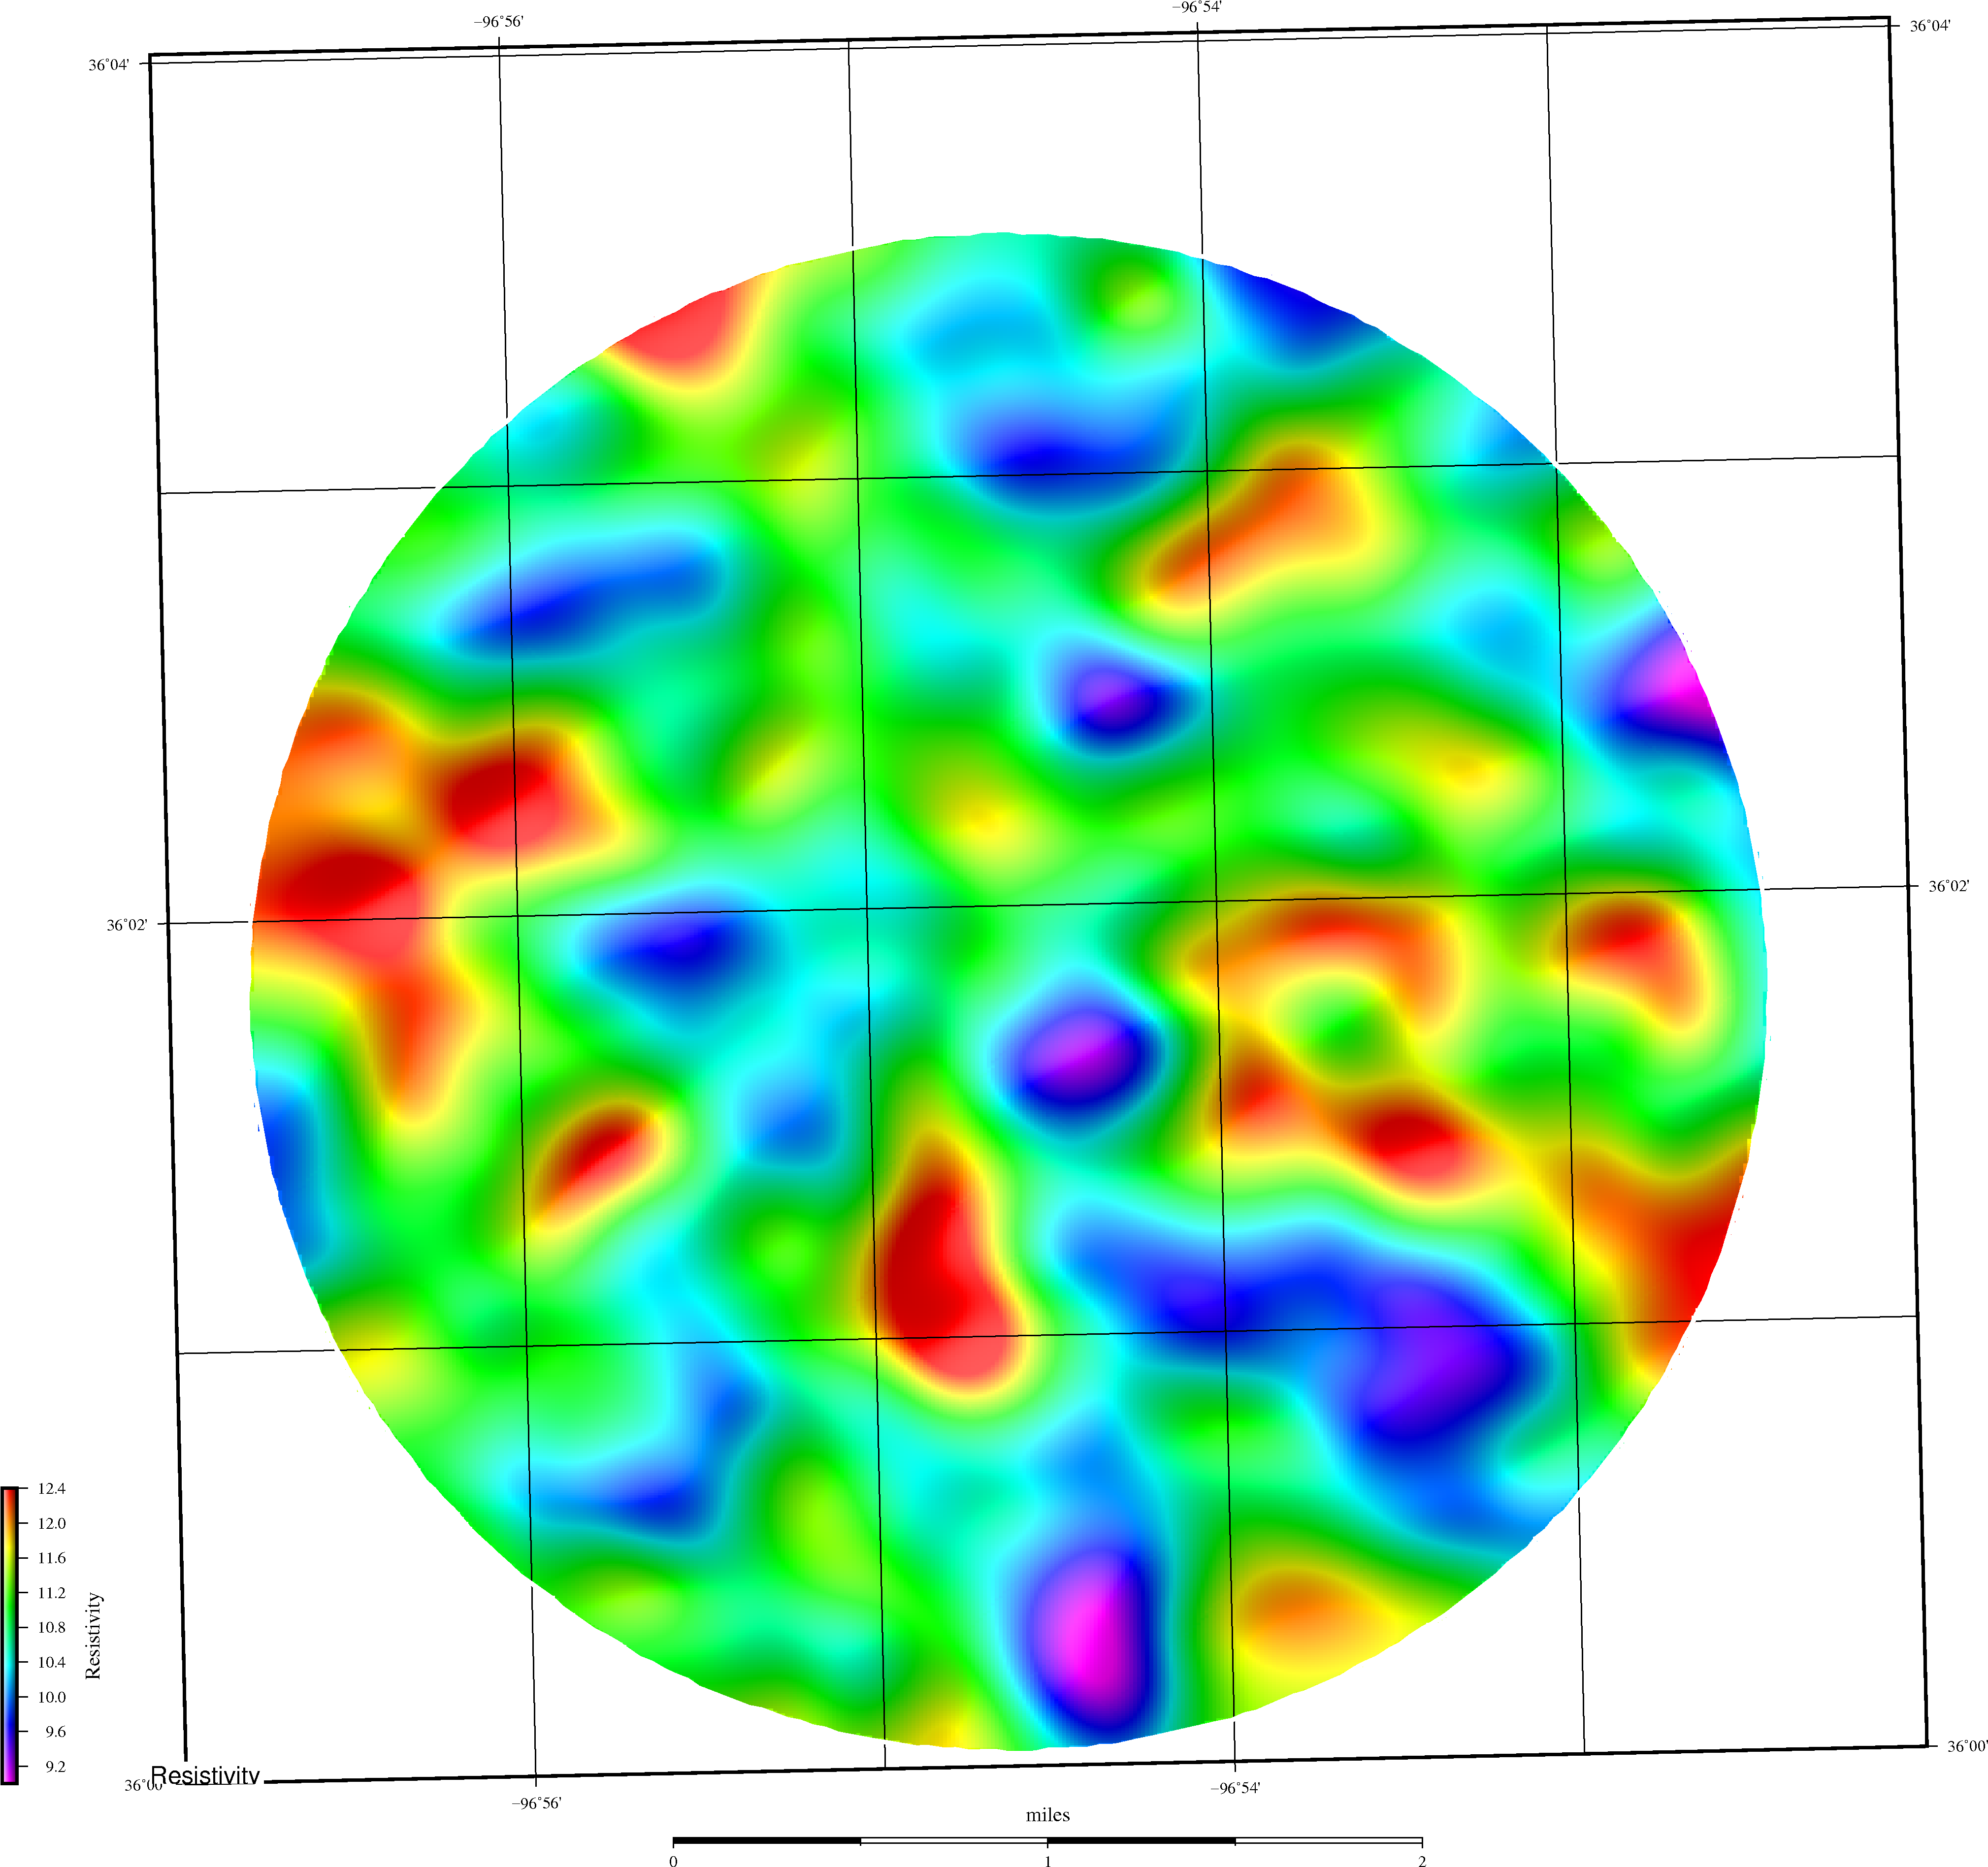
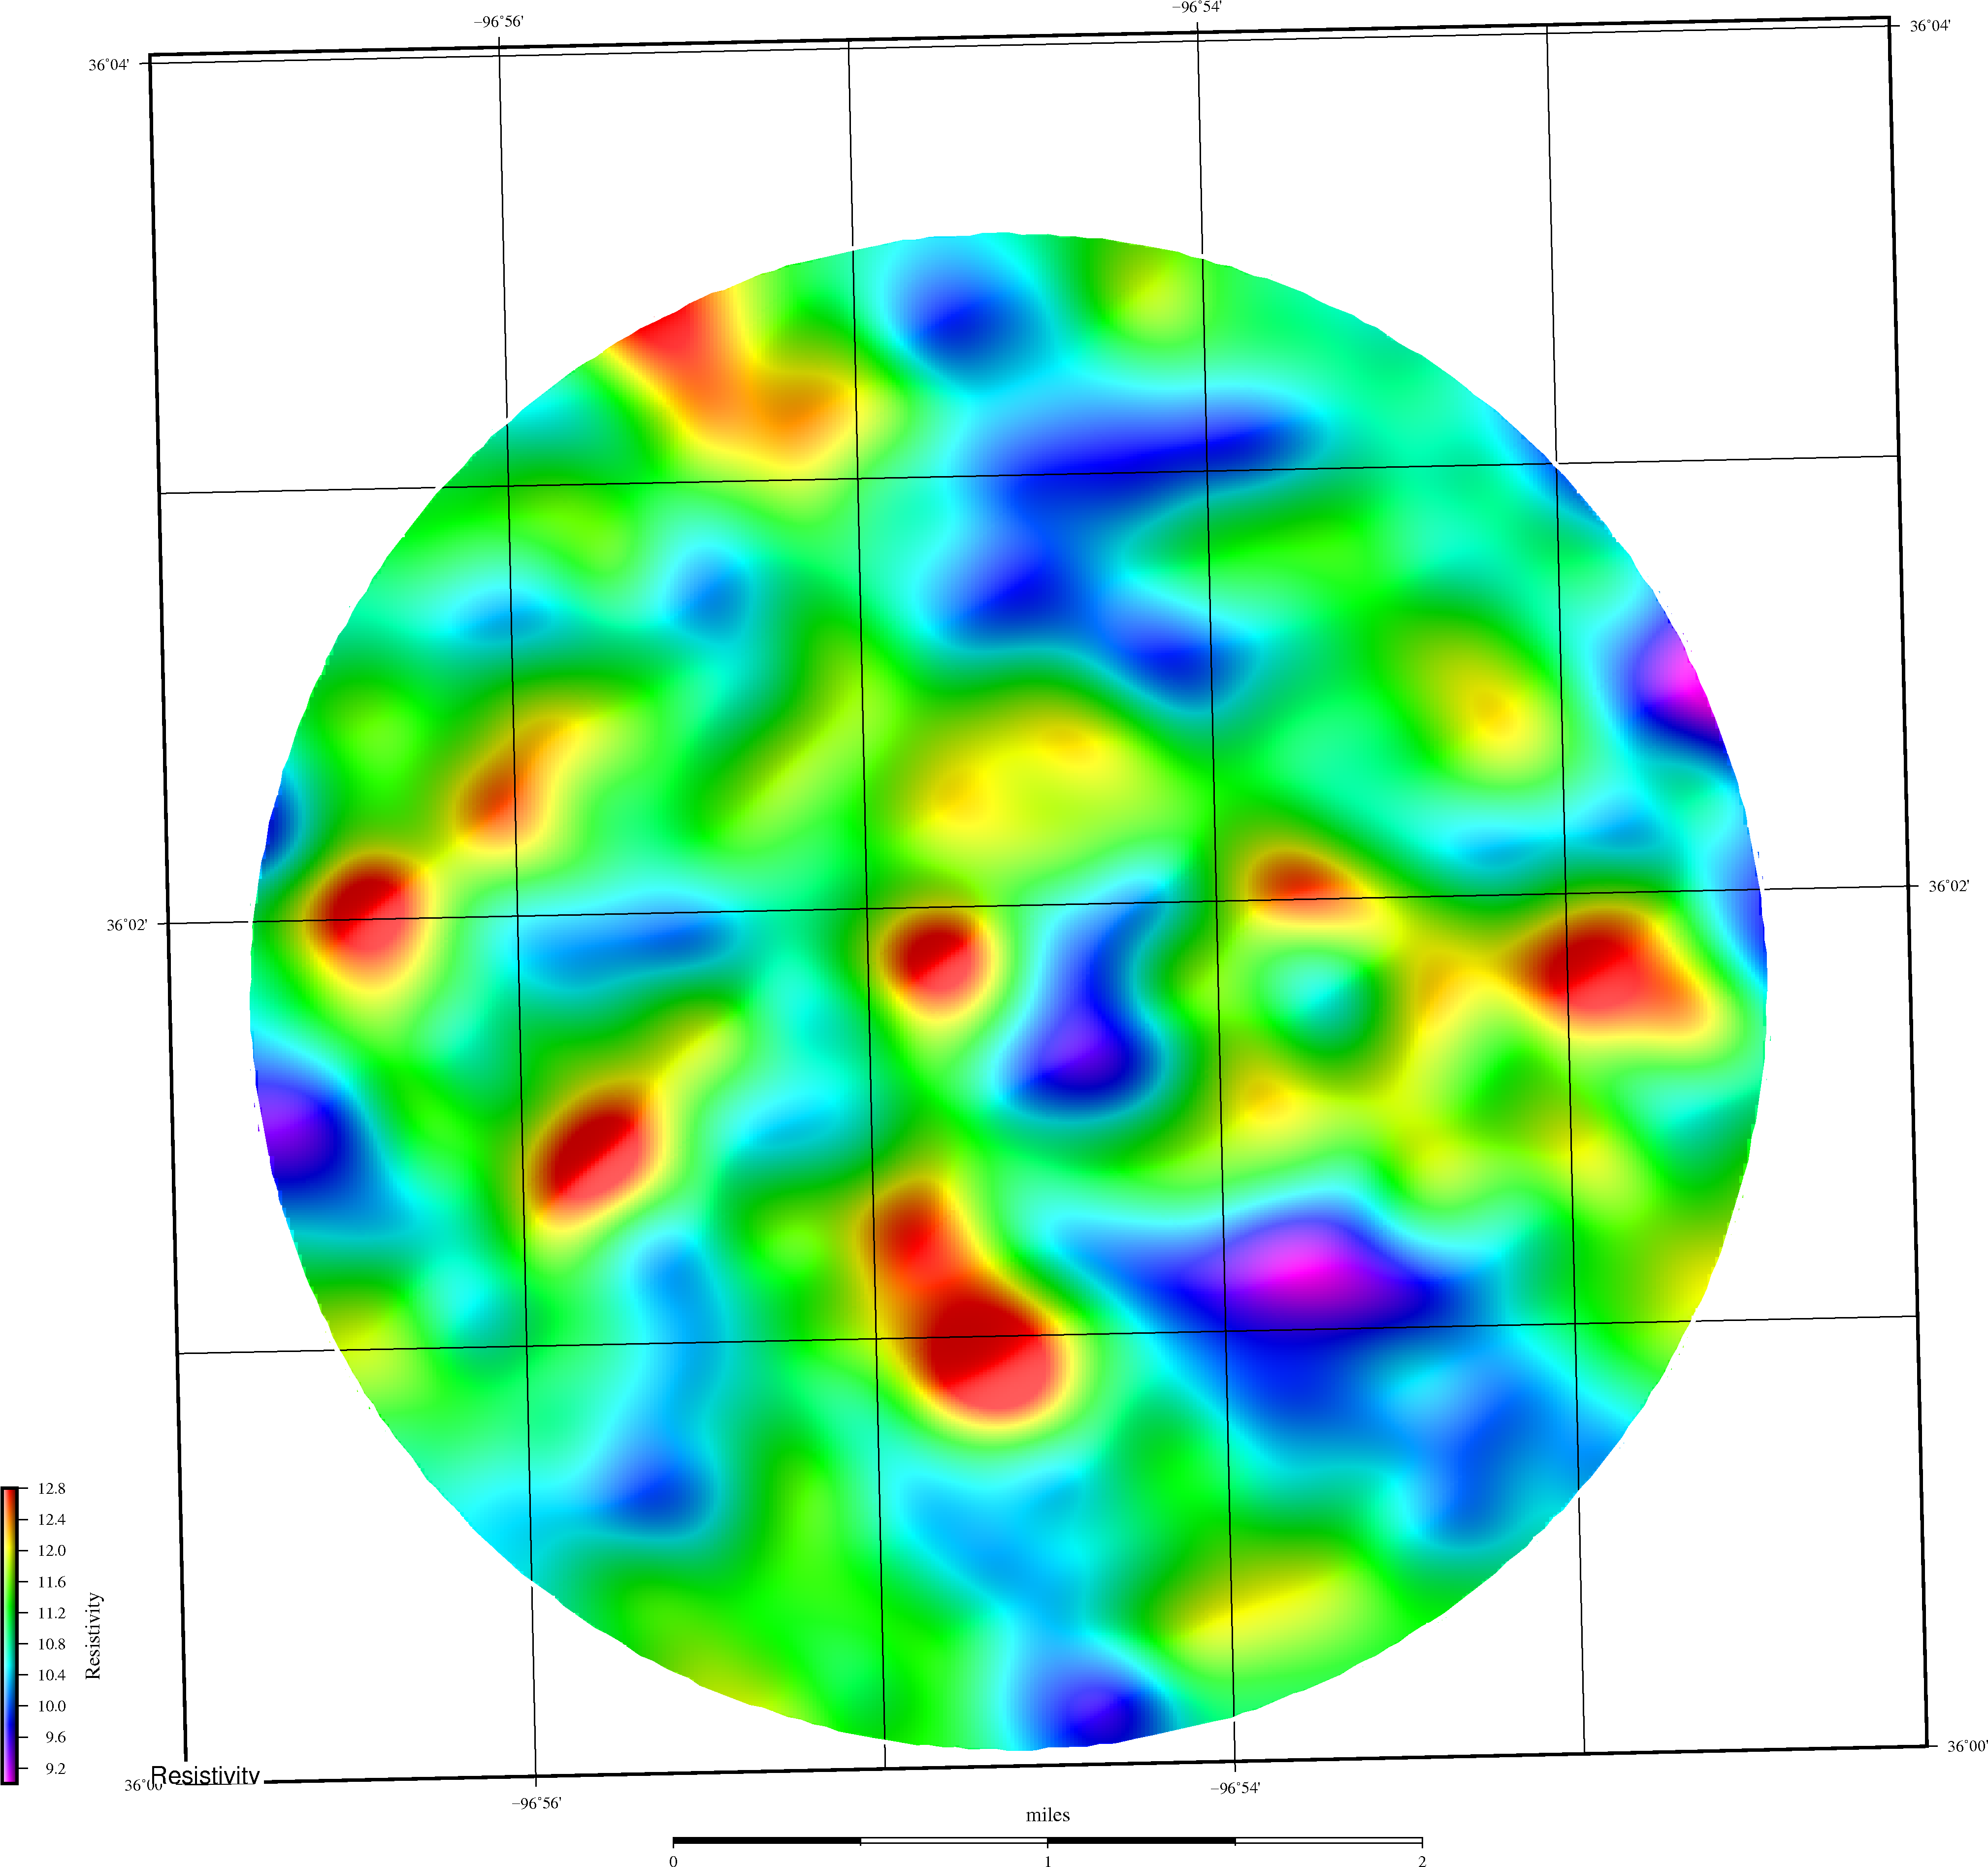
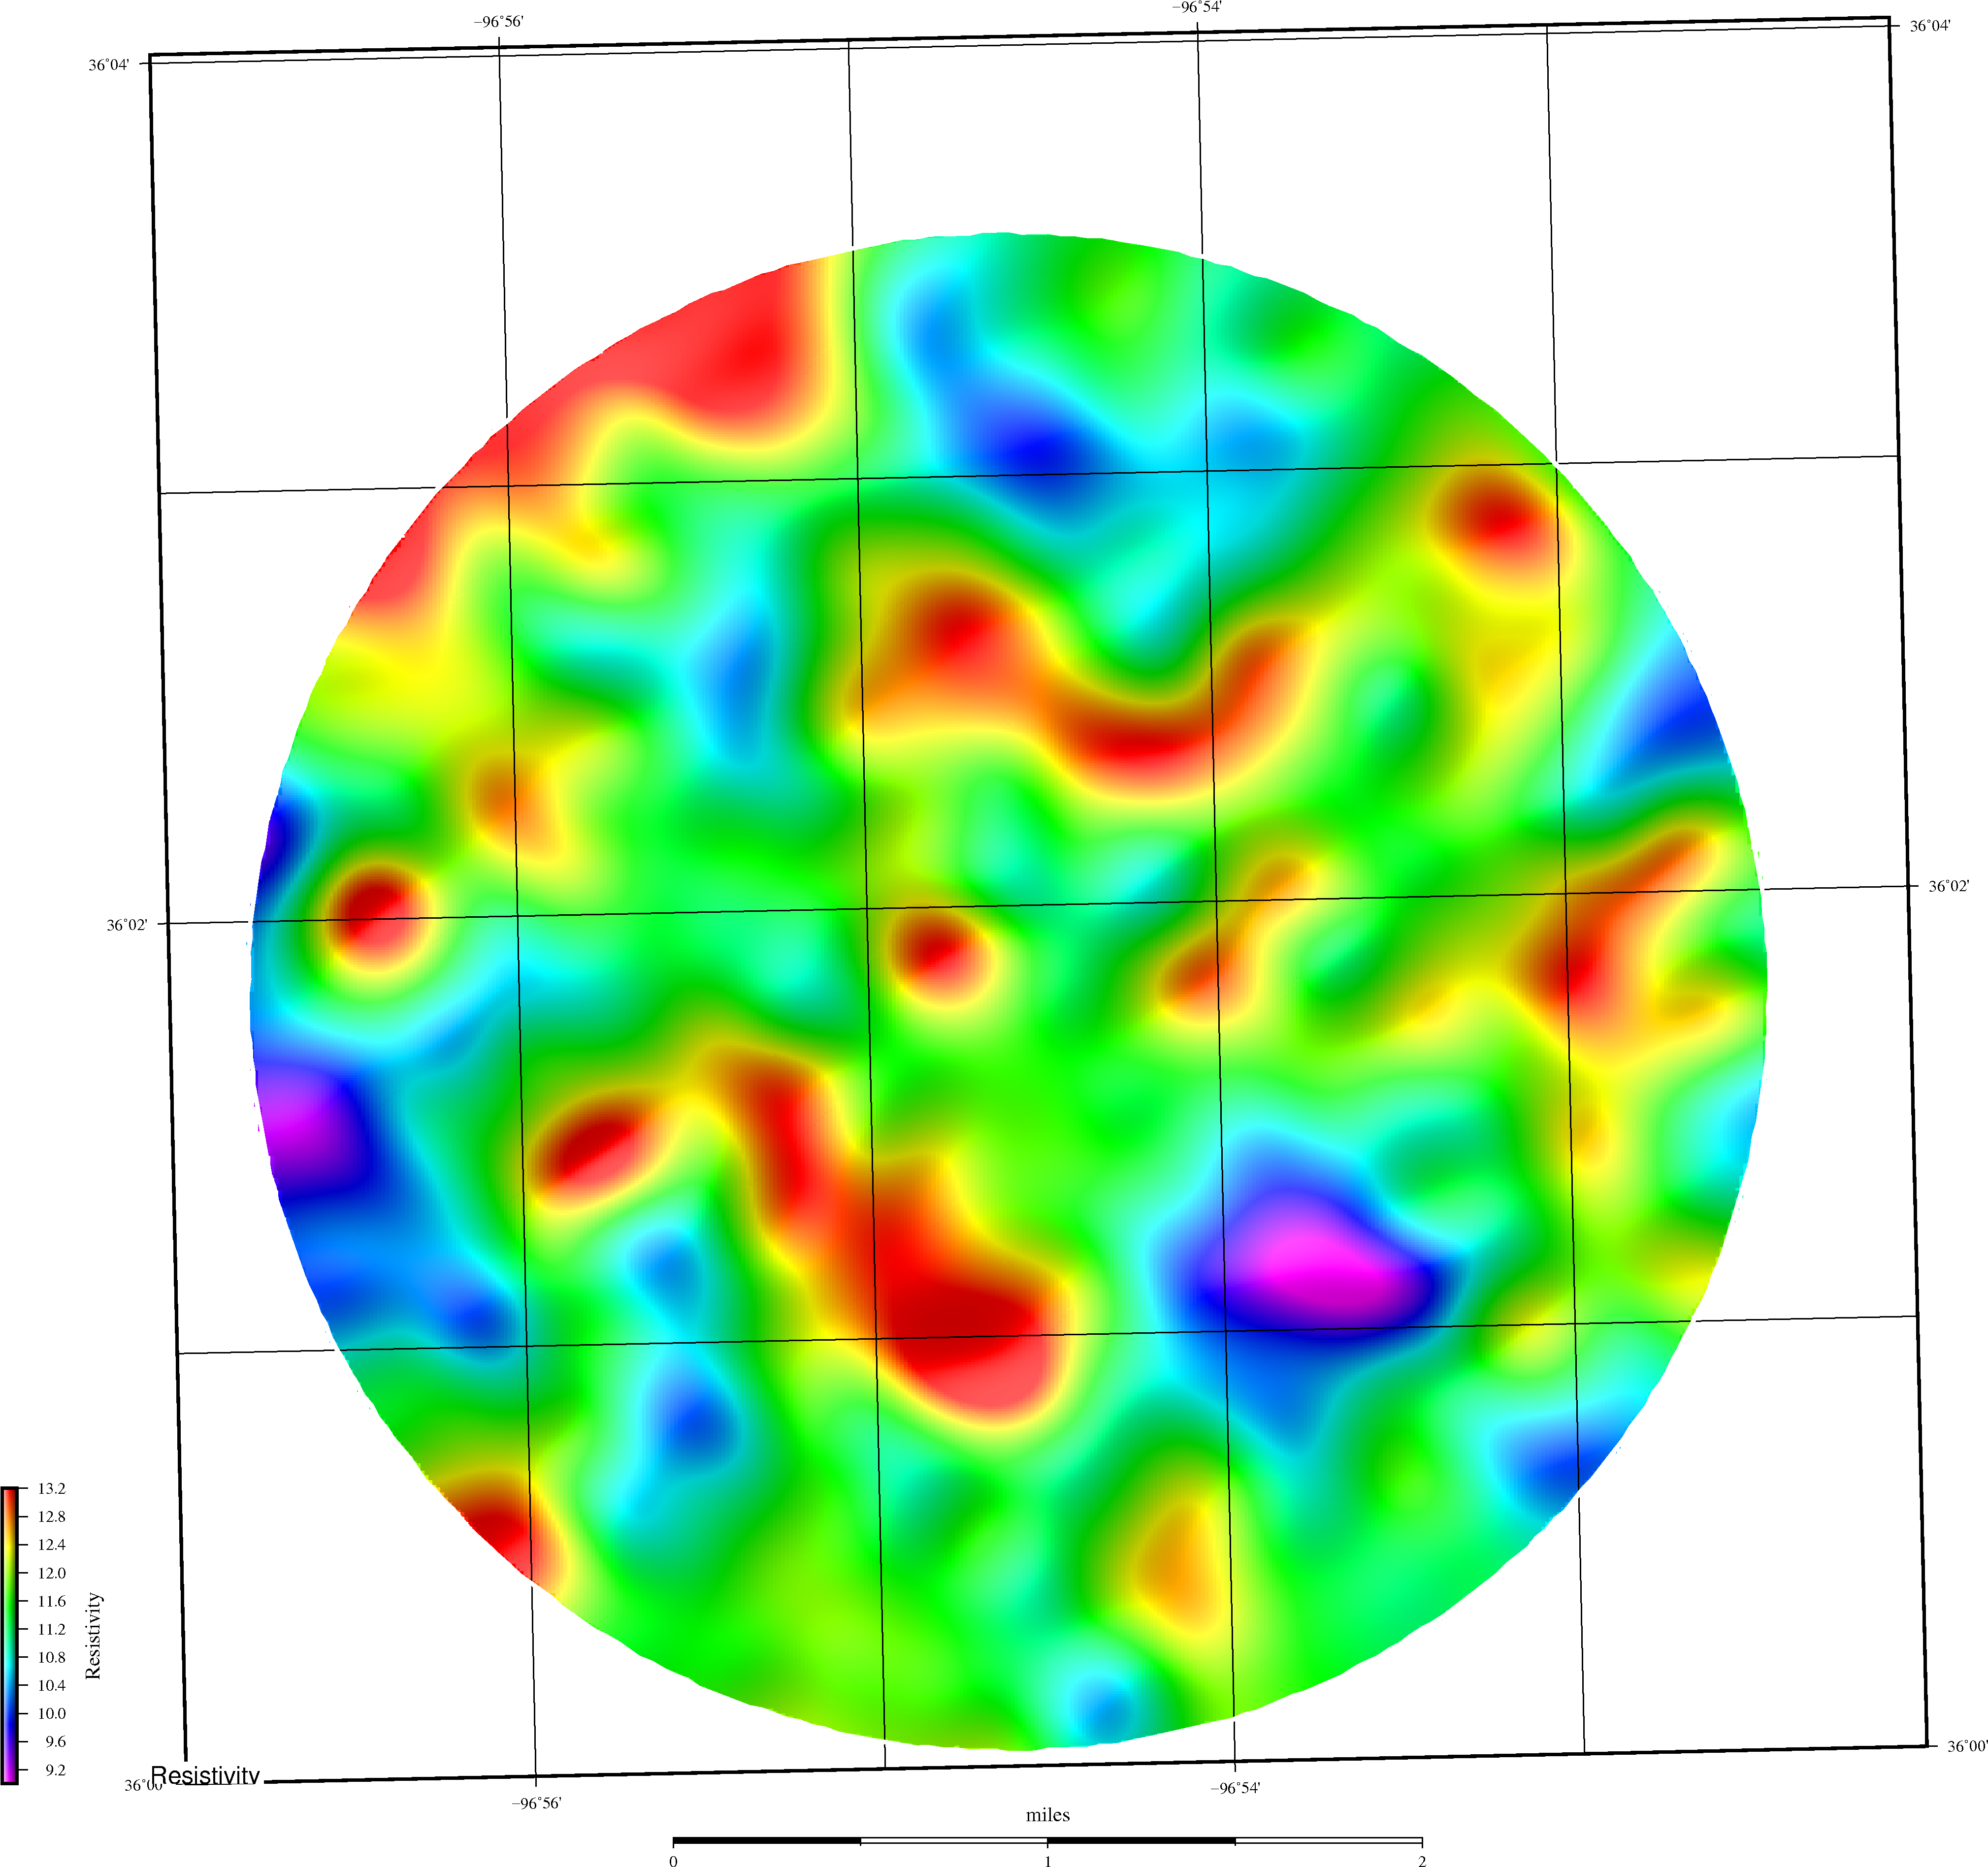
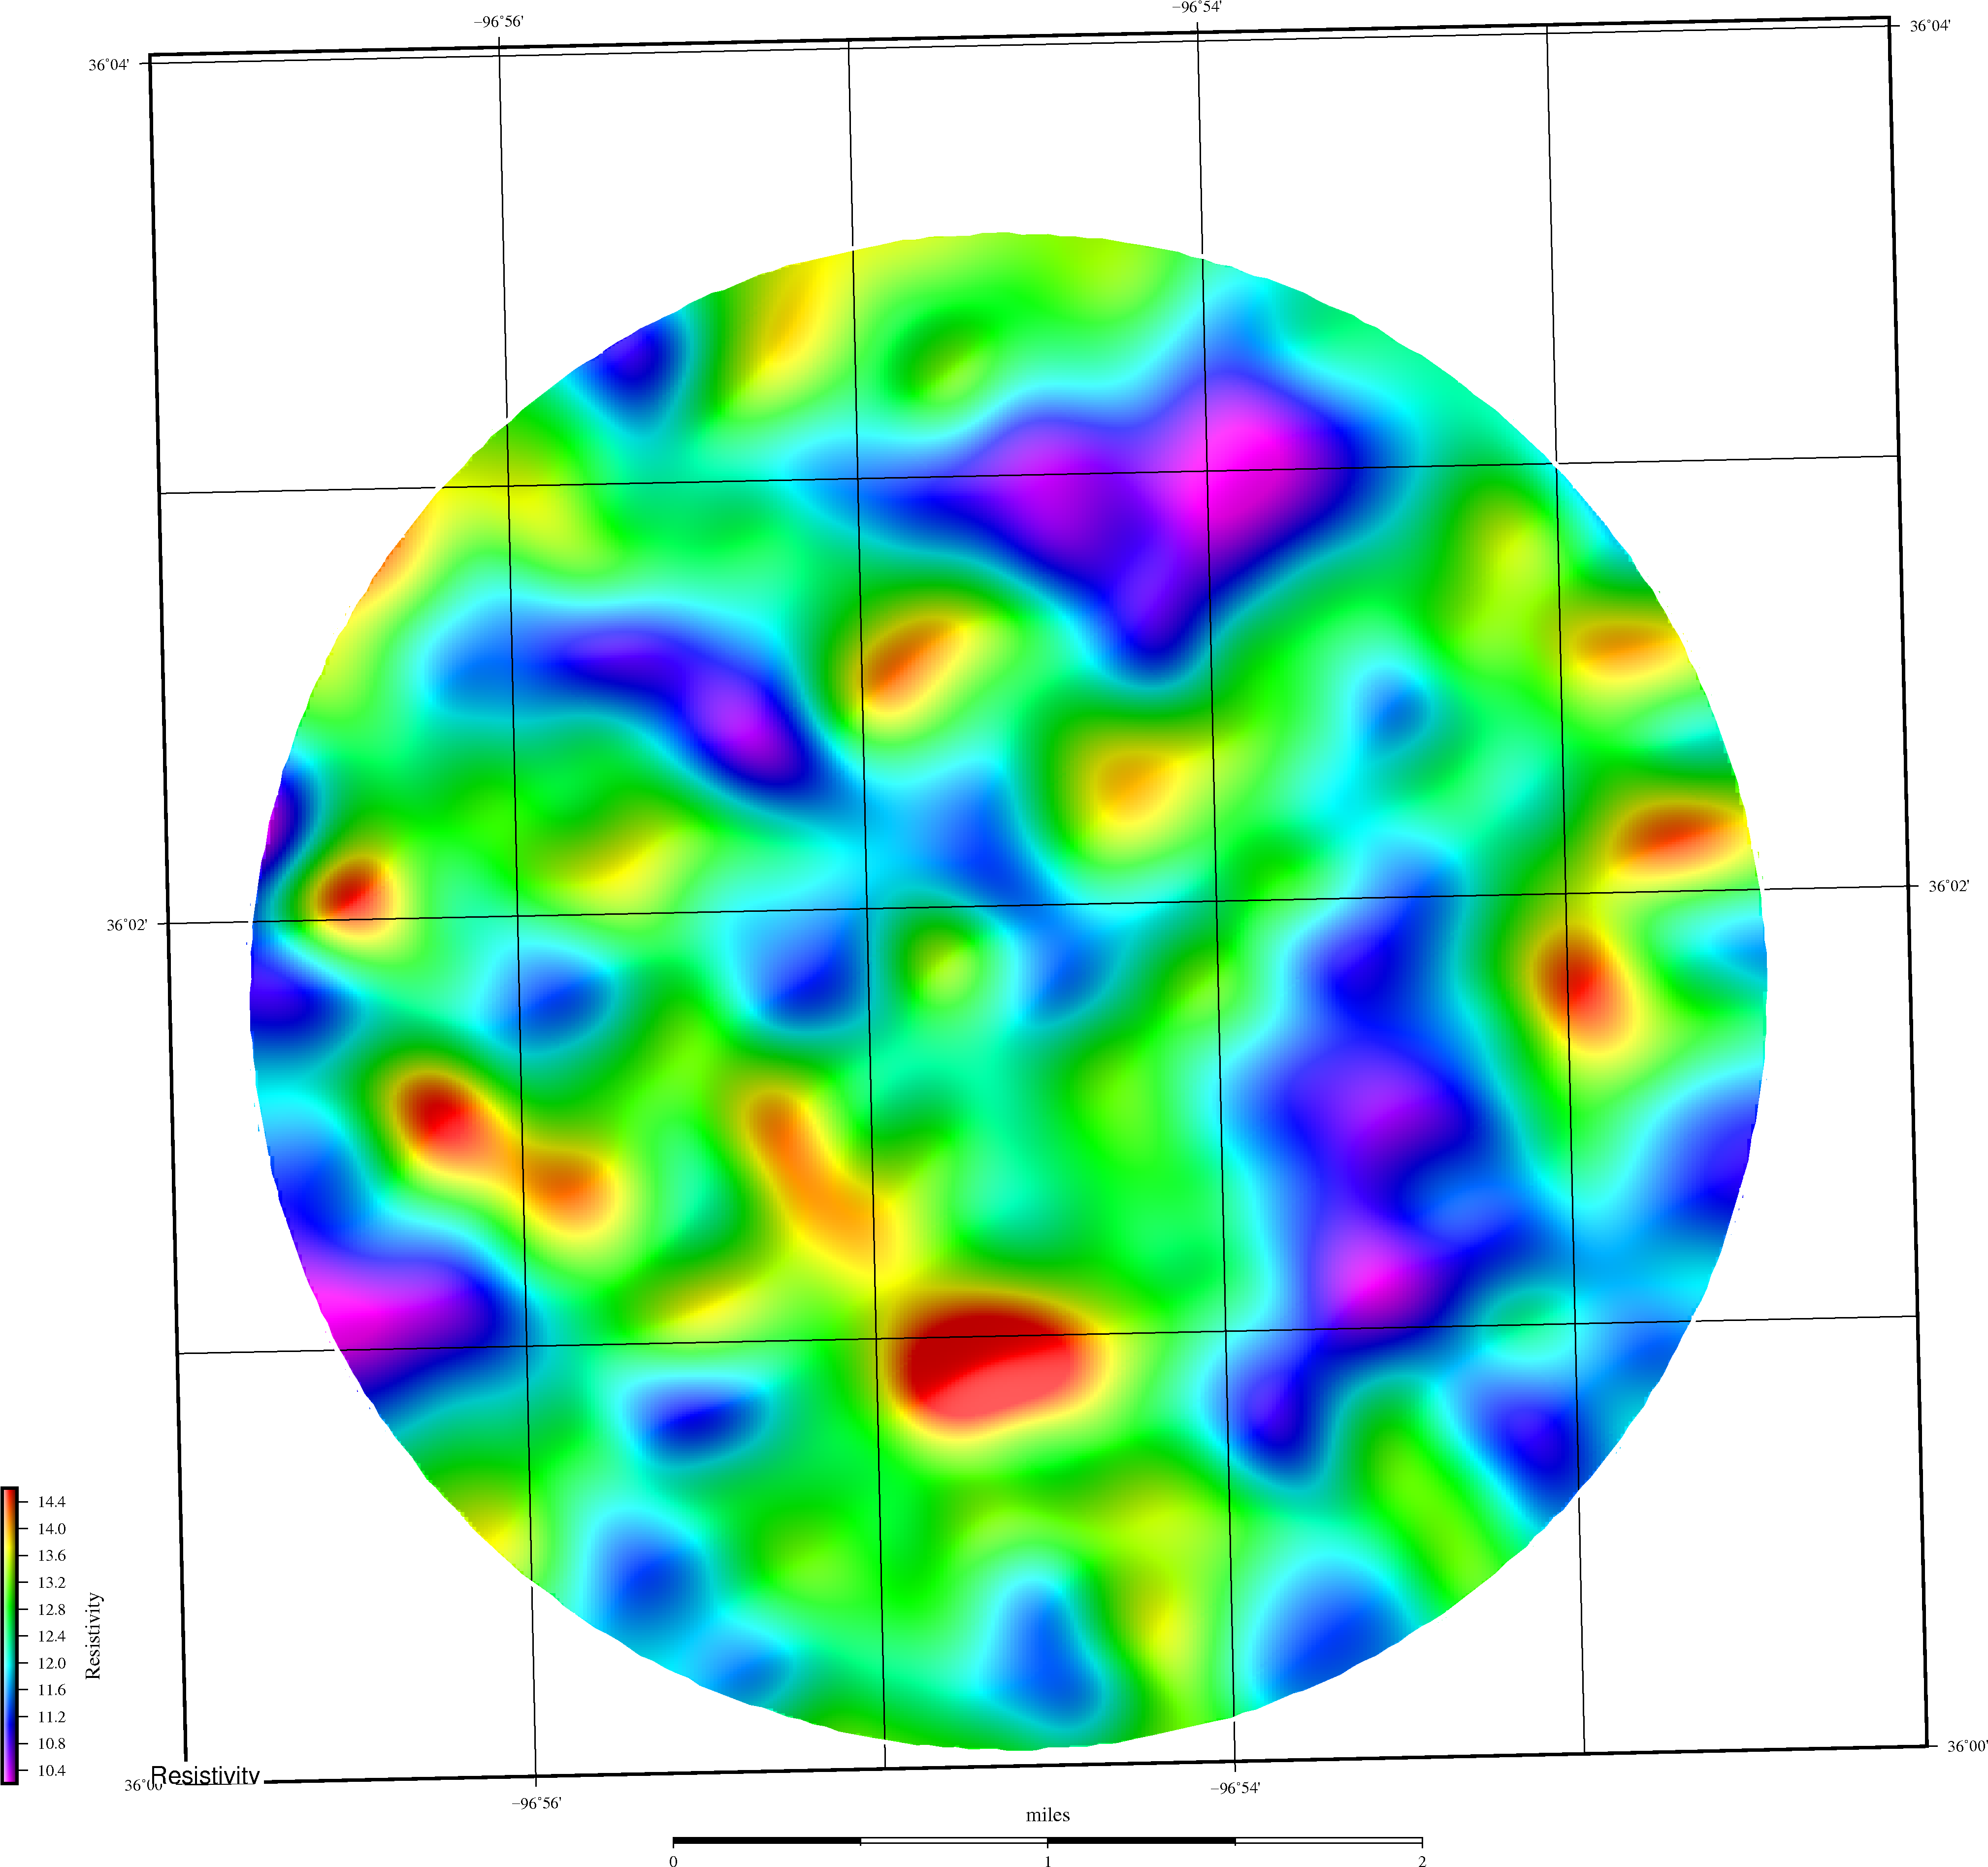
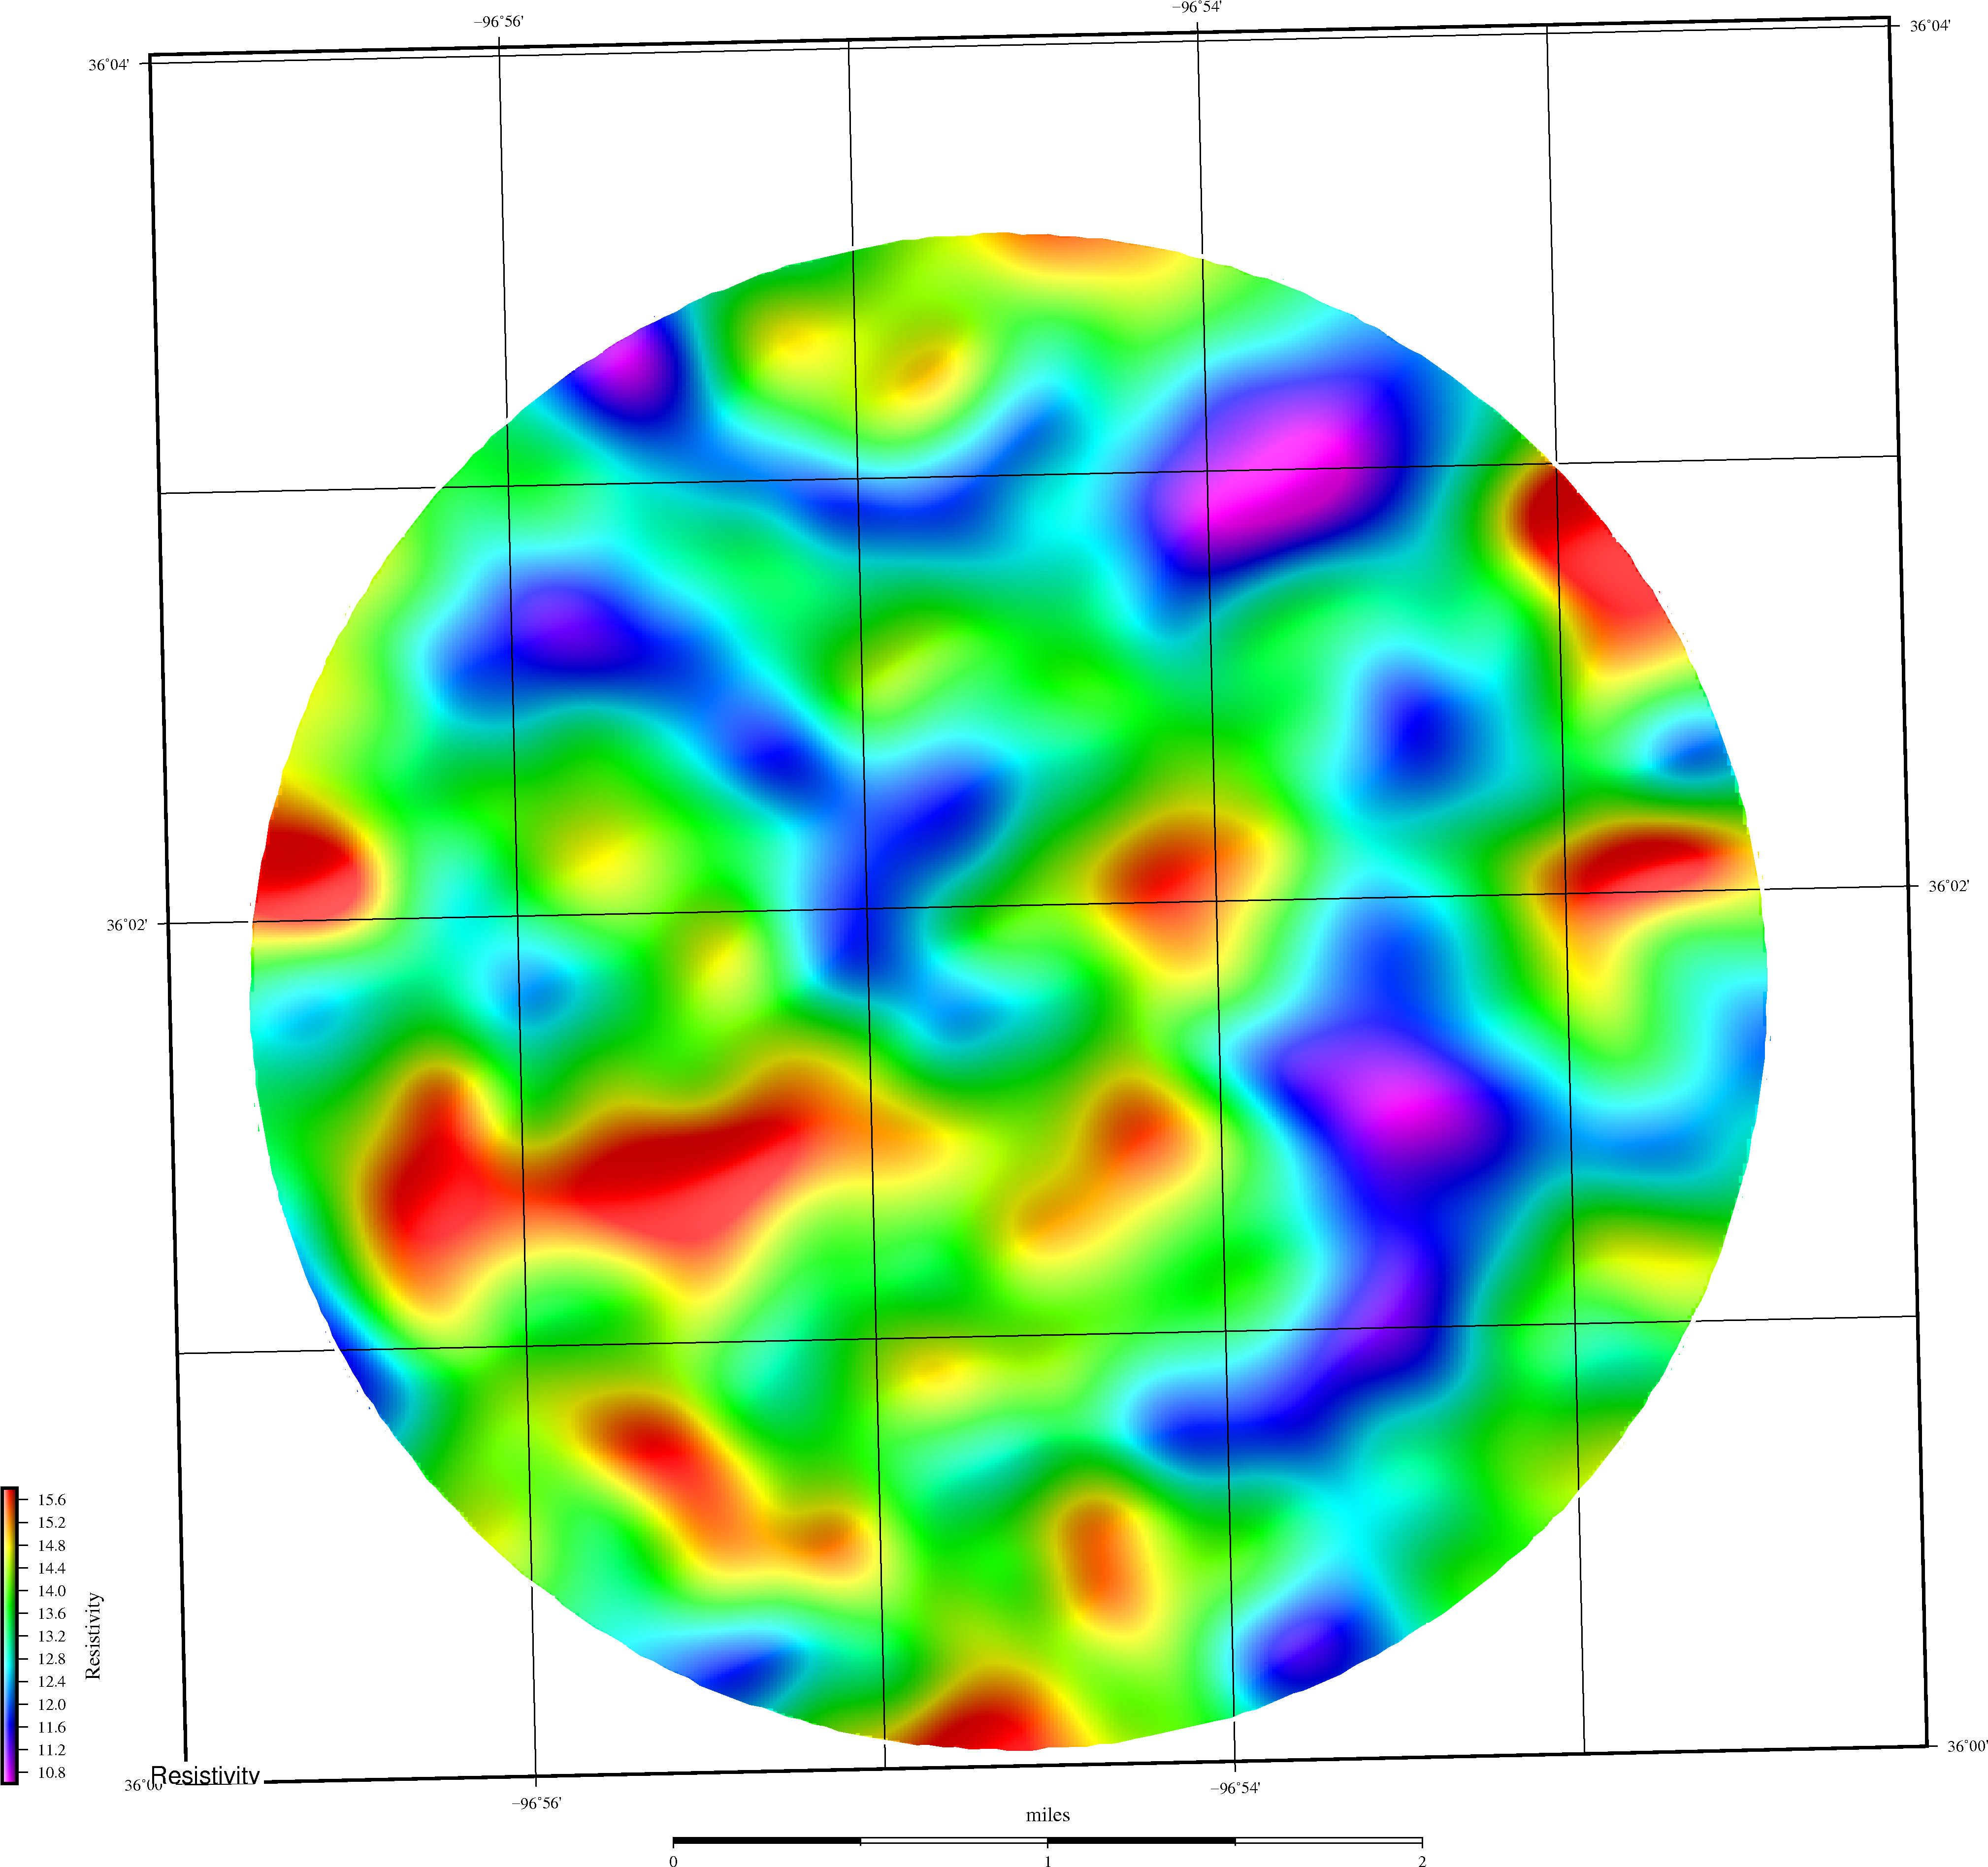
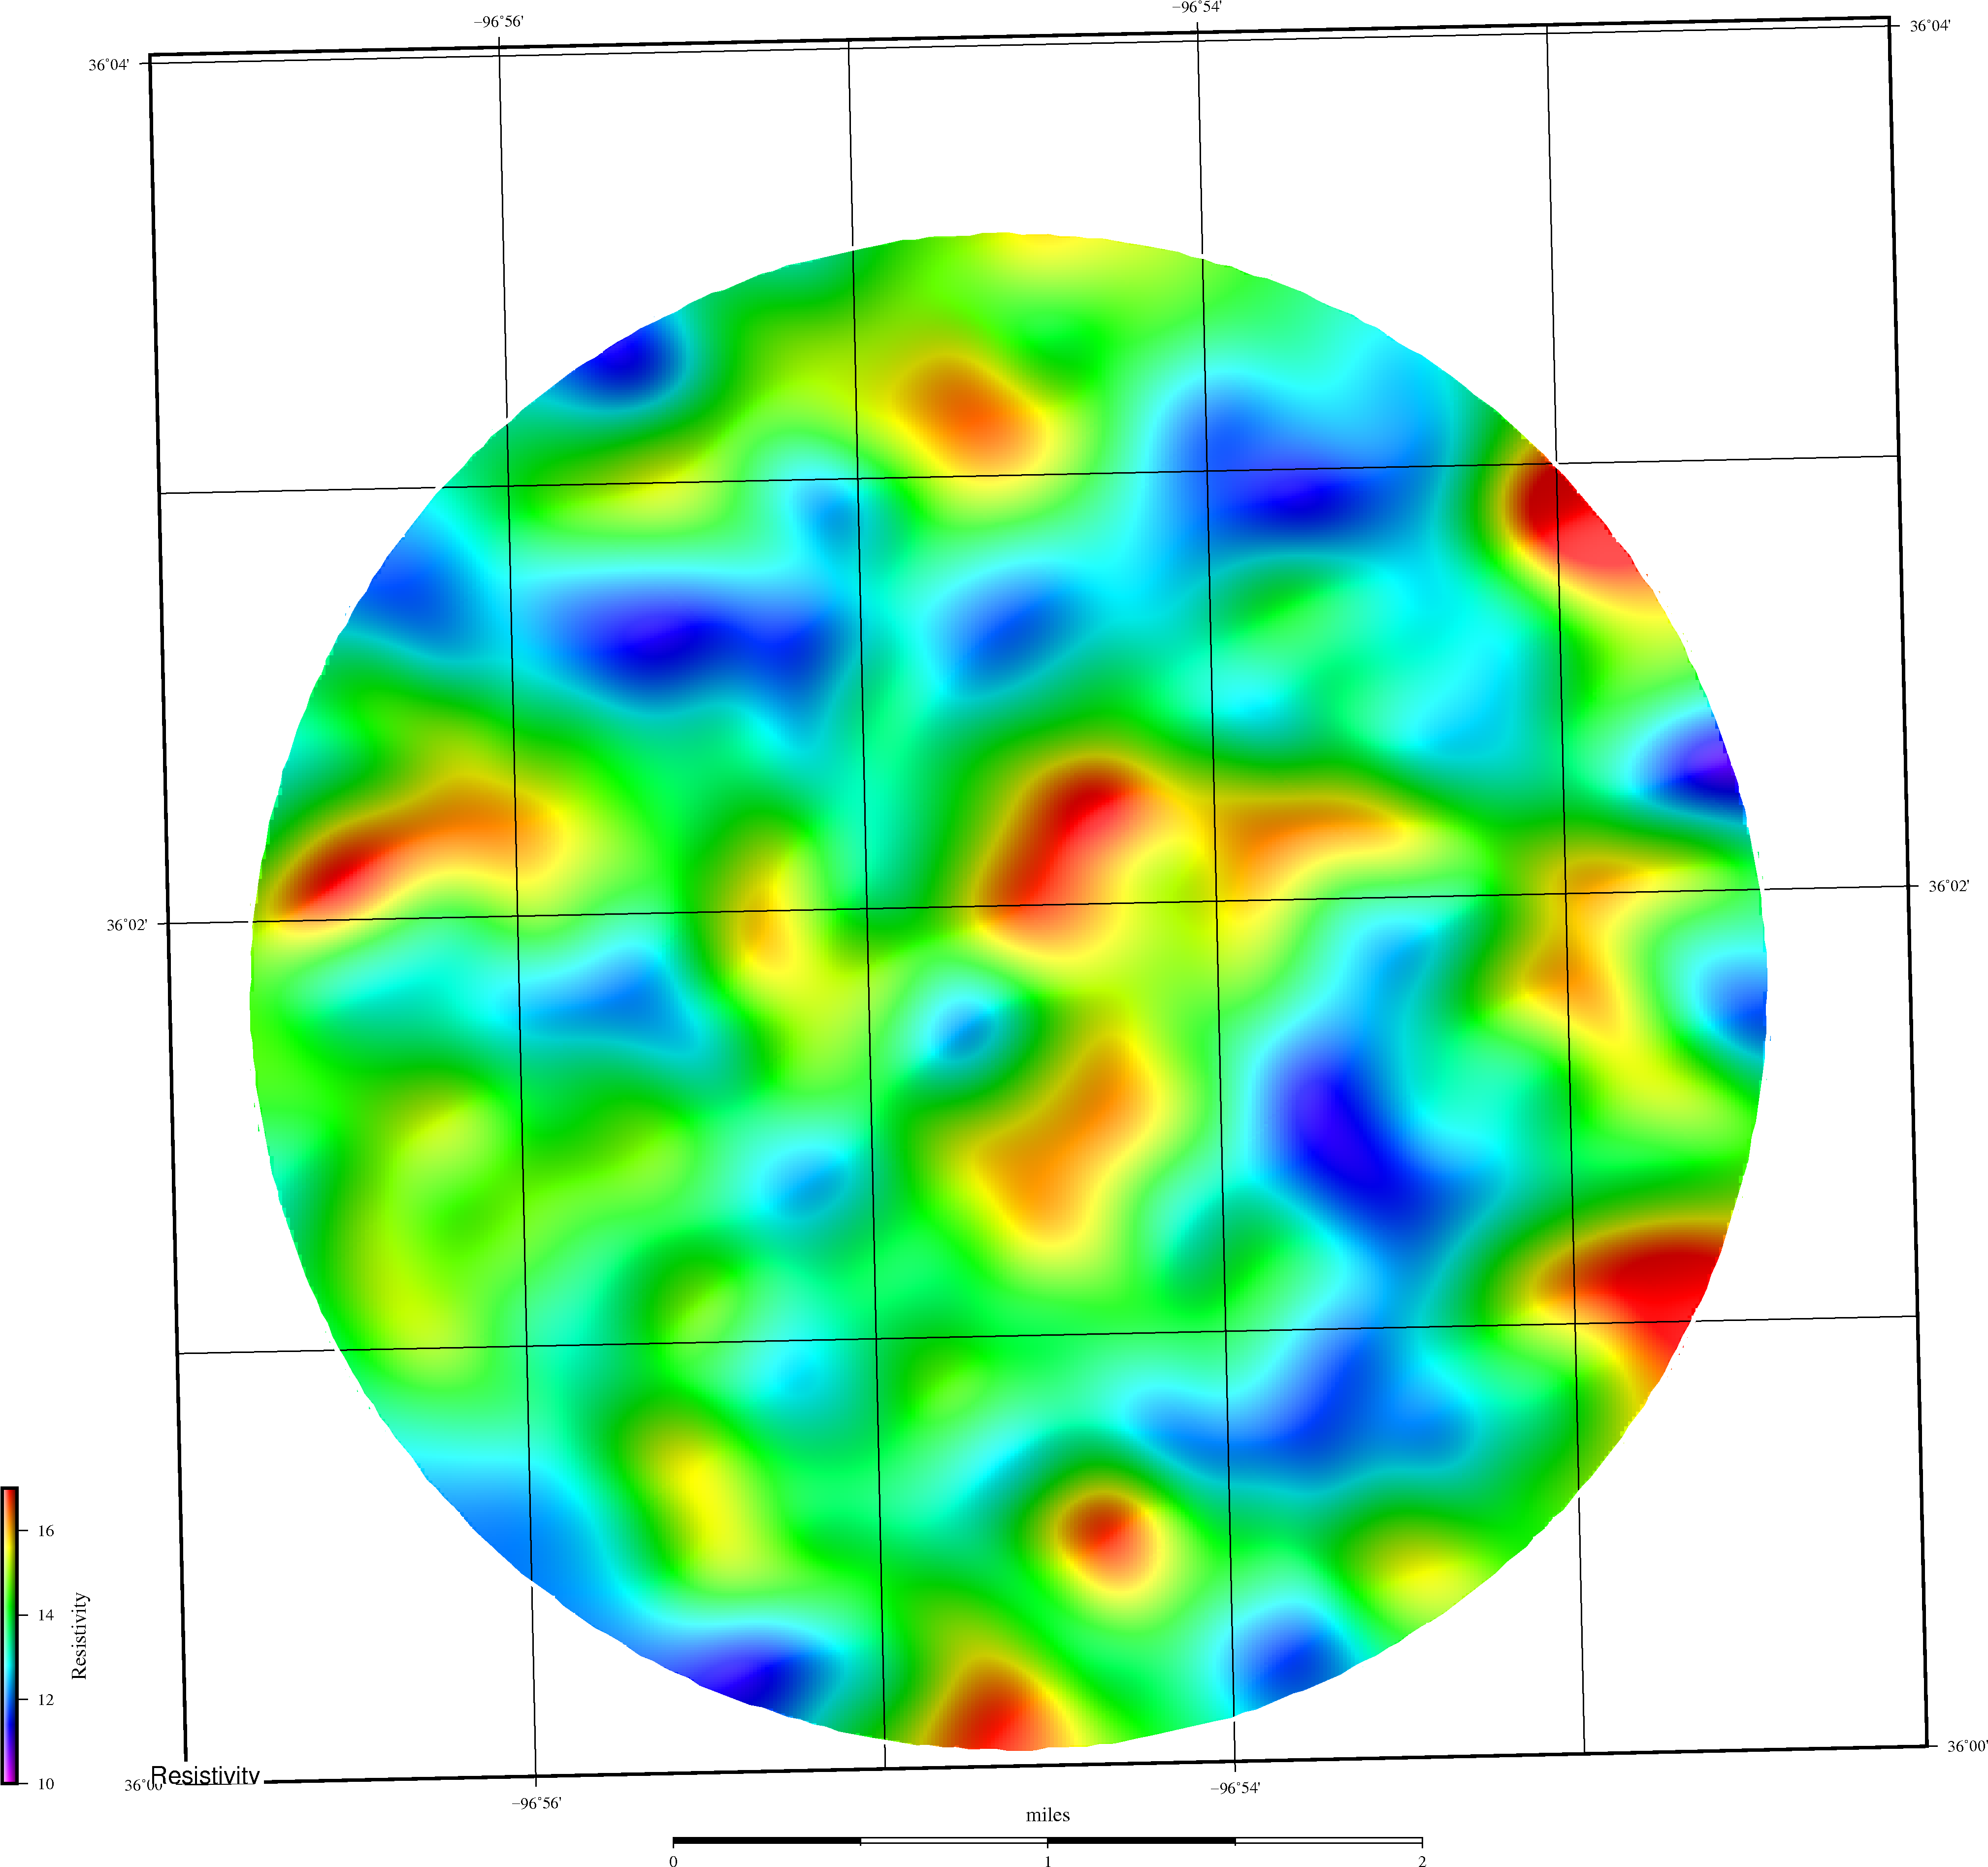
IG7 Resistivity 20+ Years | Dip Animation Resistivity |
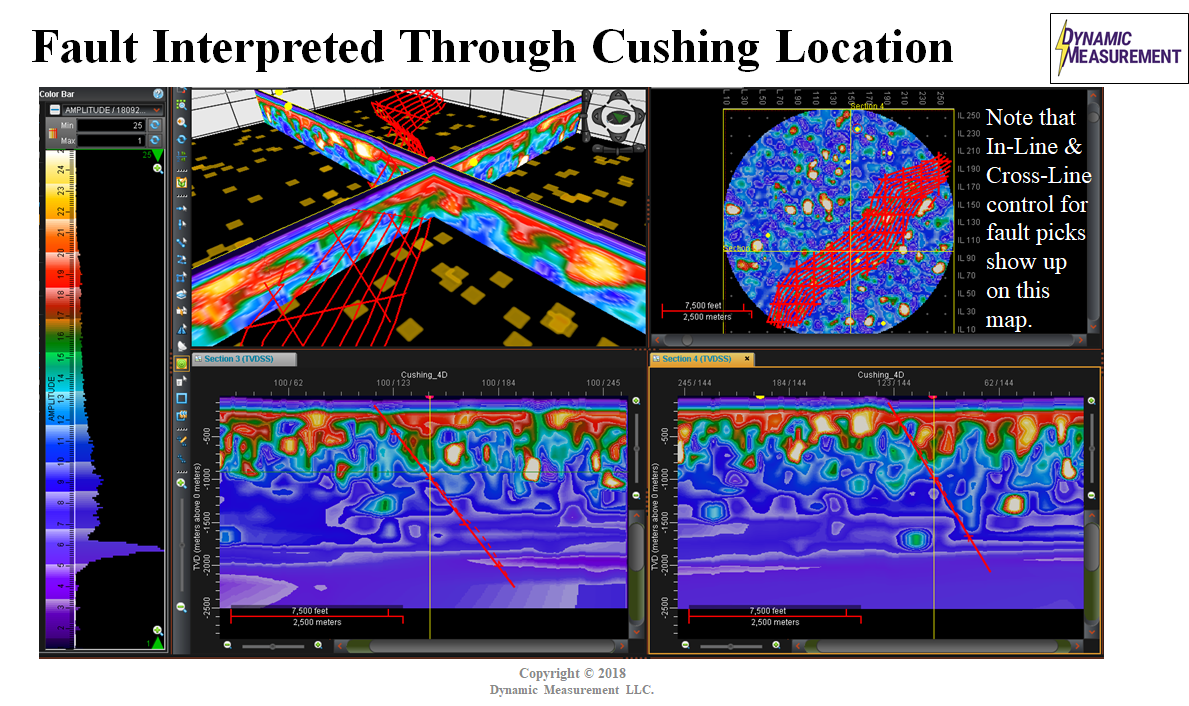
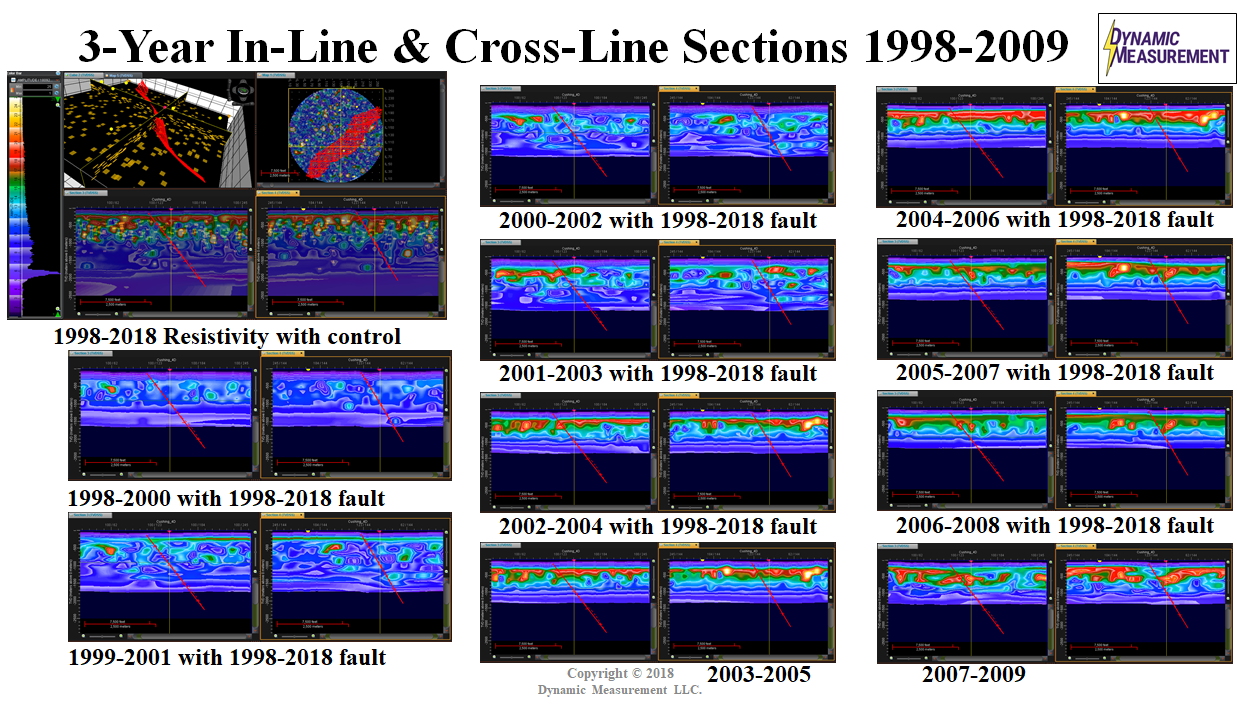
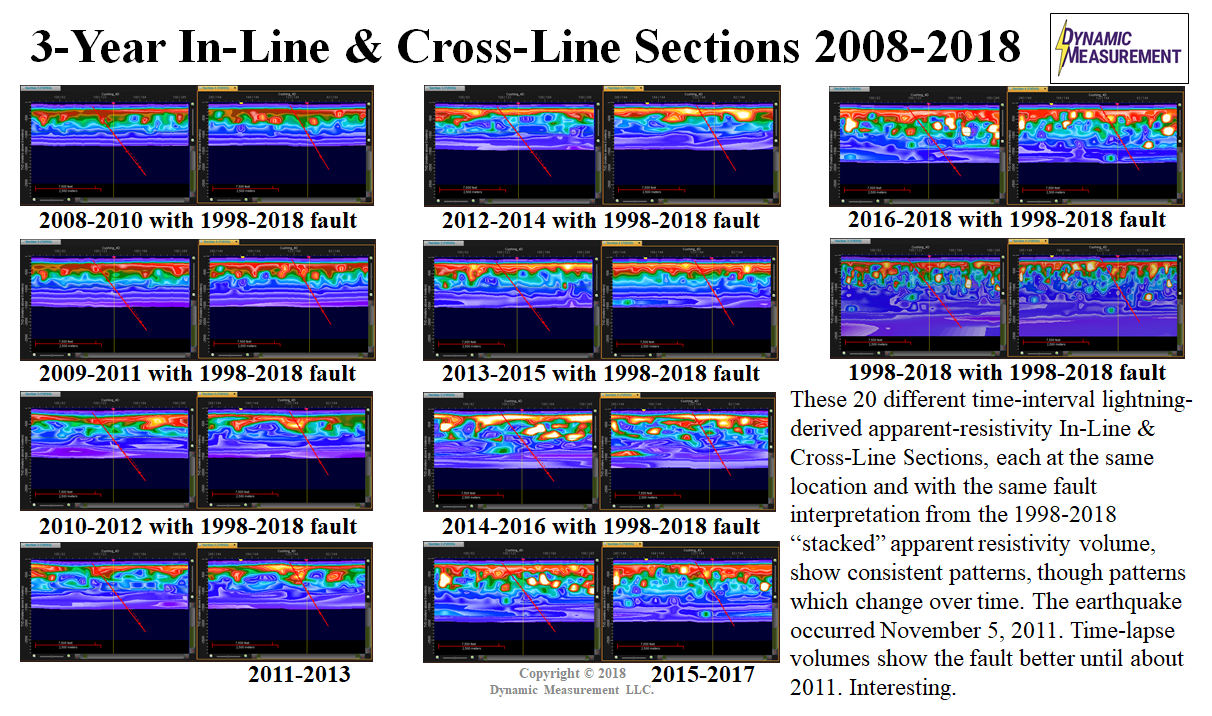
Dip Animation Red Fault | 10 3-Year Time-Lapse Resistivity |
10 3-Year Time-Lapse Resistivity | Animation Time-Lapse Sections |
 |  |
 |  |
 |  |
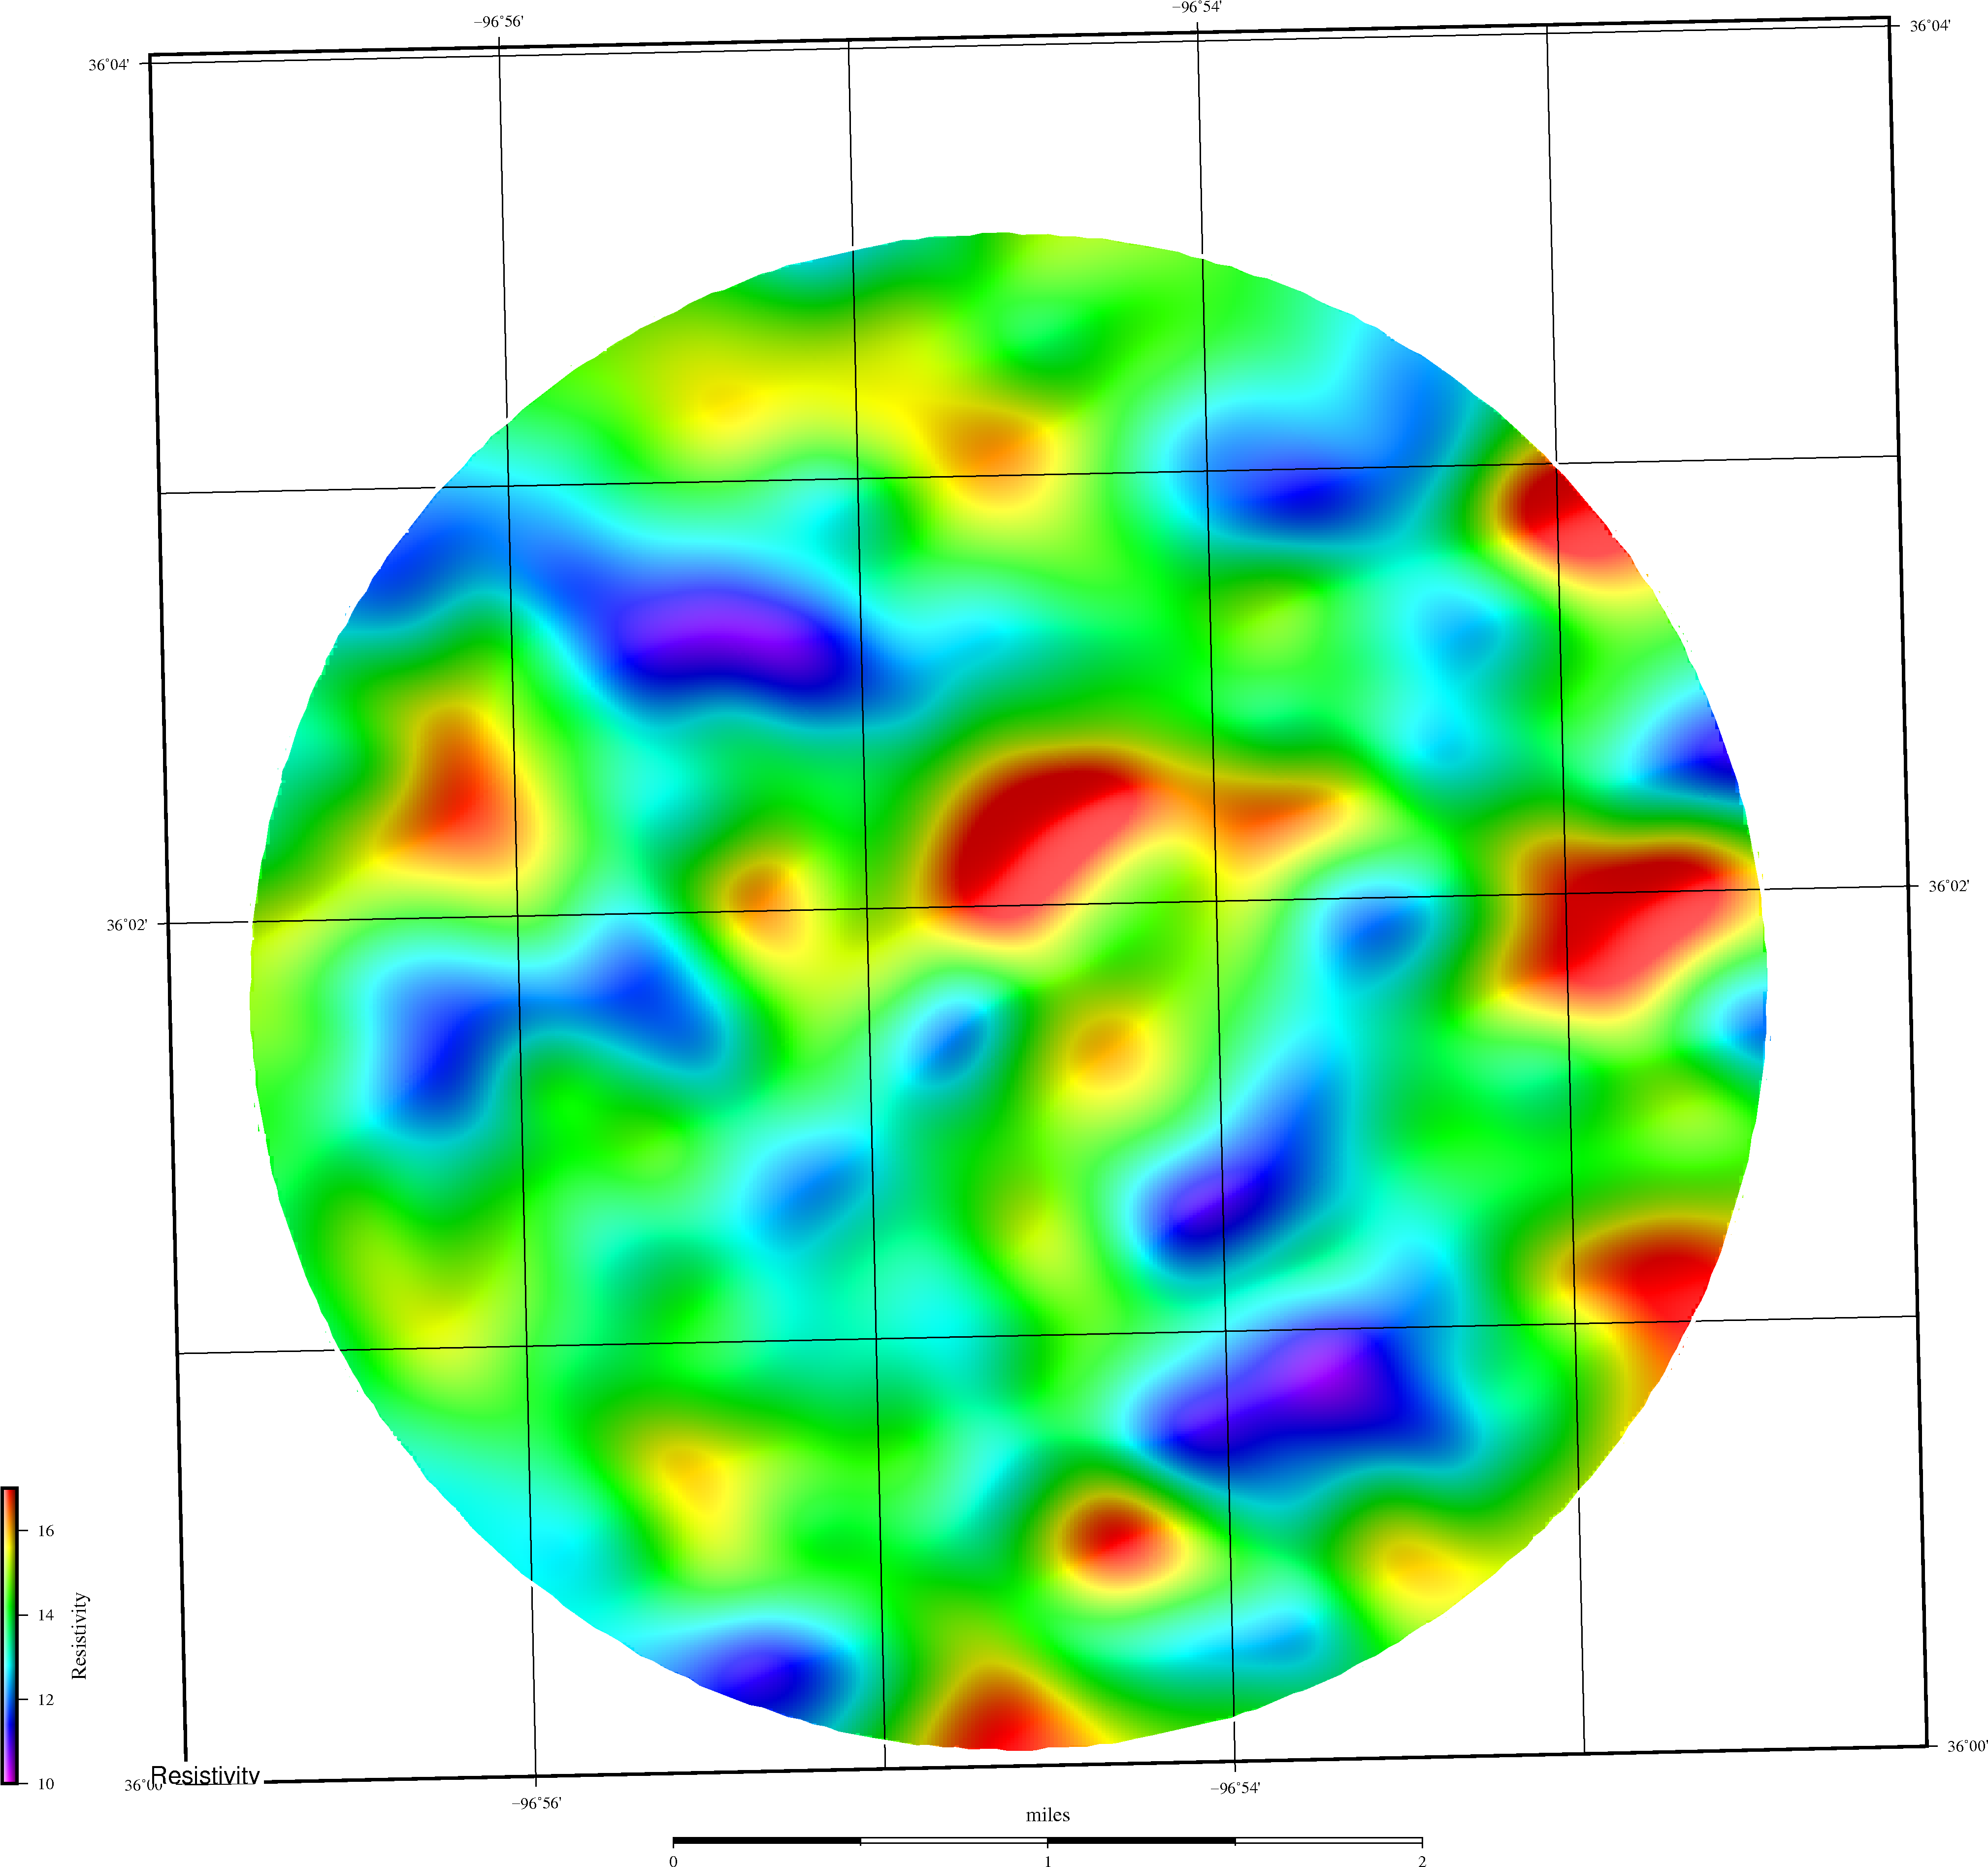 | 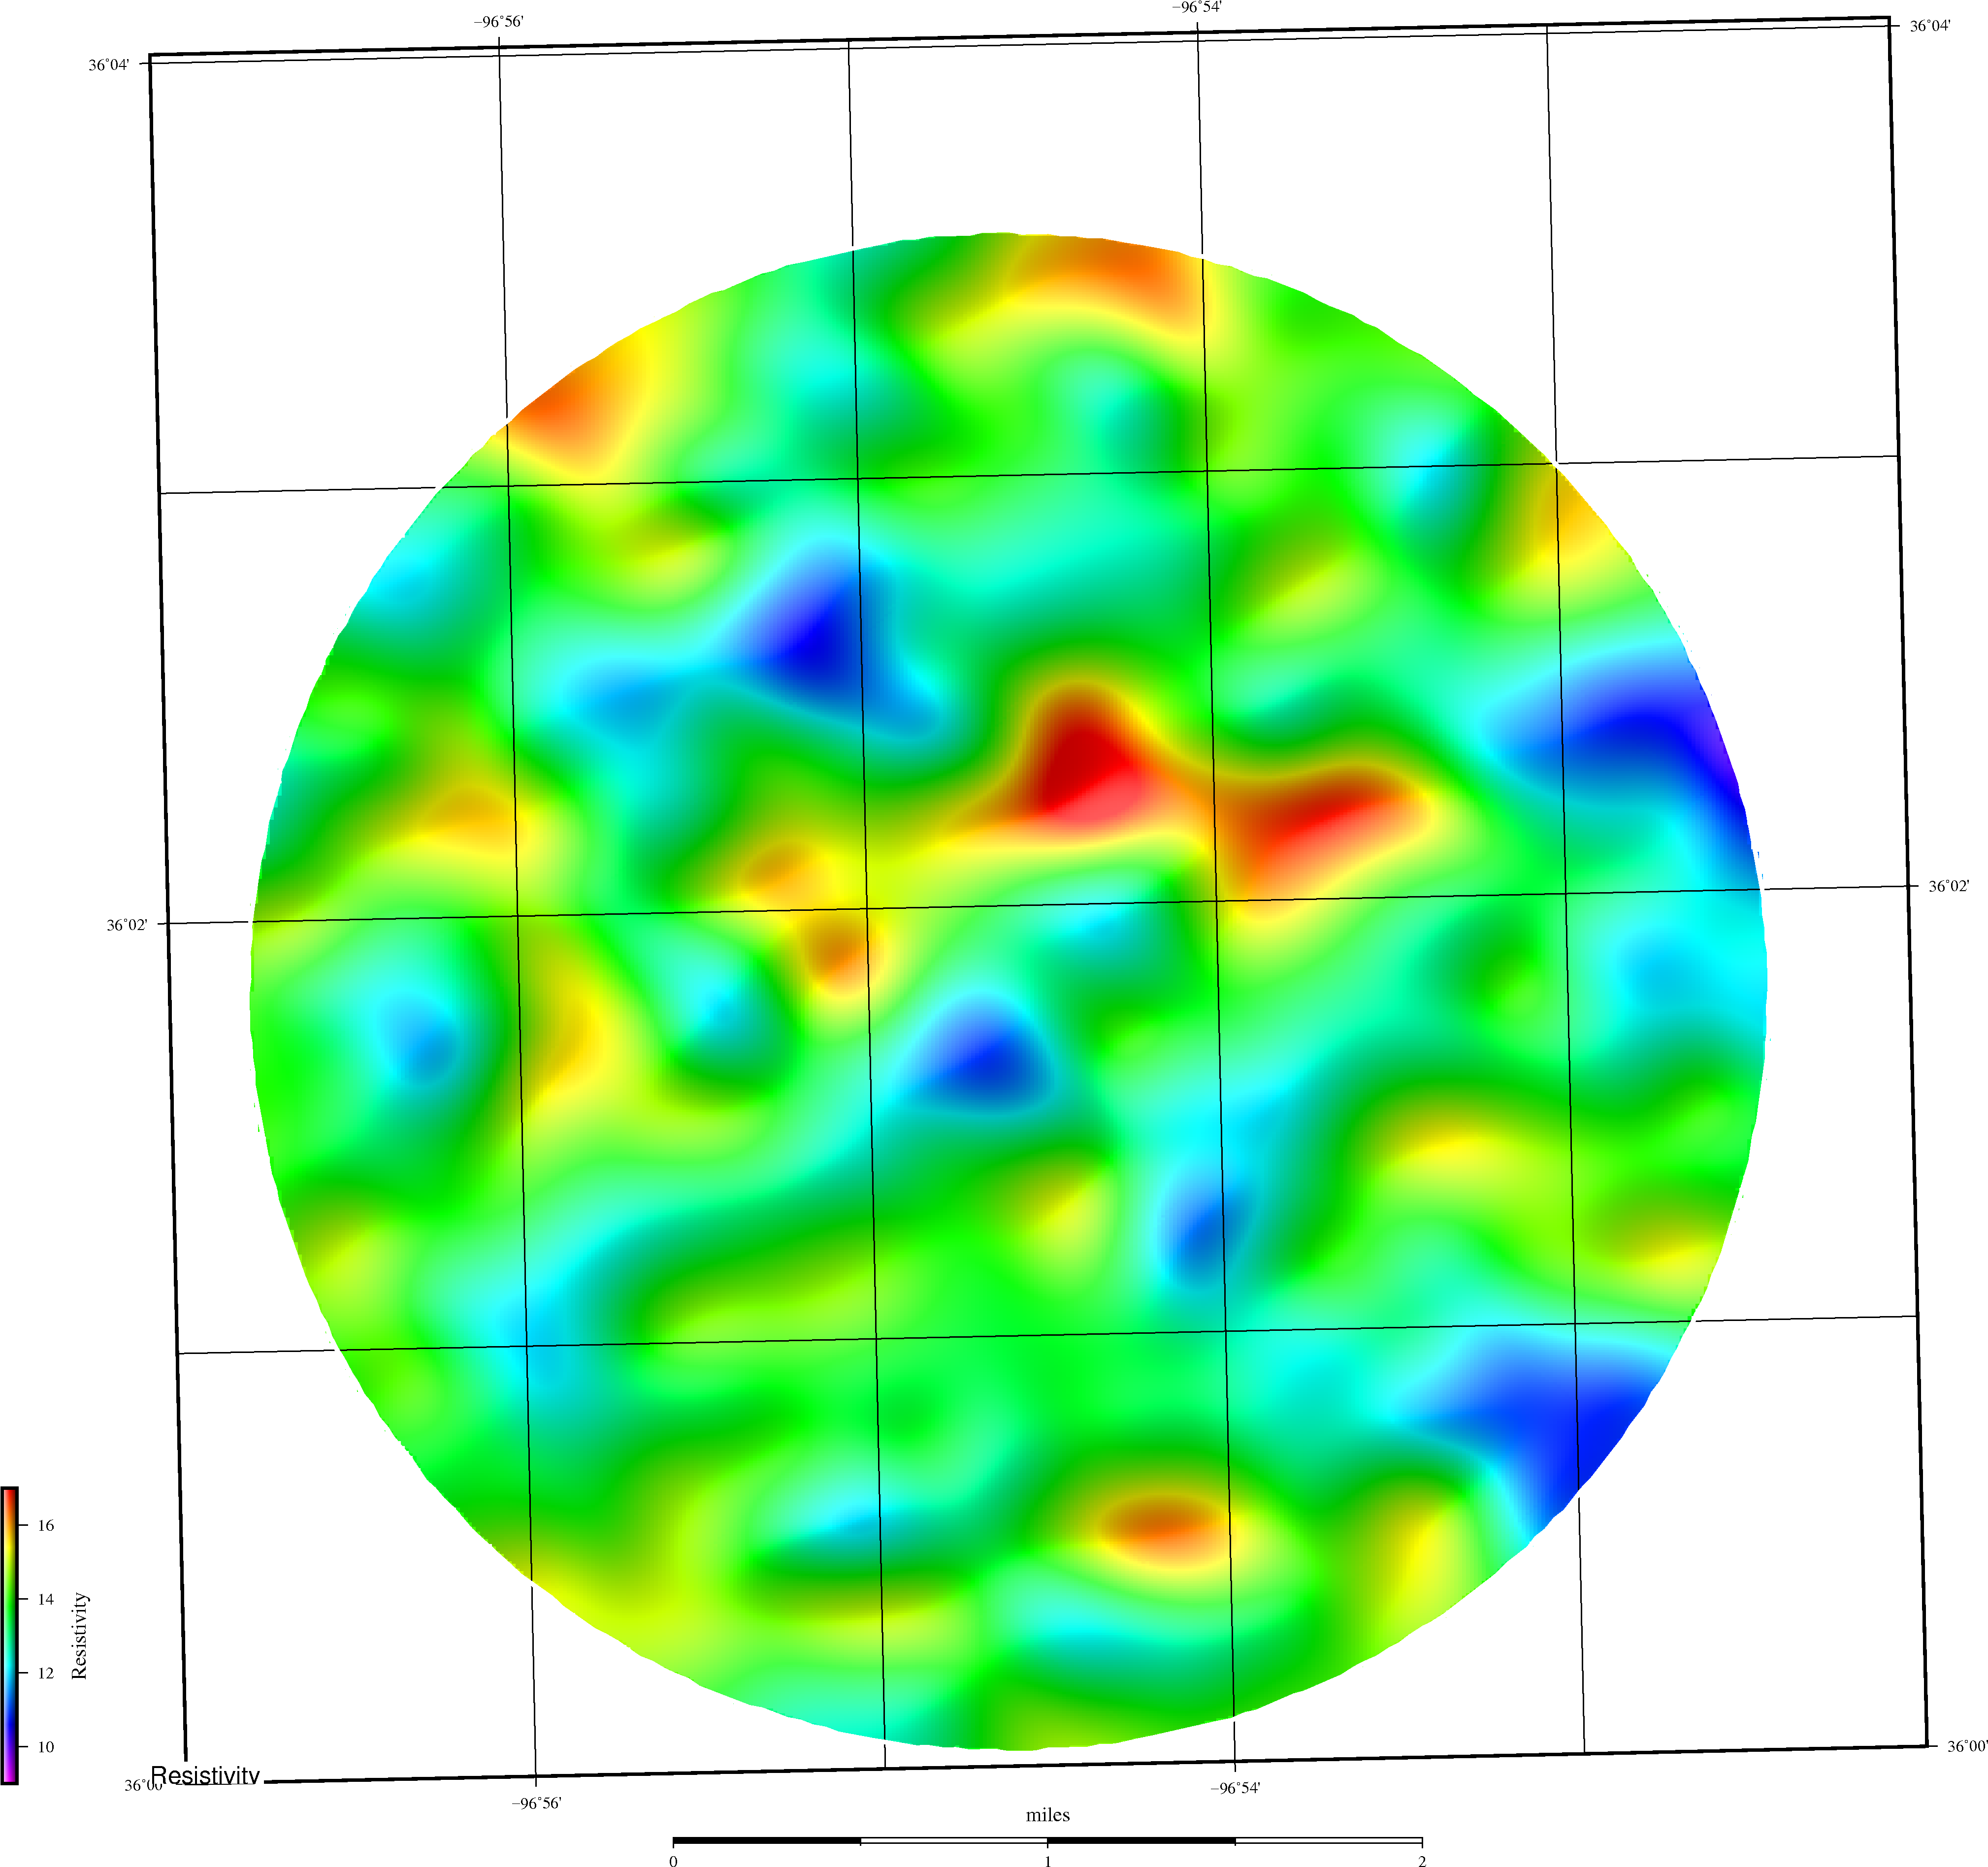 |
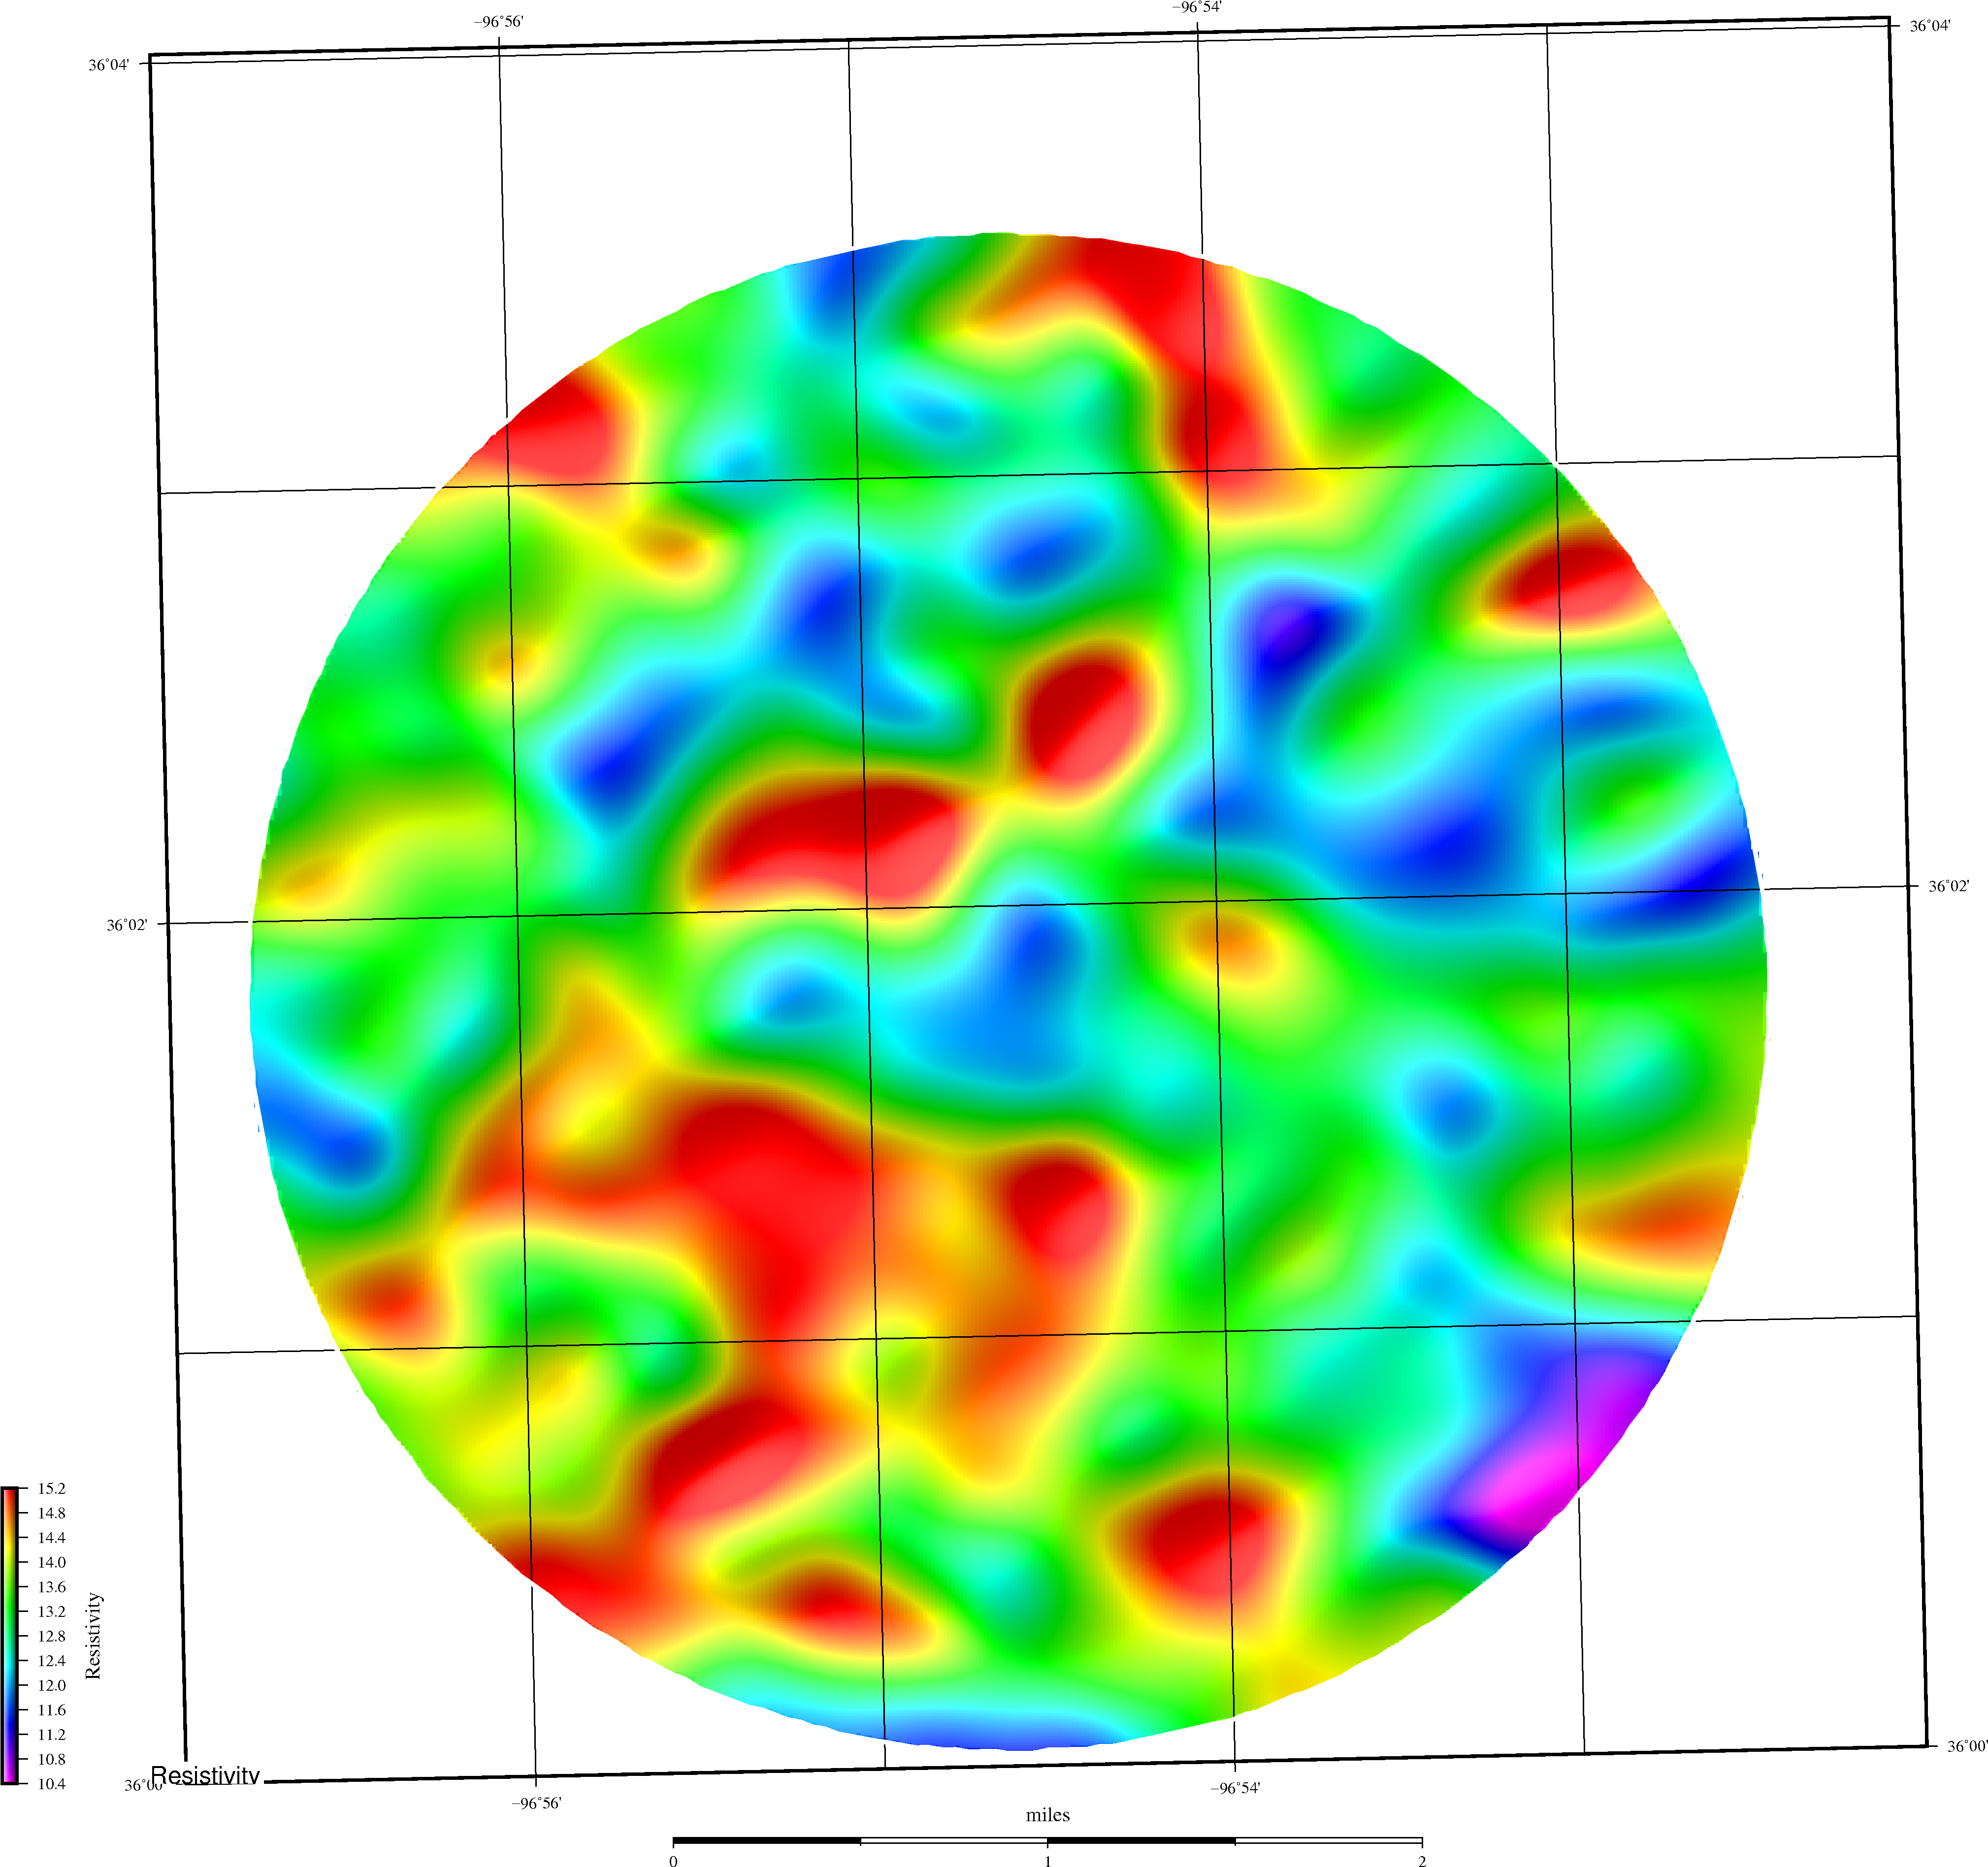 | 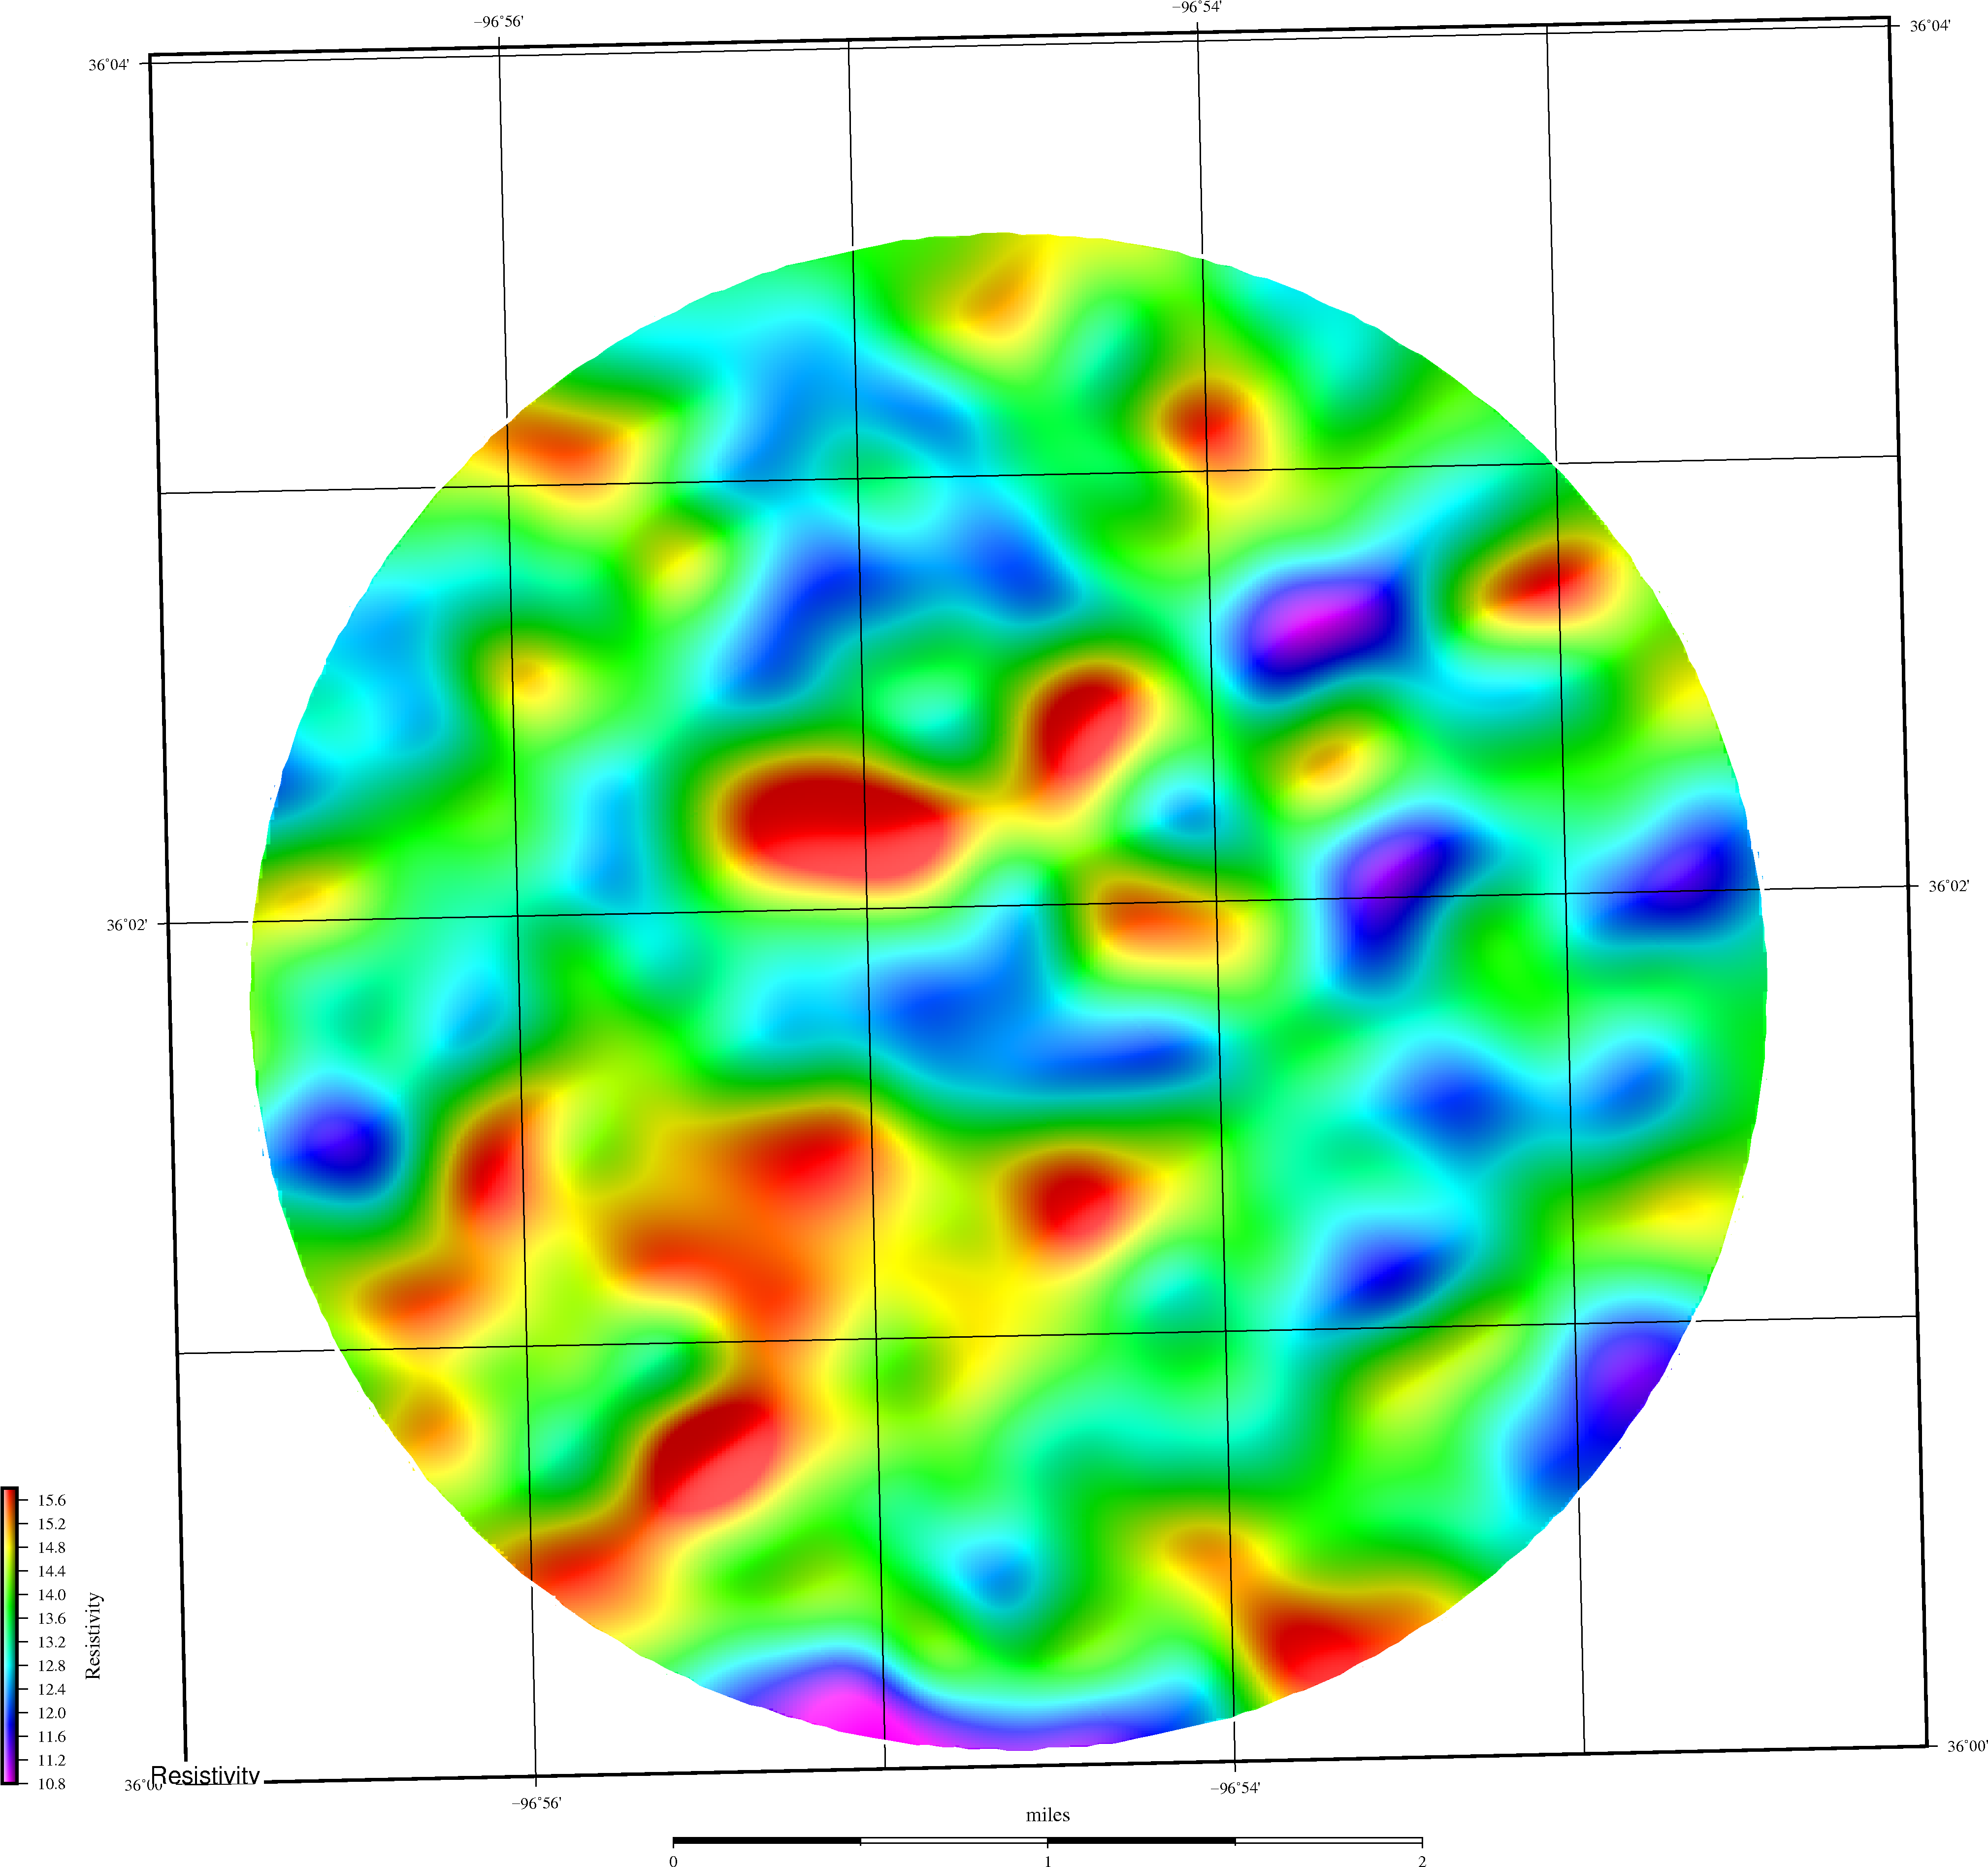 |
| IG7 Resistivity 1998-2000 | IG7 Resistivity 1999-2001 |
IG7 Resistivity 2000-2002 | IG7 Resistivity 2001-2003 |
IG7 Resistivity 2002-2004 | IG7 Resistivity 2003-2005 |
IG7 Resistivity 2004-2006 | IG7 Resistivity 2005-2007 |
IG7 Resistivity 2006-2008 | IG7 Resistivity 2007-2009 |
 |  |
 |  |
 |  |
 |  |
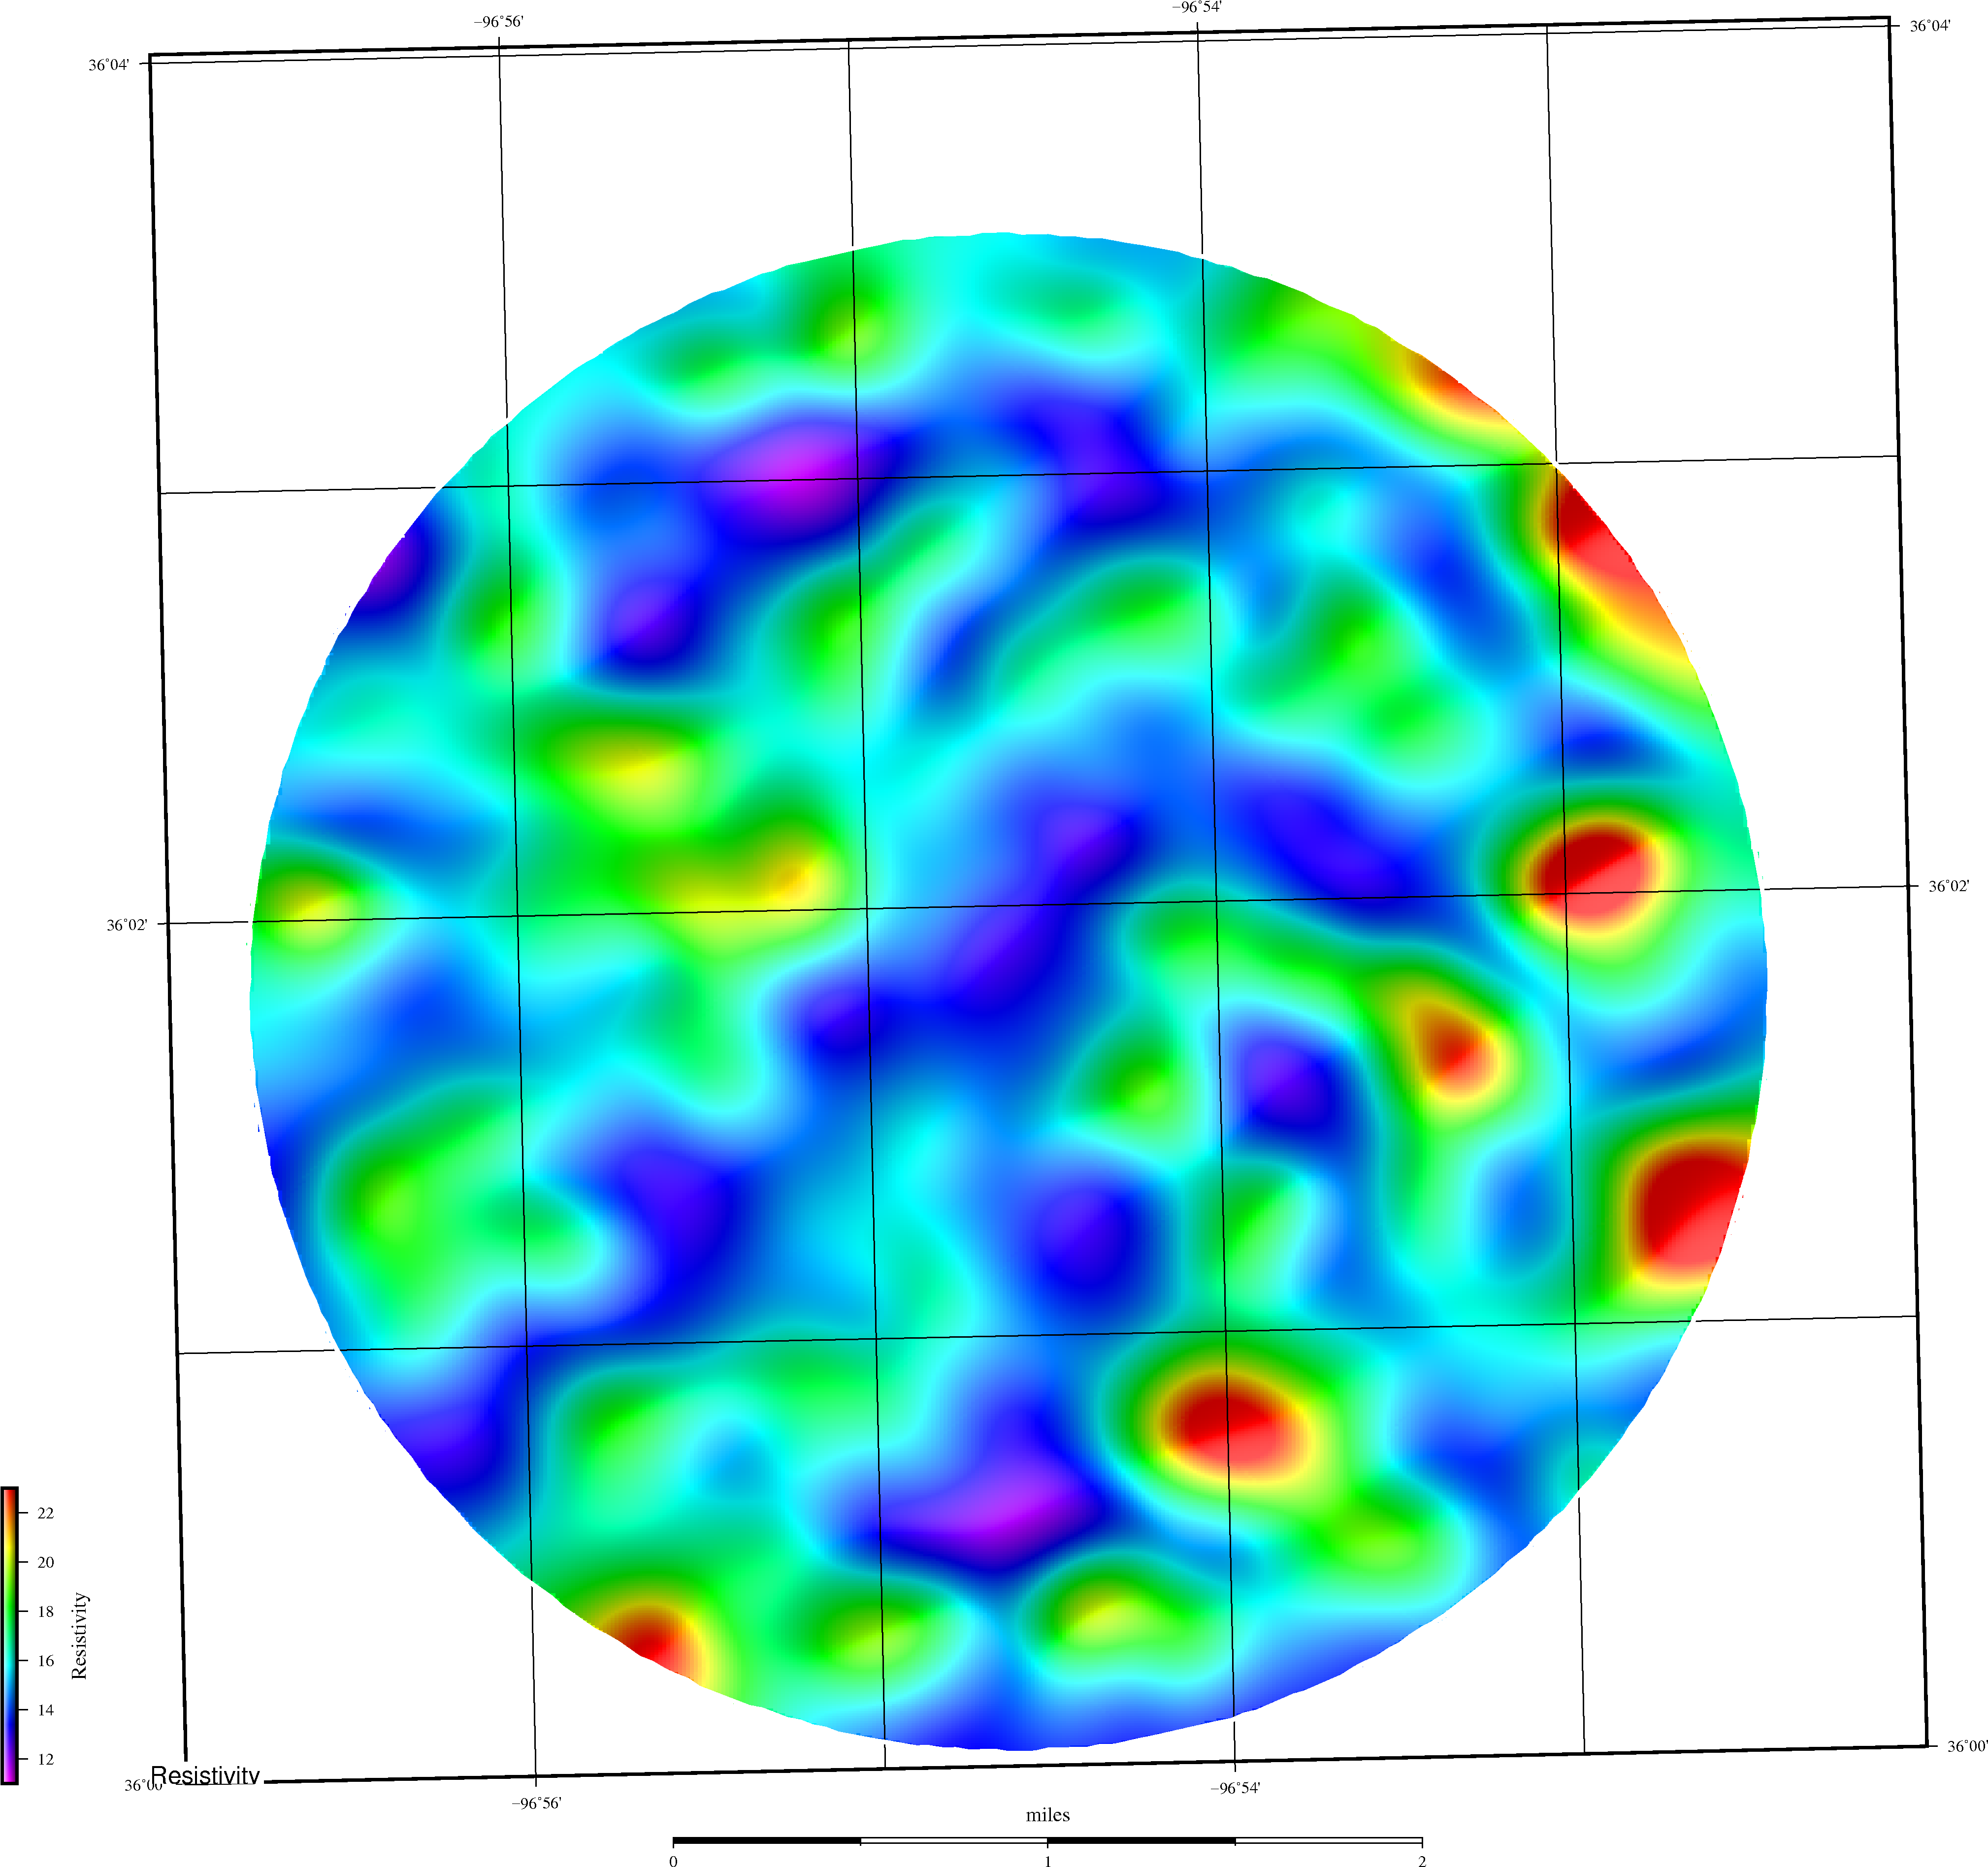 |
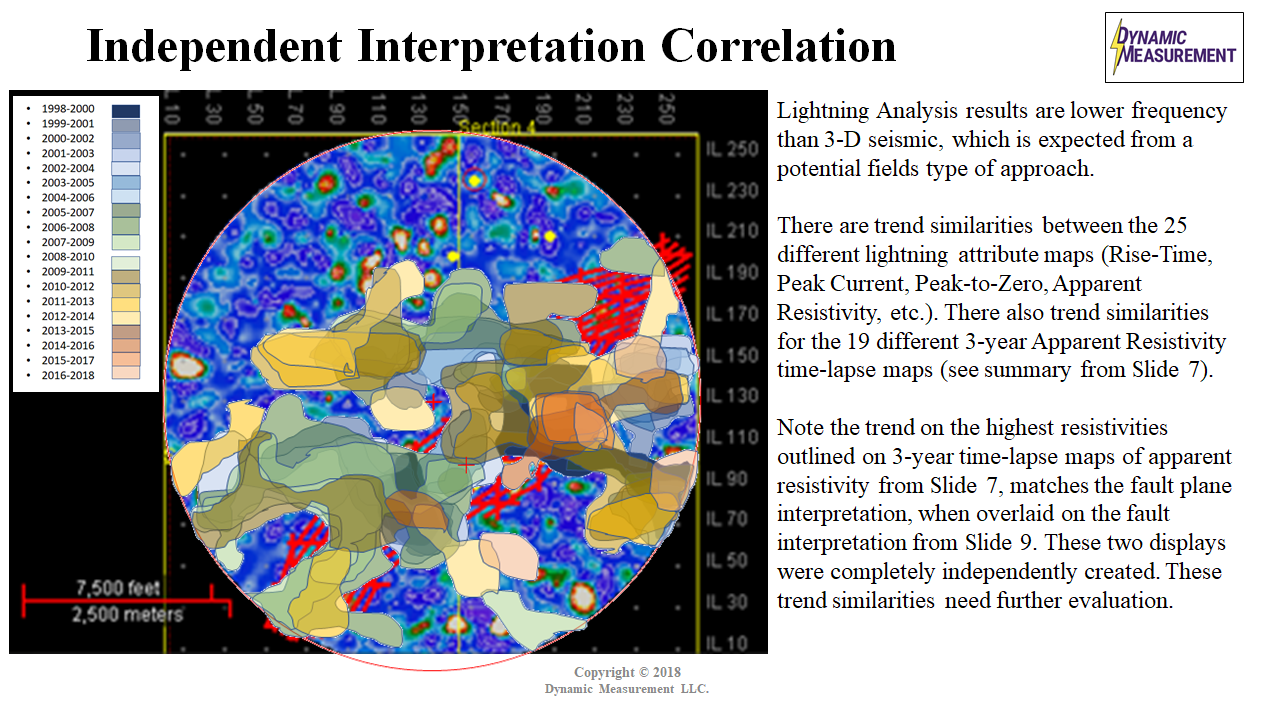
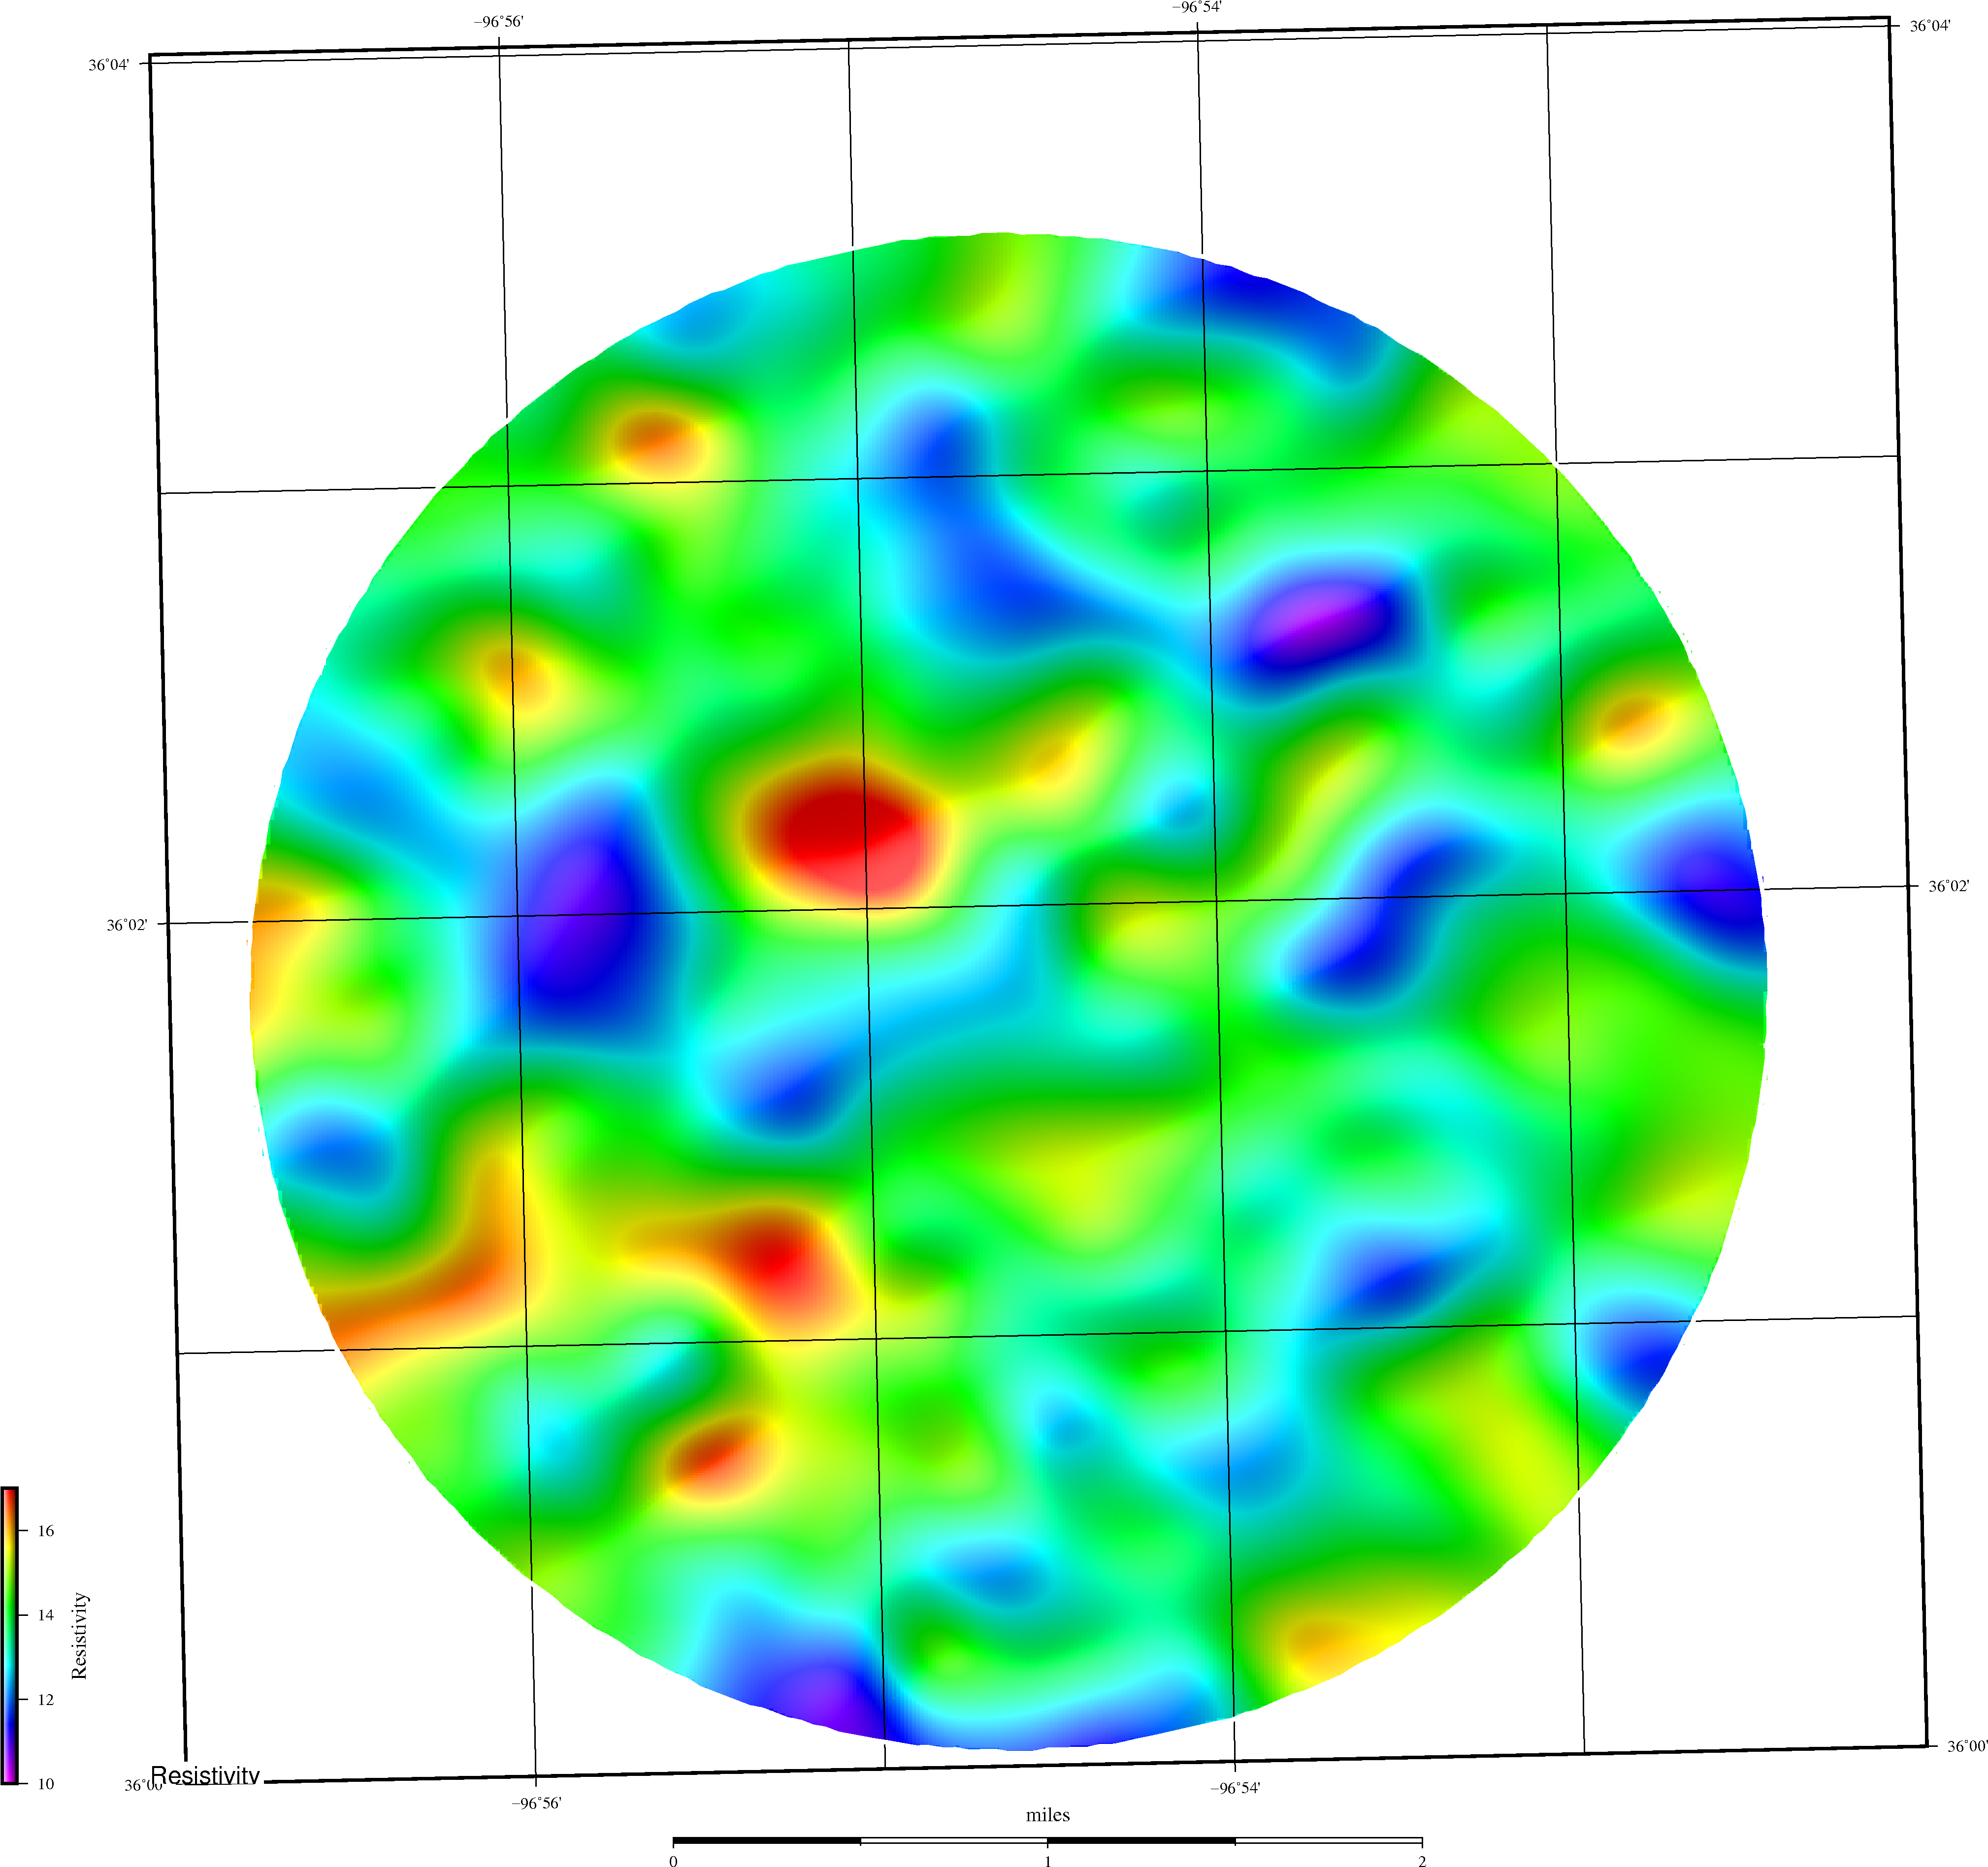
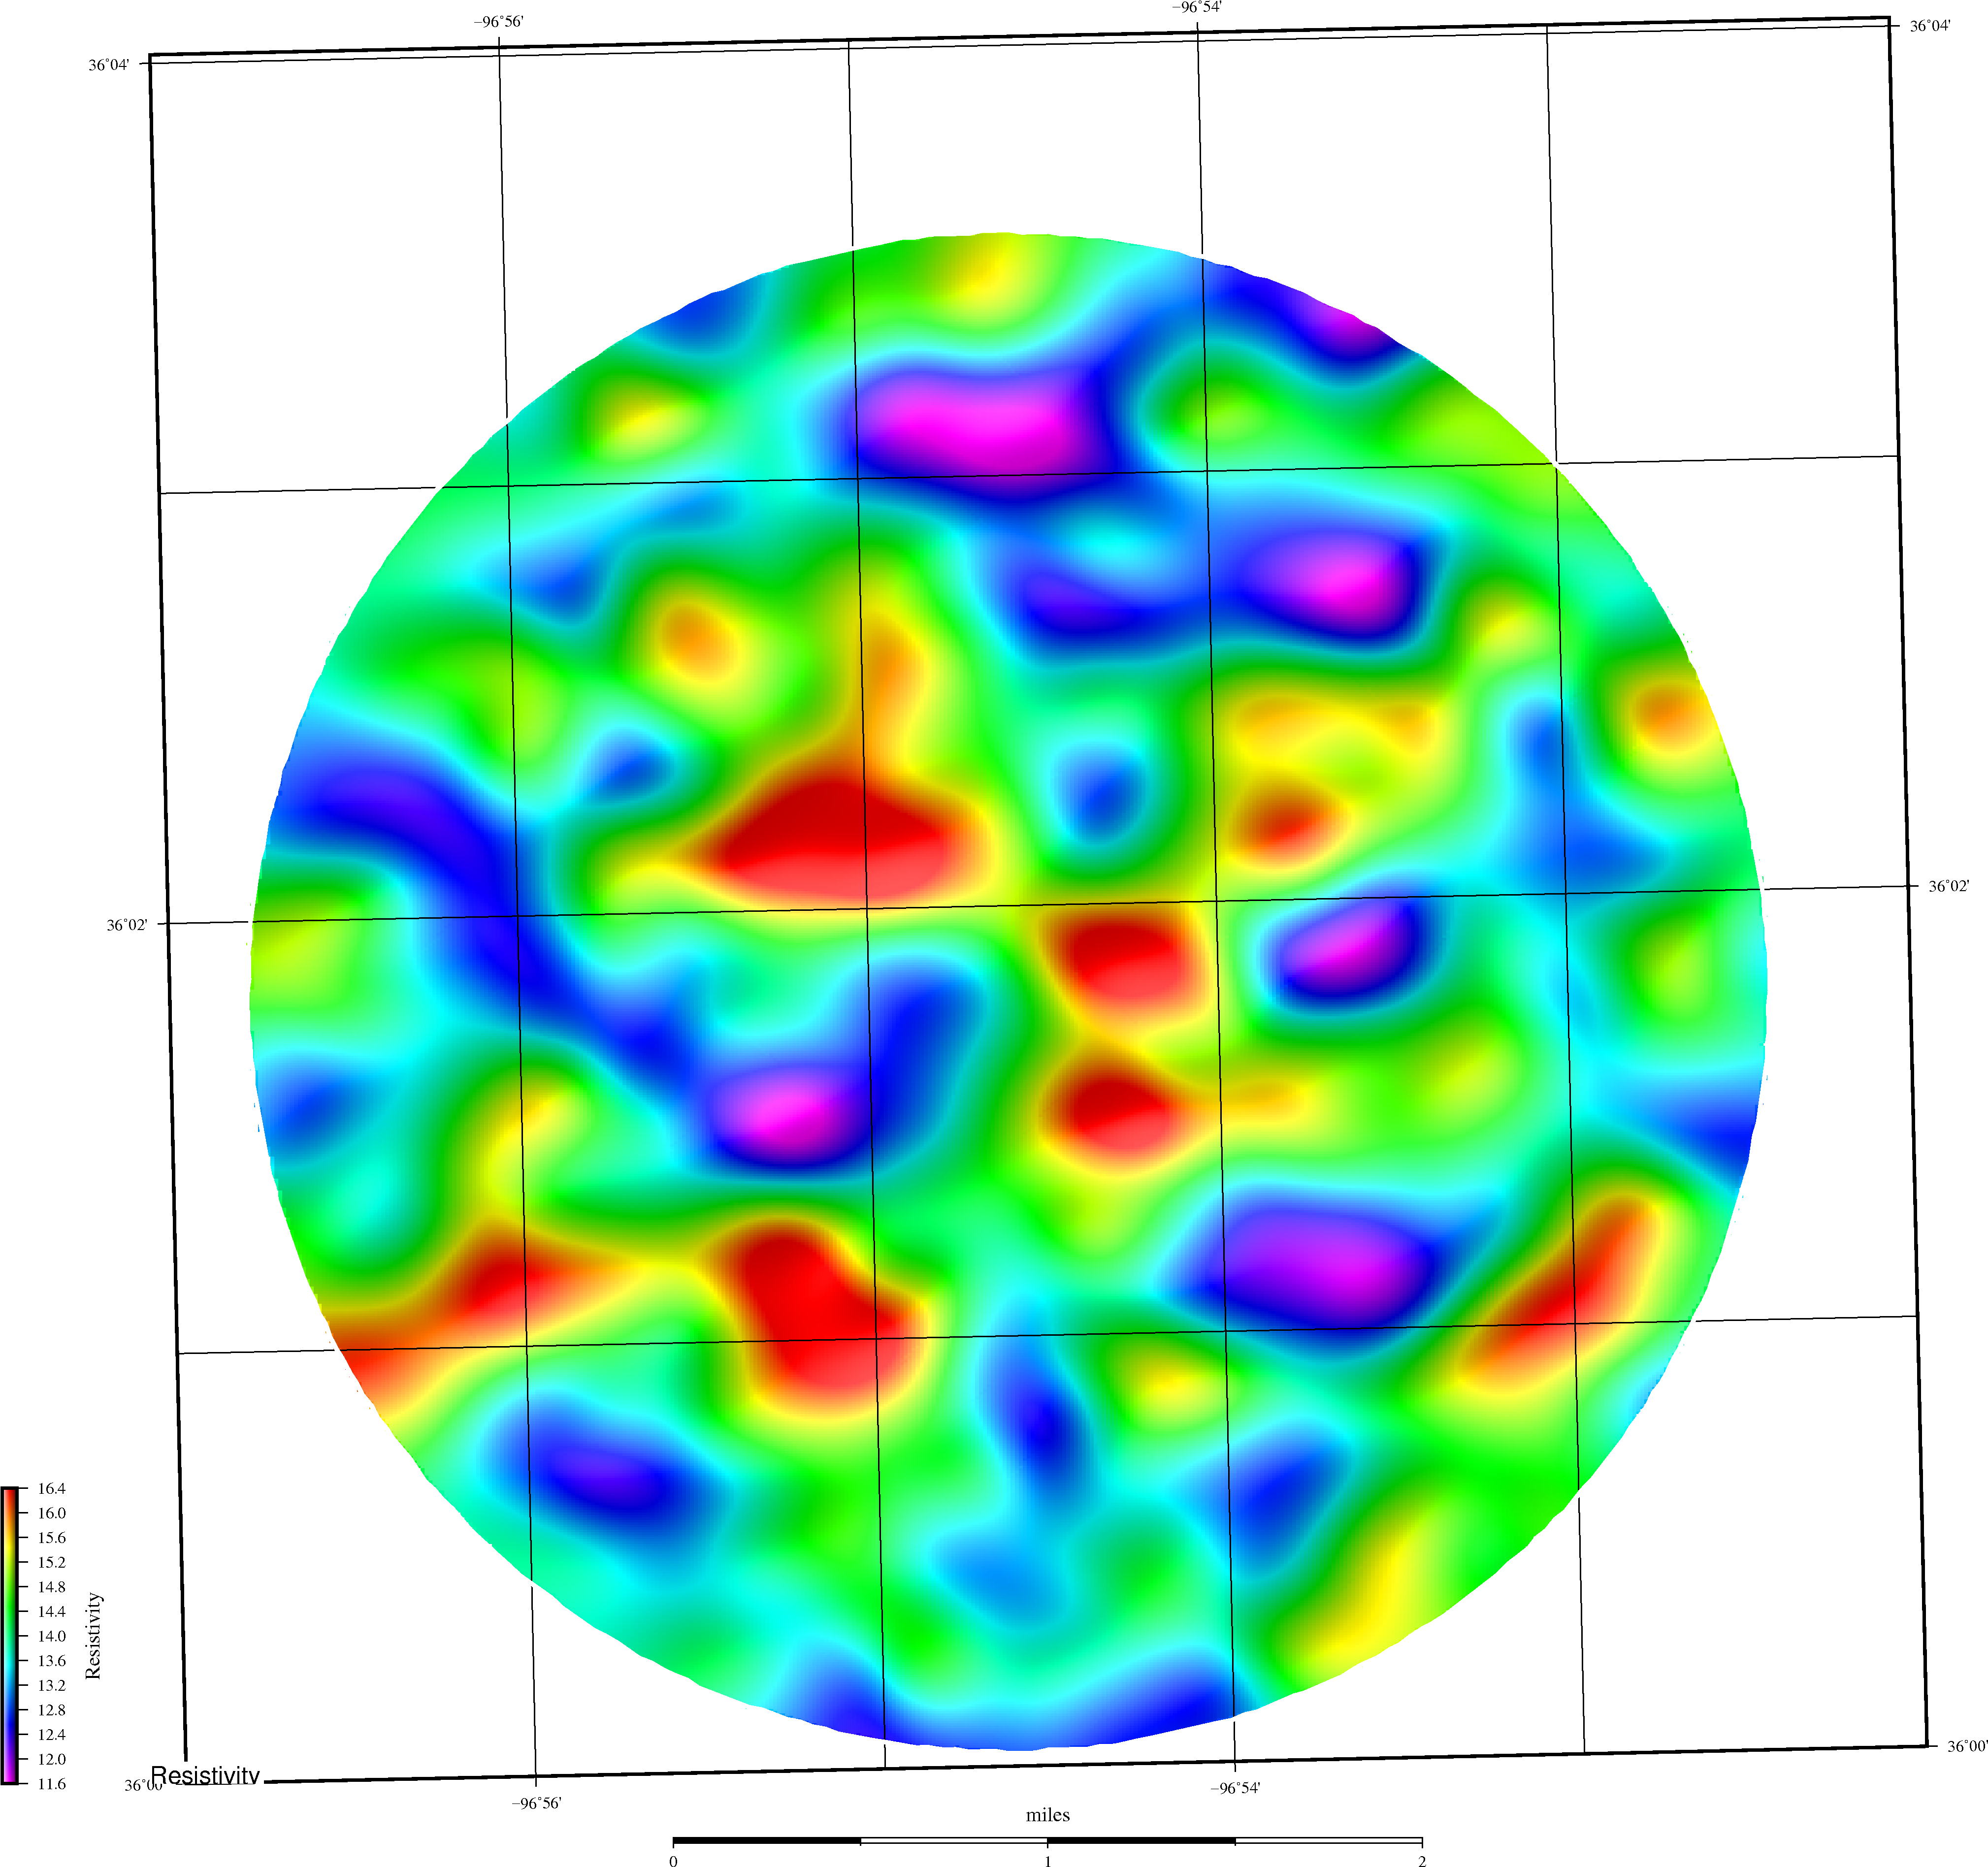
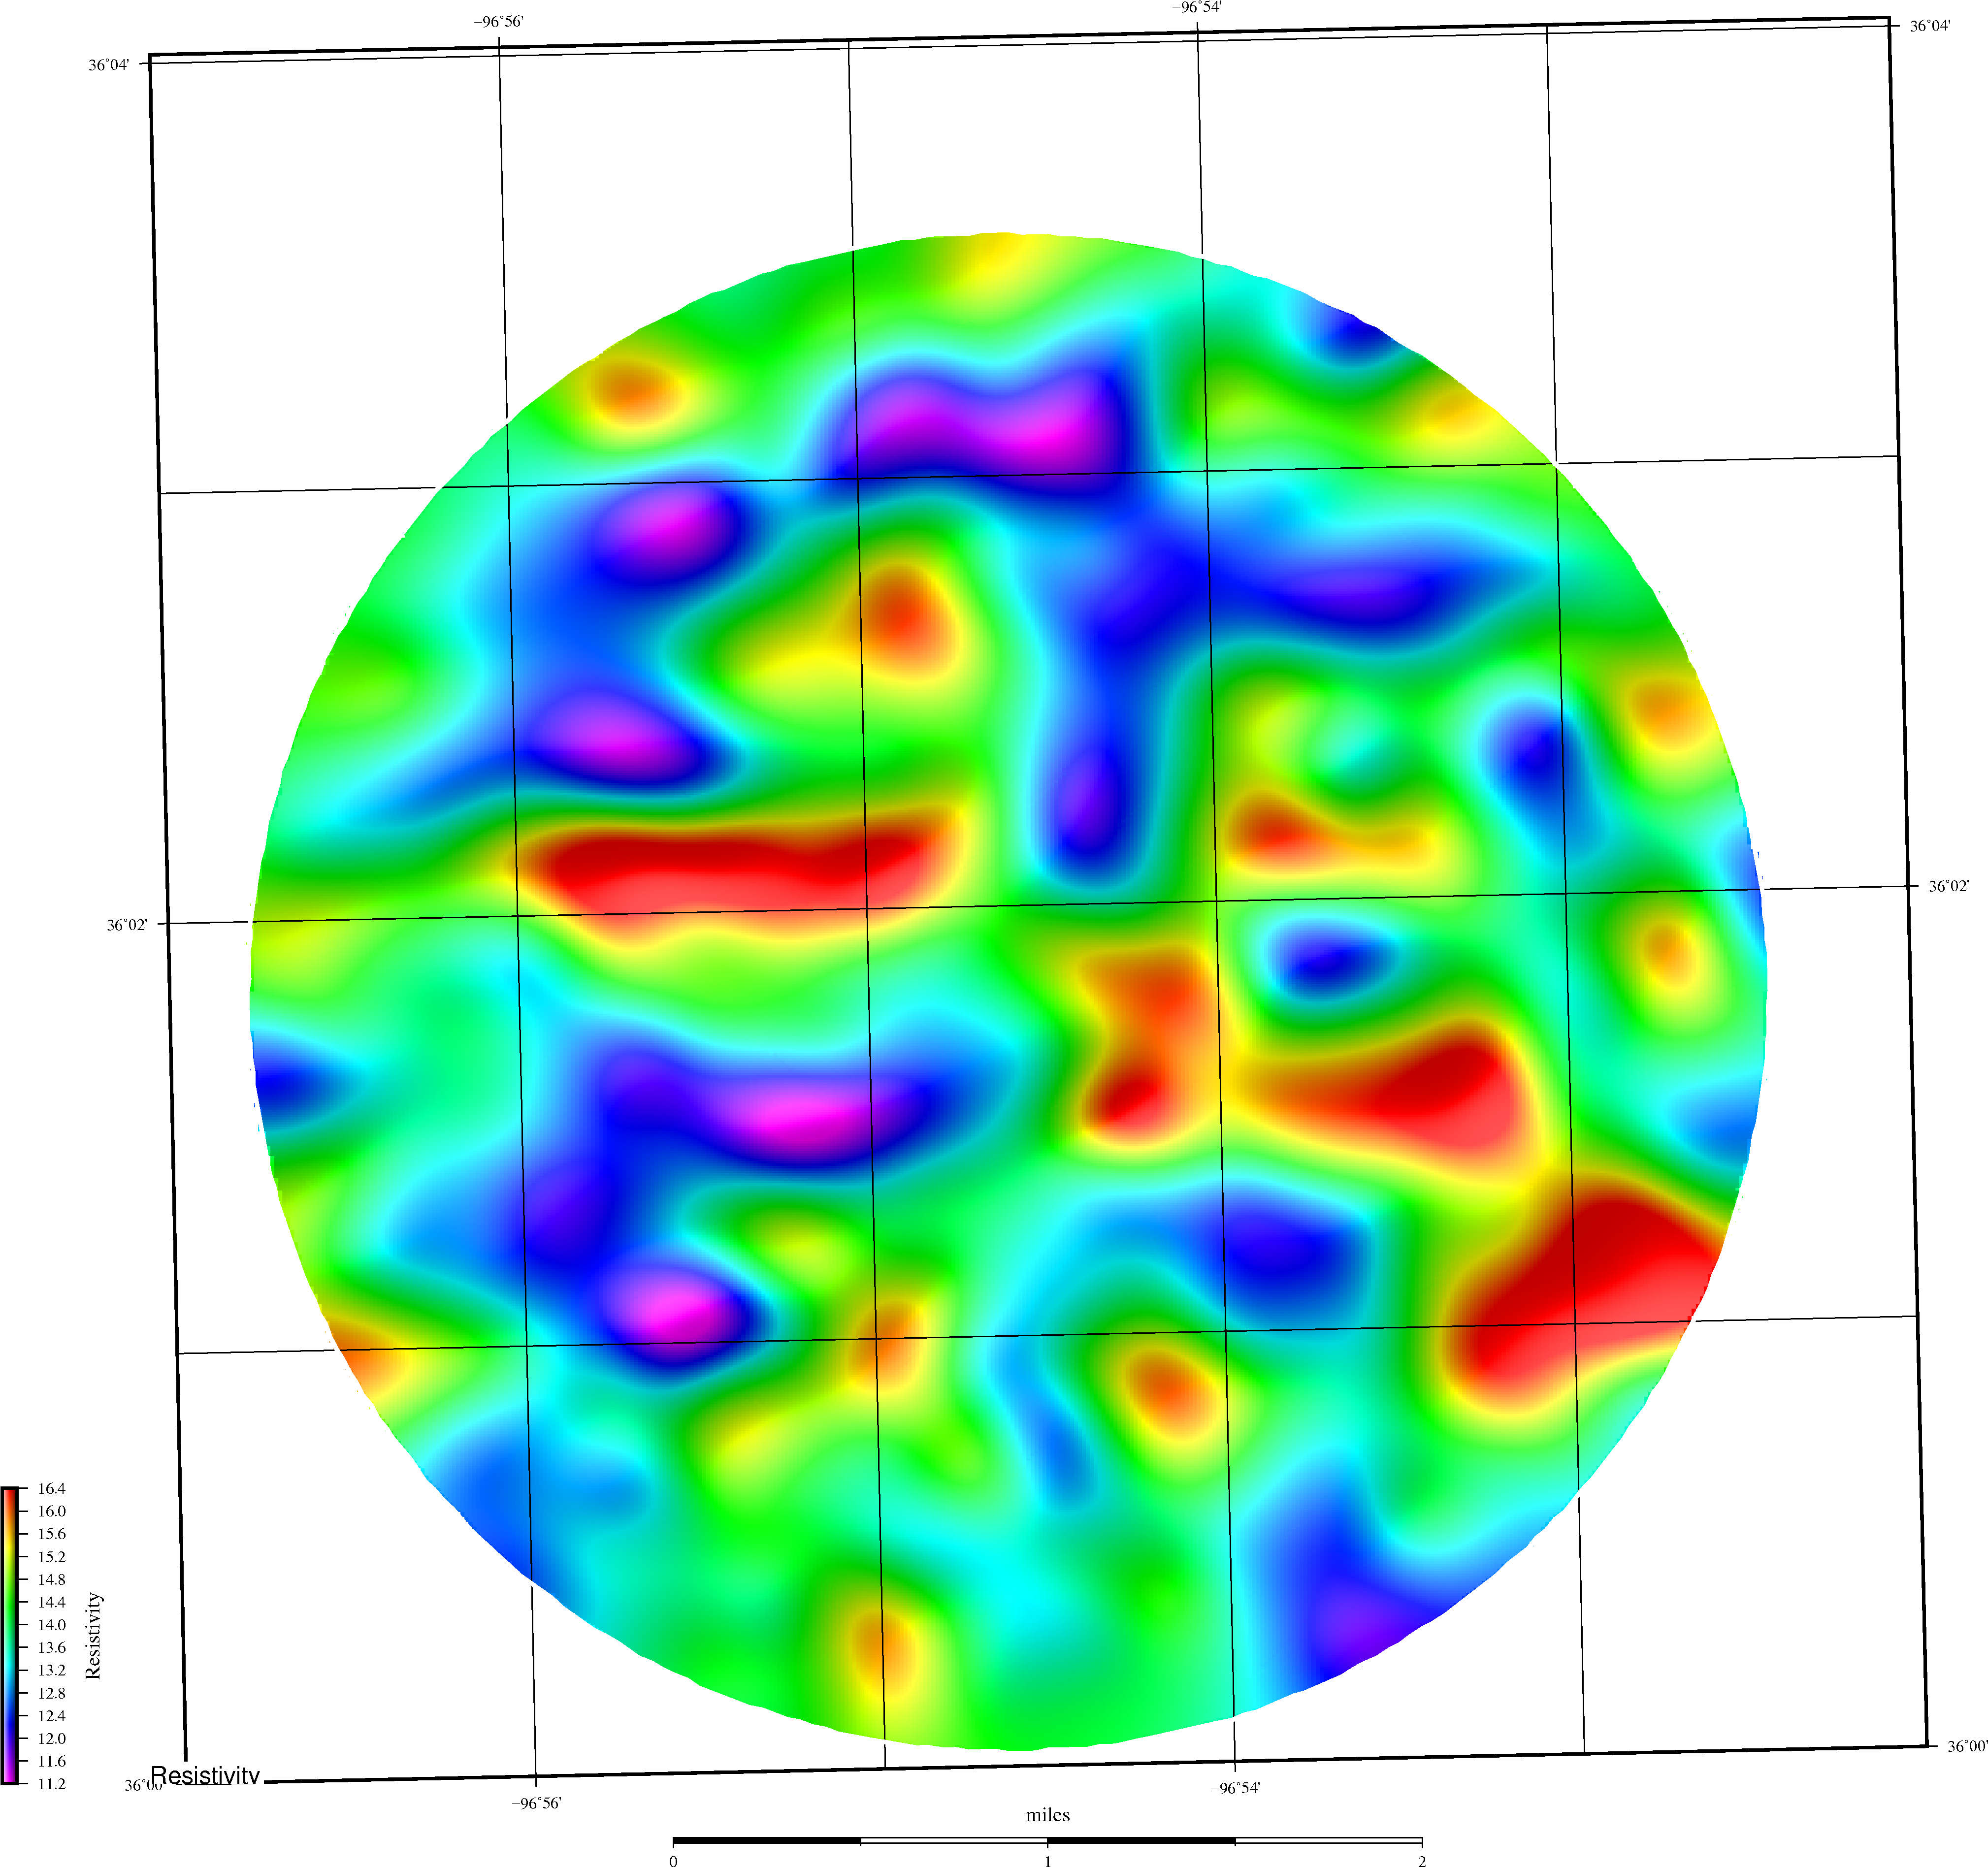
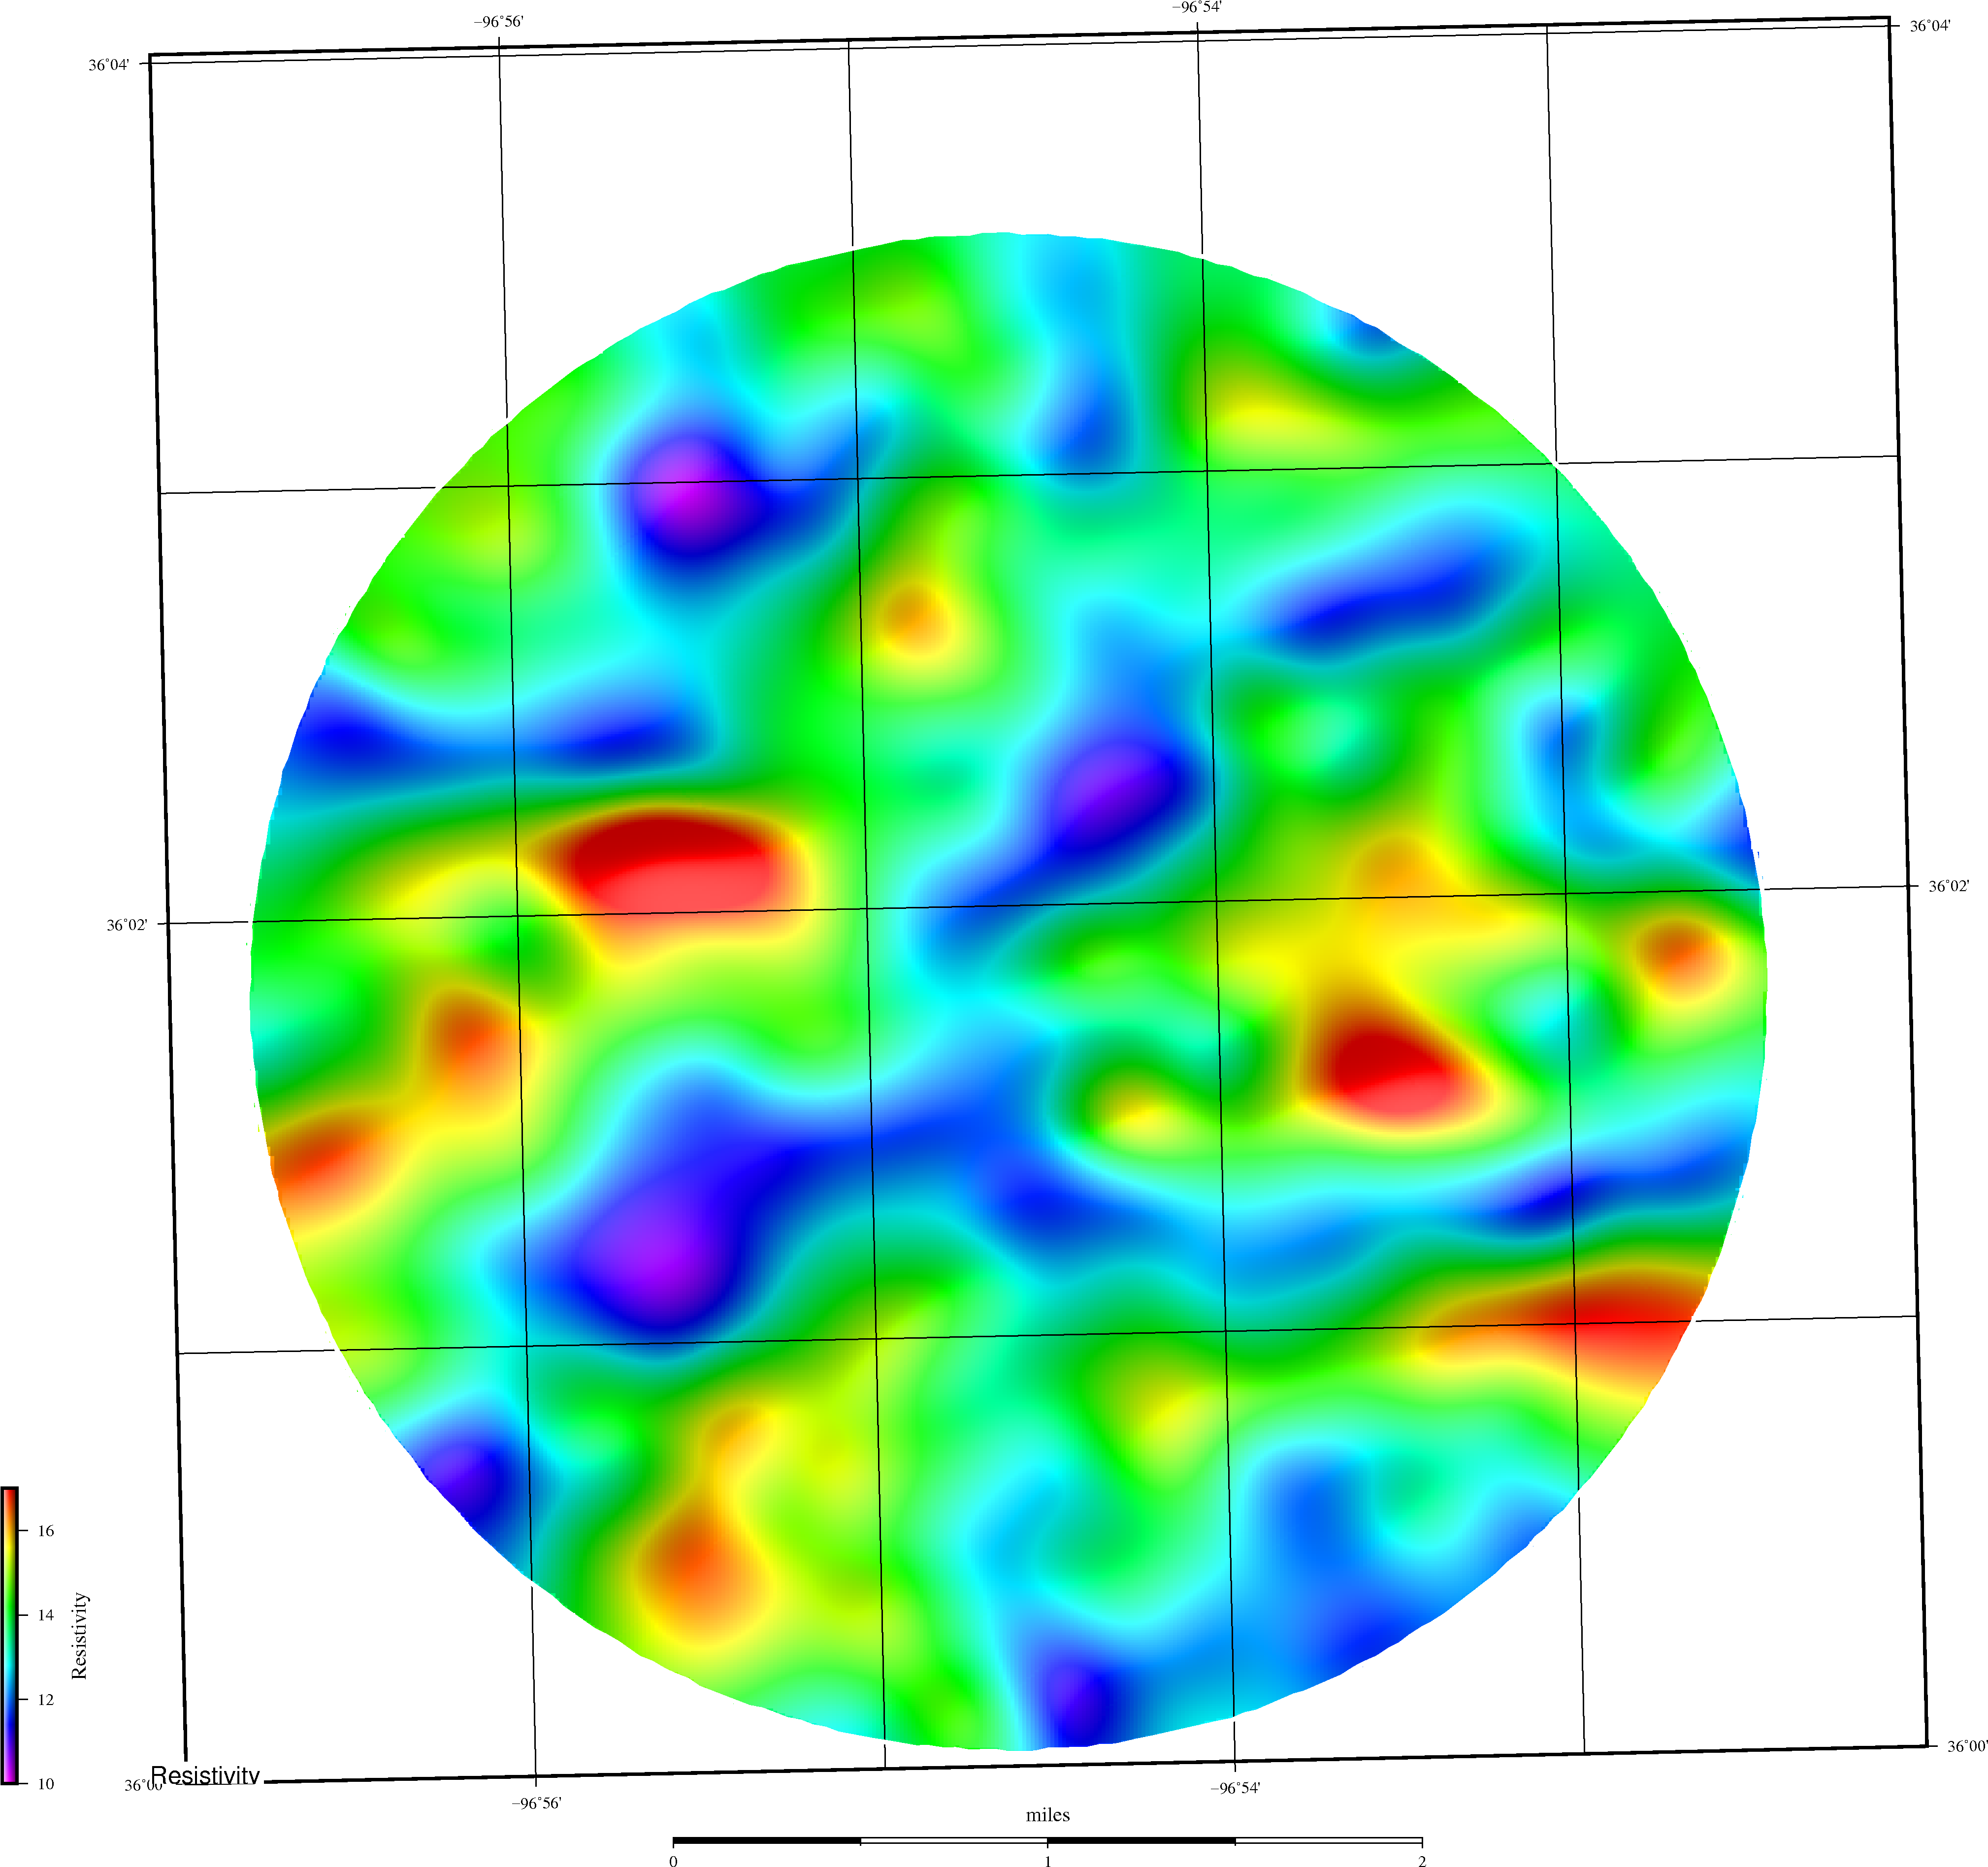
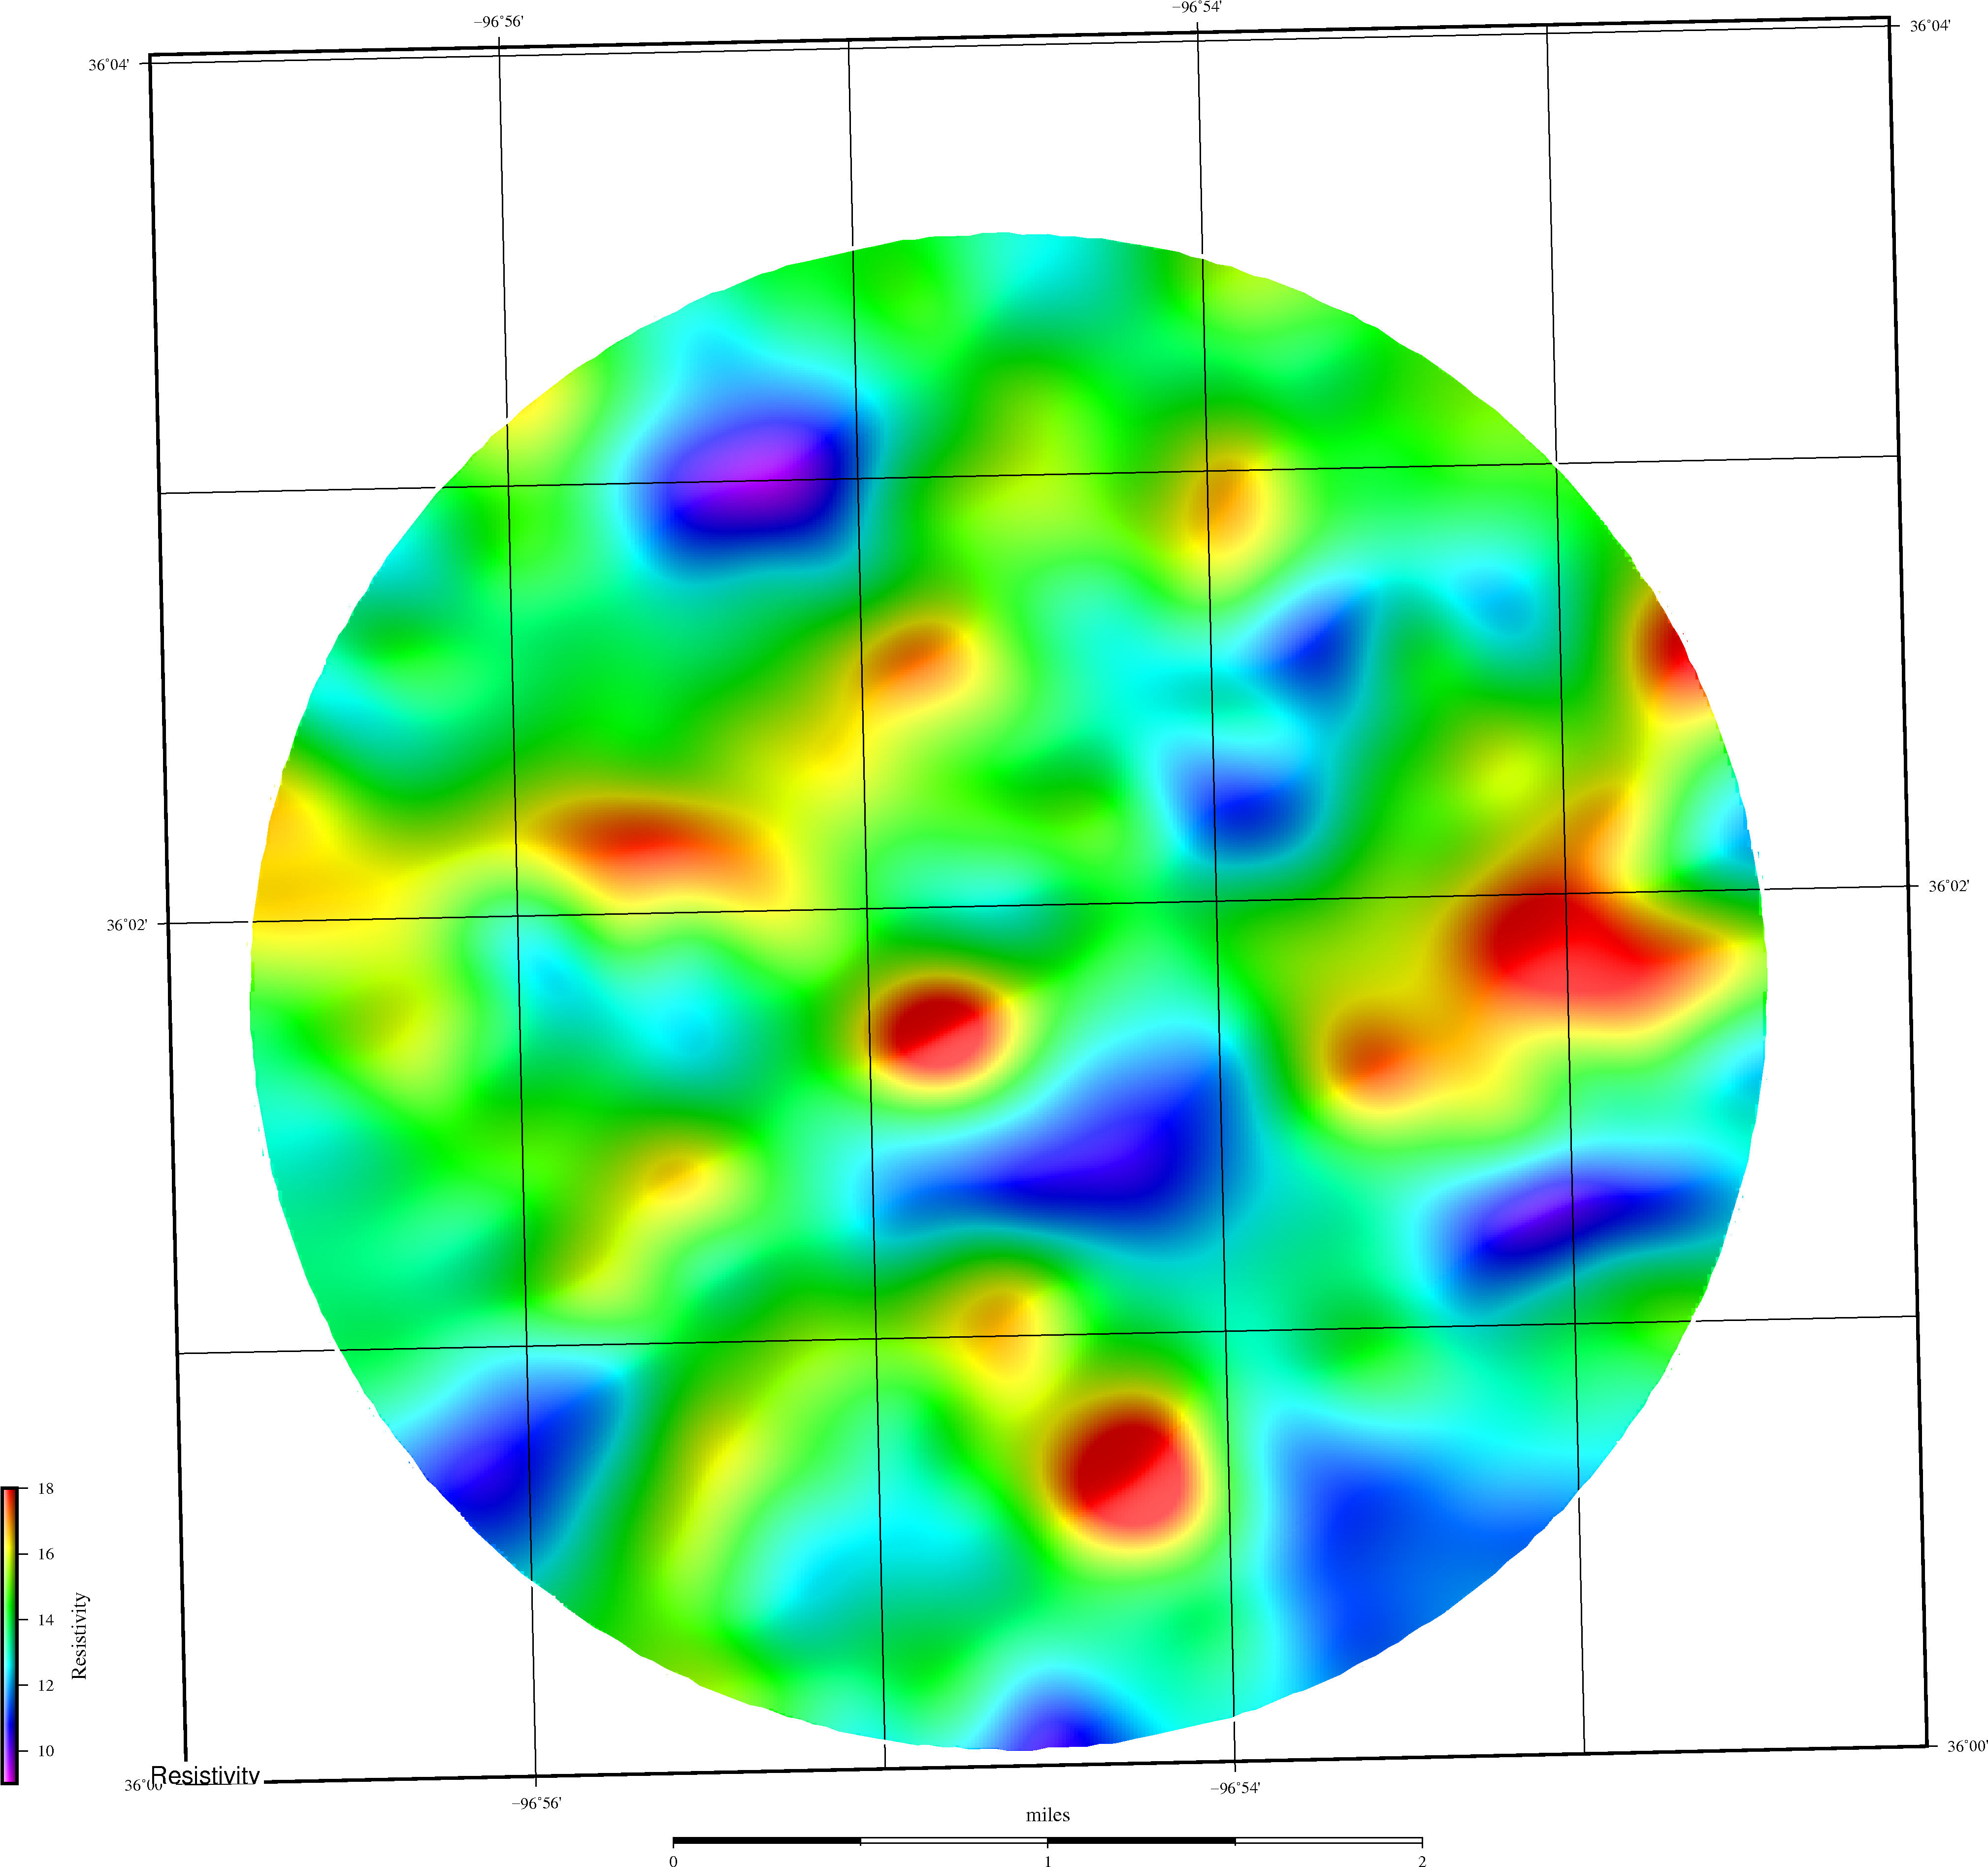
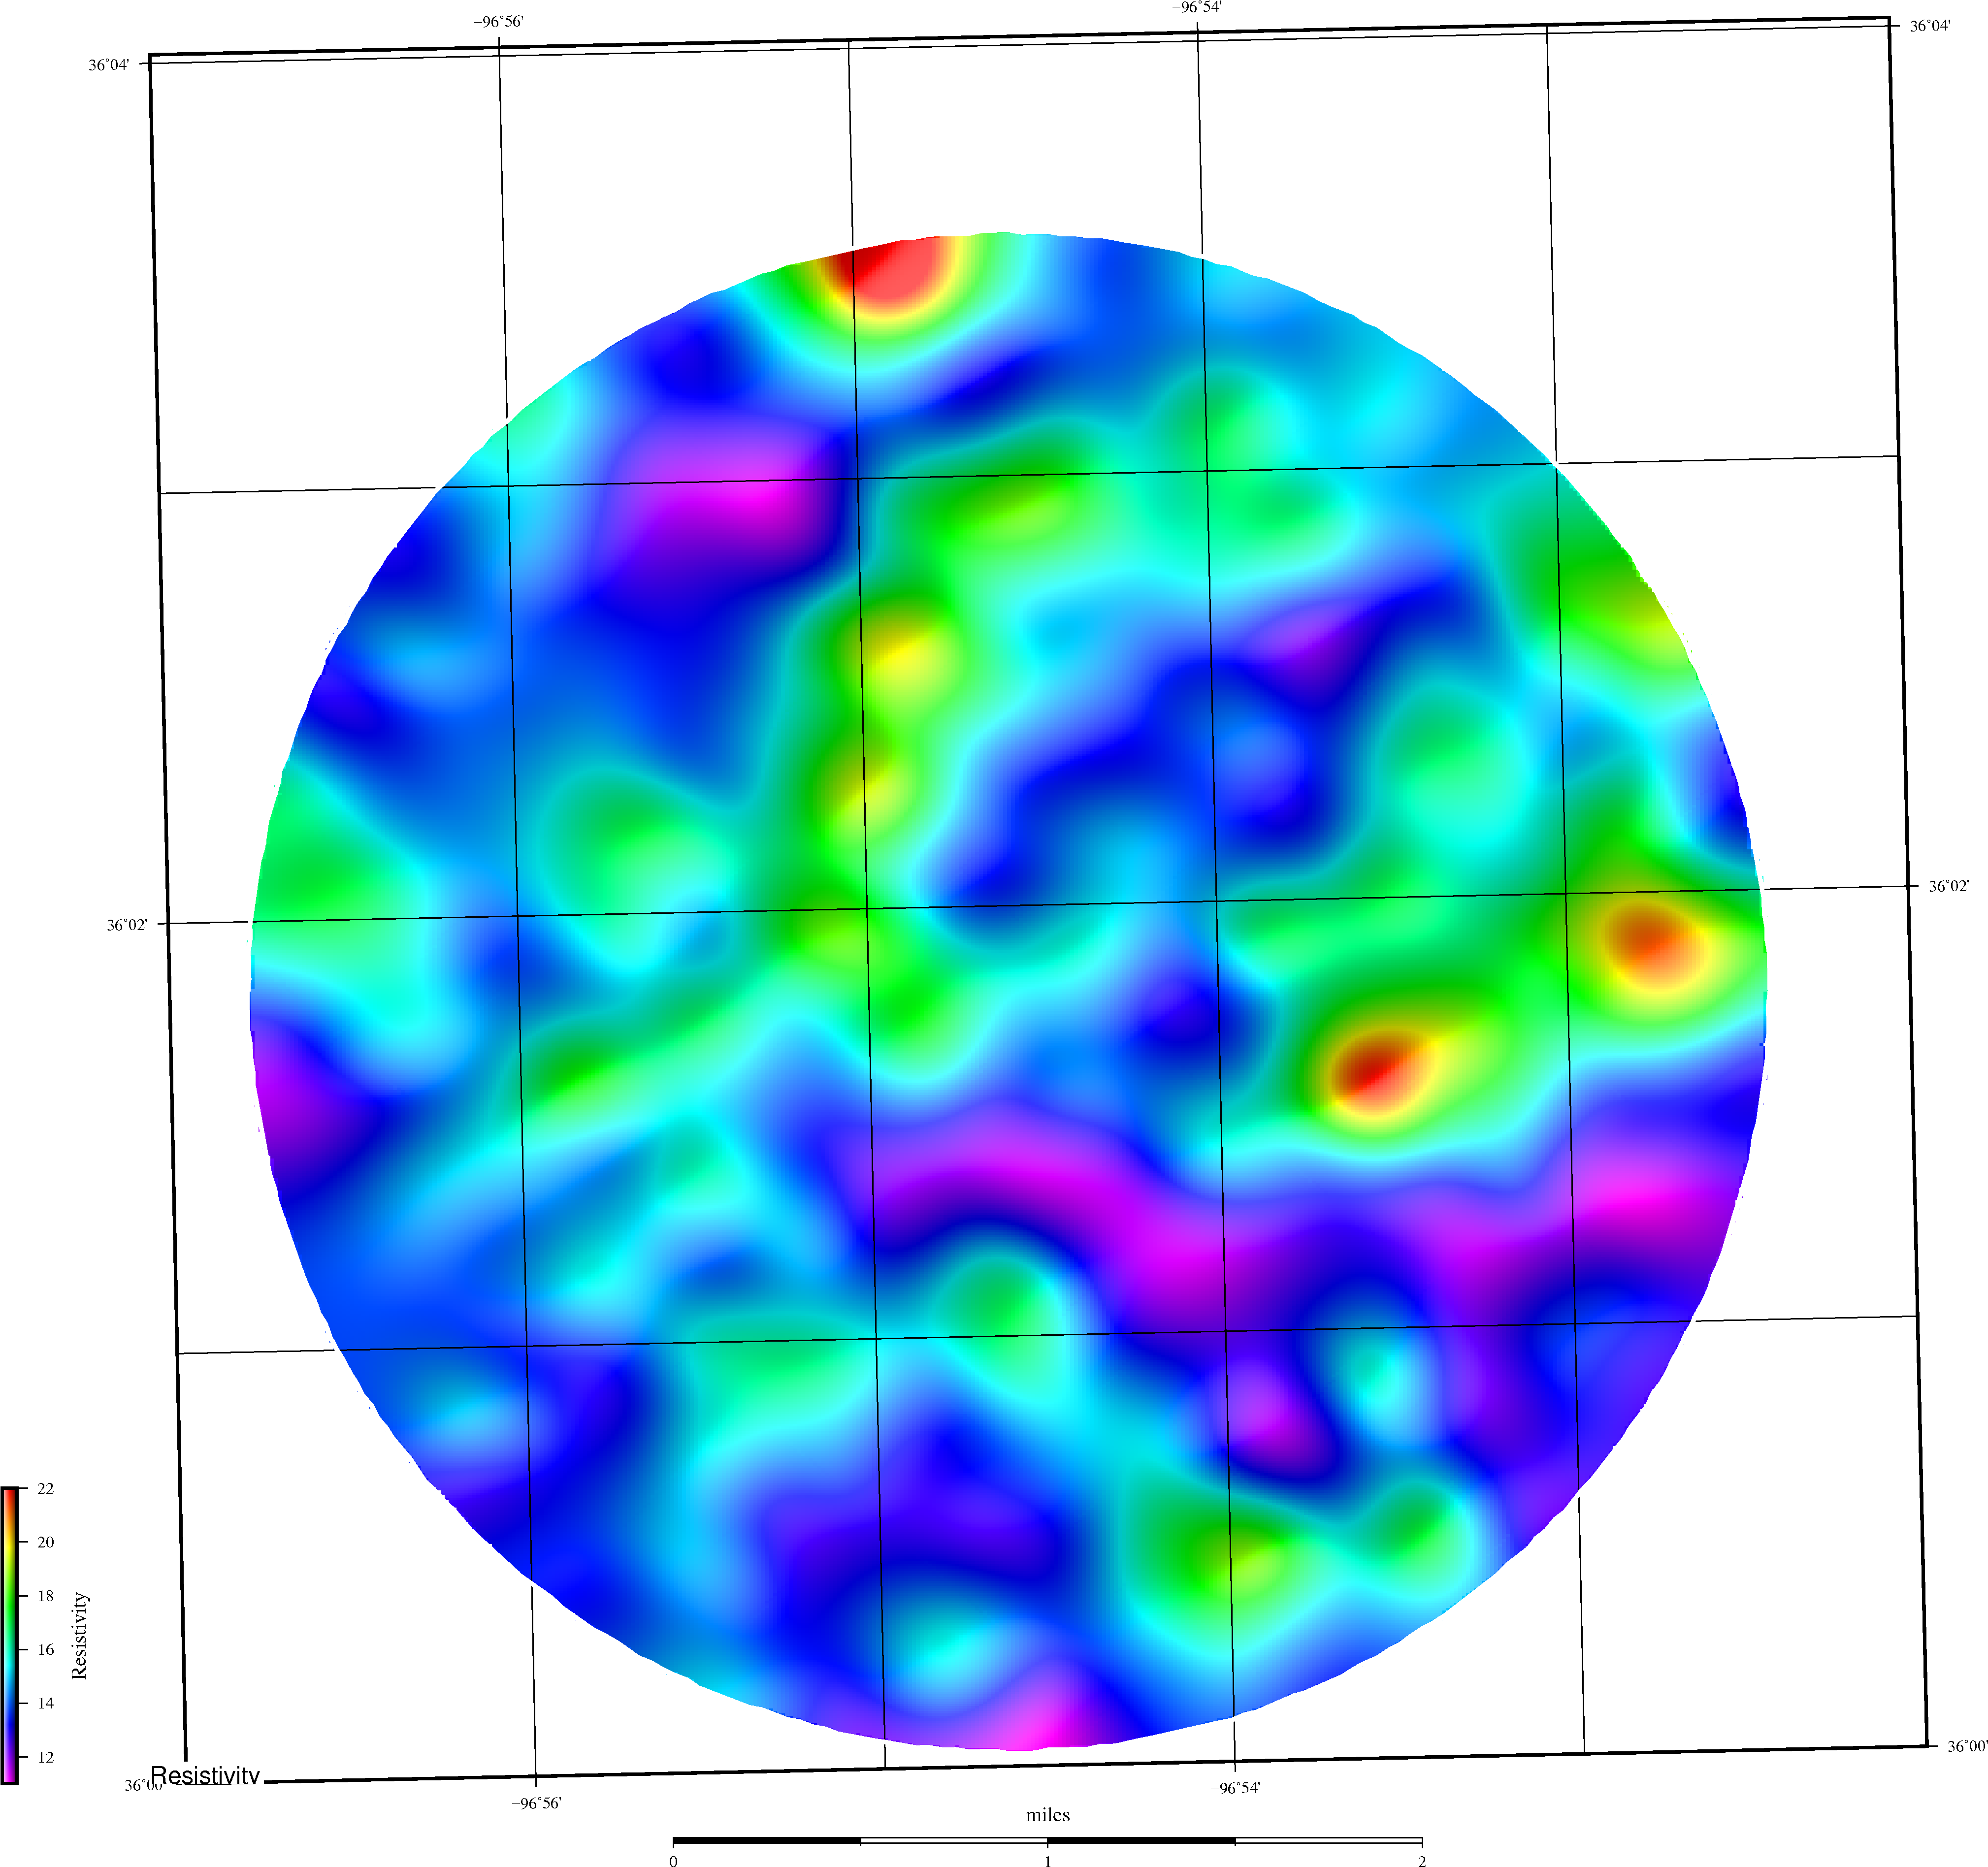
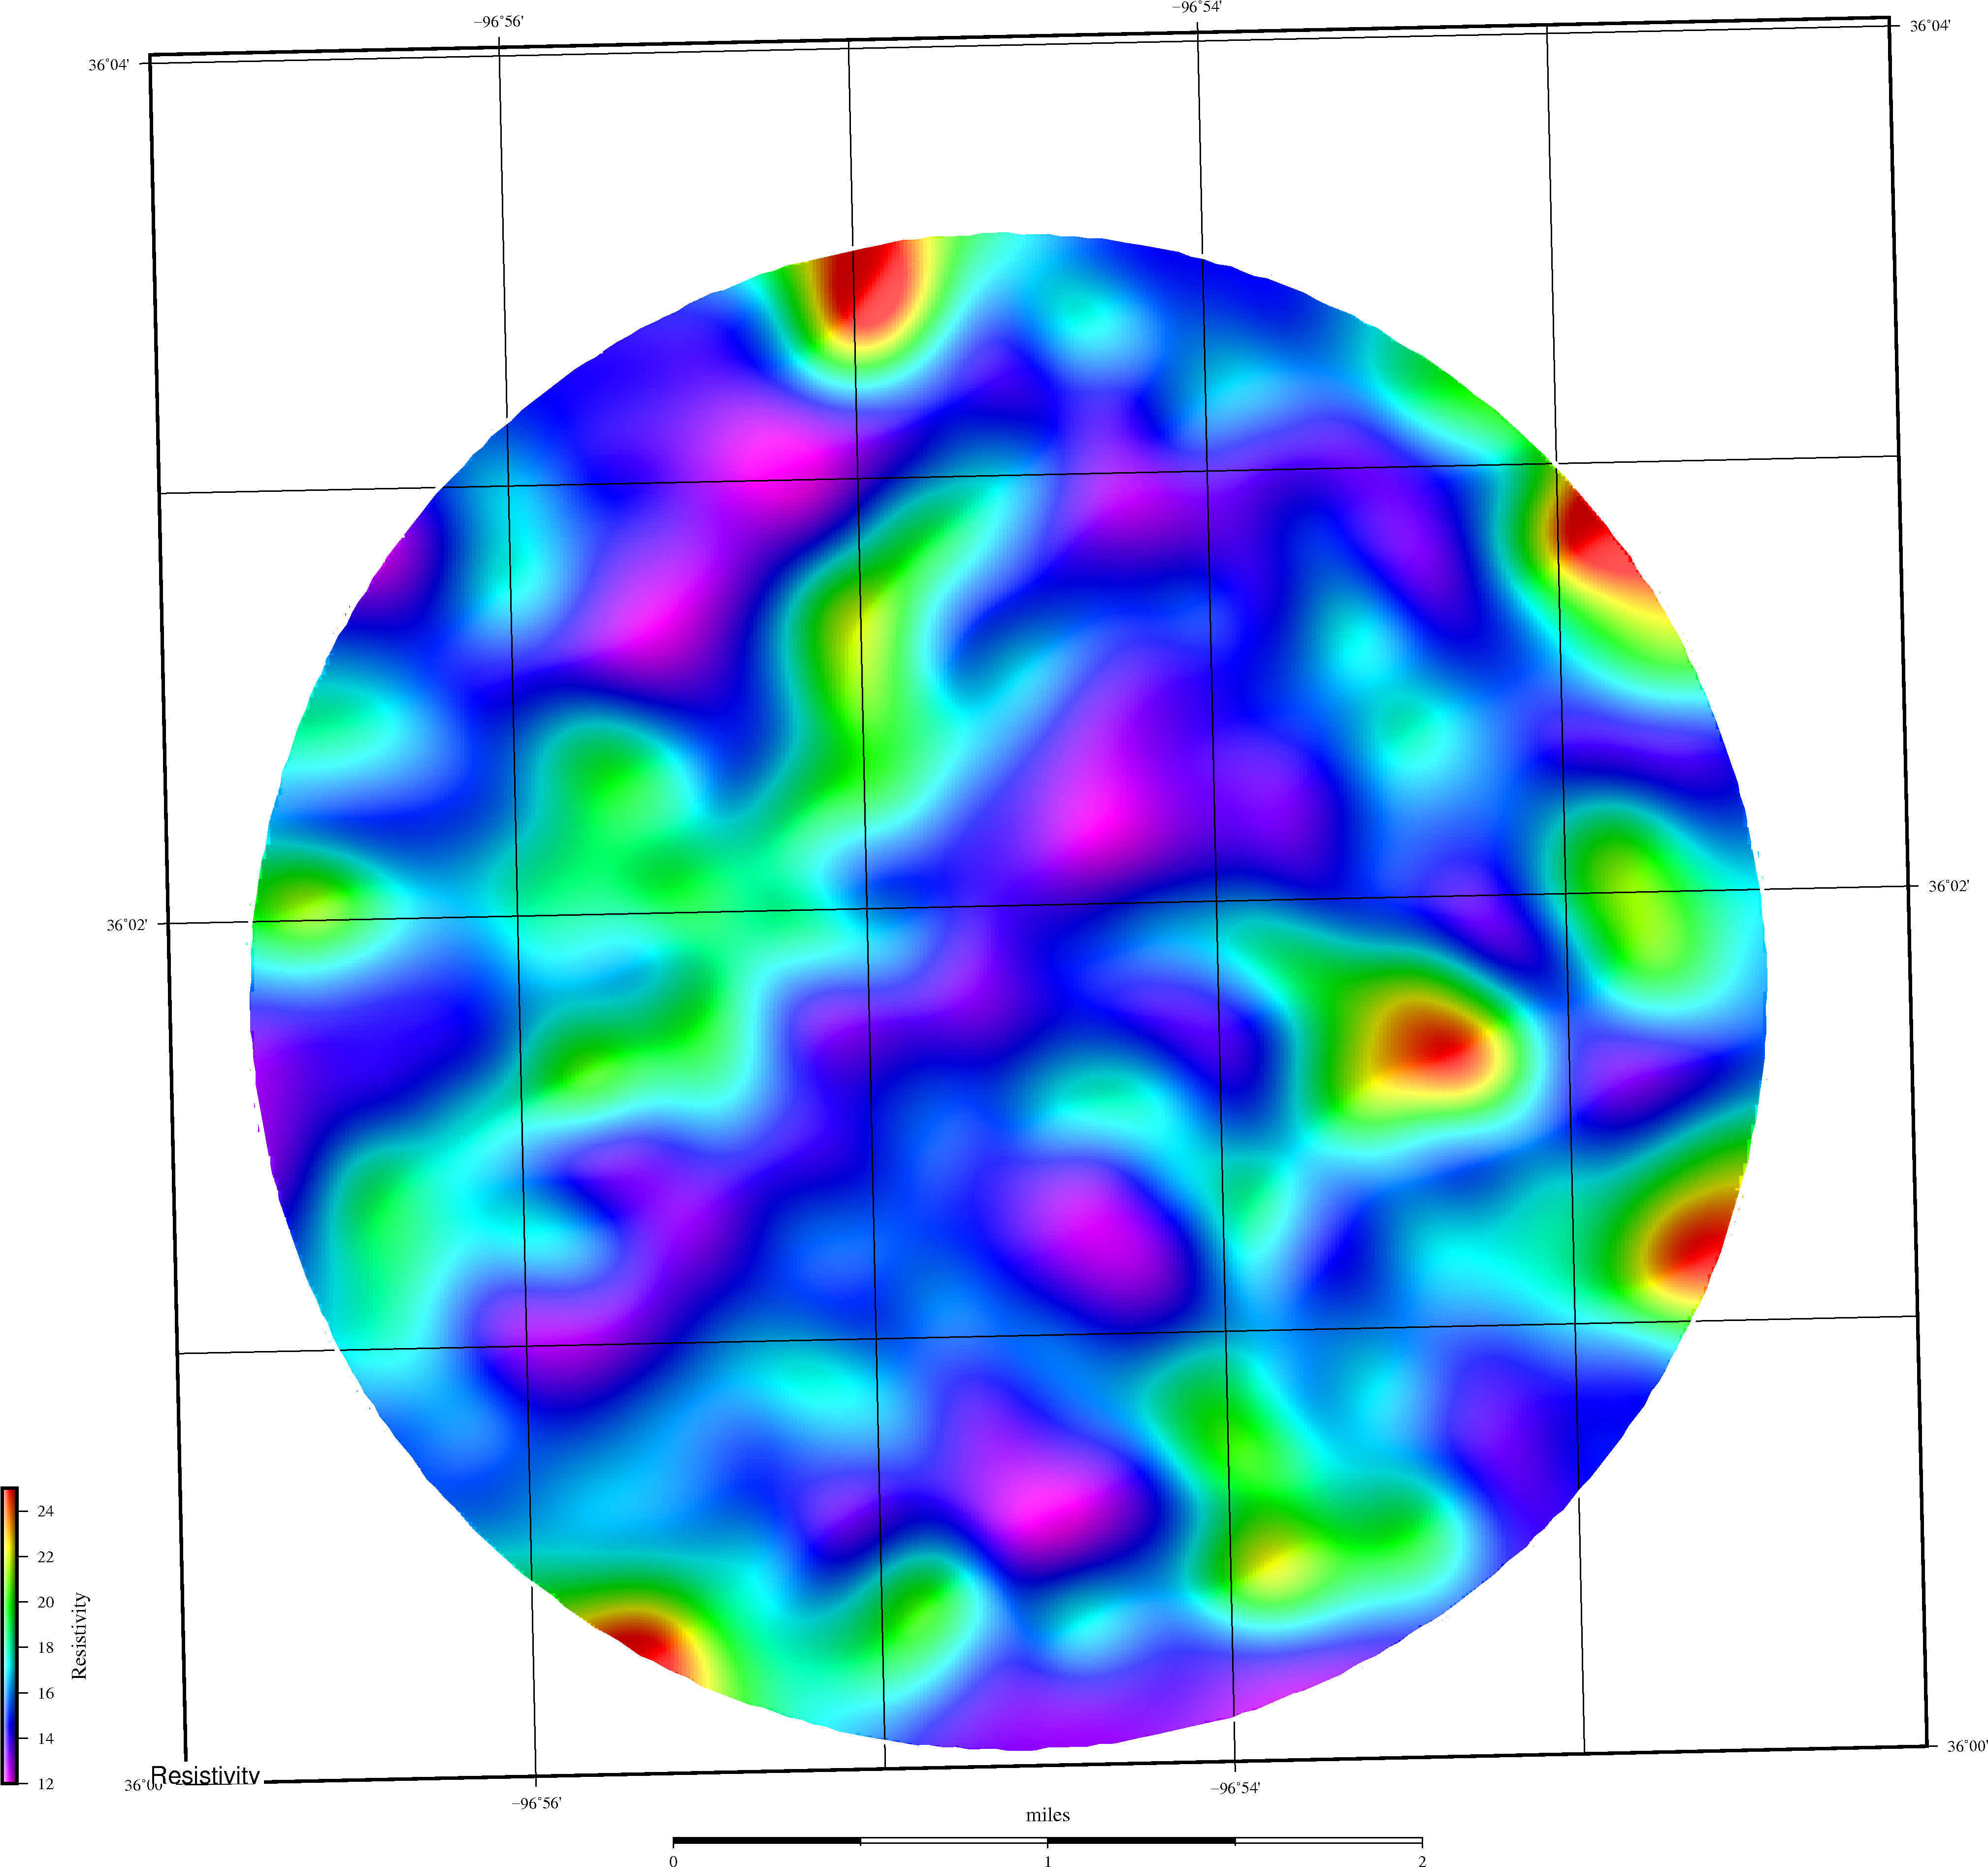
Outlines from time-lapse resistivity maps. |
| IG7 Resistivity 2008-2010 | IG7 Resistivity 2009-2011 |
IG7 Resistivity 2010-2012 | IG7 Resistivity 2011-2013 |
IG7 Resistivity 2012-2014 | IG7 Resistivity 2013-2015 |
IG7 Resistivity 2014-2016 | IG7 Resistivity 2015-2018 |
IG7 Resistivity 2016-2017 | Outlines overlaid on fault map. |
 . . . Index of Lightning Analysis Geothermal Exploration & Earthquake Prediction Examples
 . . . Index of Lightning Analysis Geothermal Exploration & Earthquake Prediction Examples