![](01_Lightning_Analysis_Houston_Area.png) | ![](02_Rise-Time_Geomorphology_Houston_Area.png) |
![](03_Peak-Current_Geomorphology_Houston_Area.png) | ![](04_Peak-to-Zero_Geomorphology_Houston_Area.png) |
![](05_Milam_County_Texas_Point-Bar_Interpretation.png) | ![](06_LIDAR_ meanders_RRT_Dk_Bl_HD_JPG_2.jpg) |
![](07_riserate_ig7p020141208+LIDAR_meanders.jpg) | ![](08_riserate_ig7p020141208a_geology_map.jpg) |
![](09_Louisiana_Salt_Domes_Example.png) | ![](Lightning_Near_Large_Powerlines_in_Farmland_iStock_000009564317_Medium.jpg) |
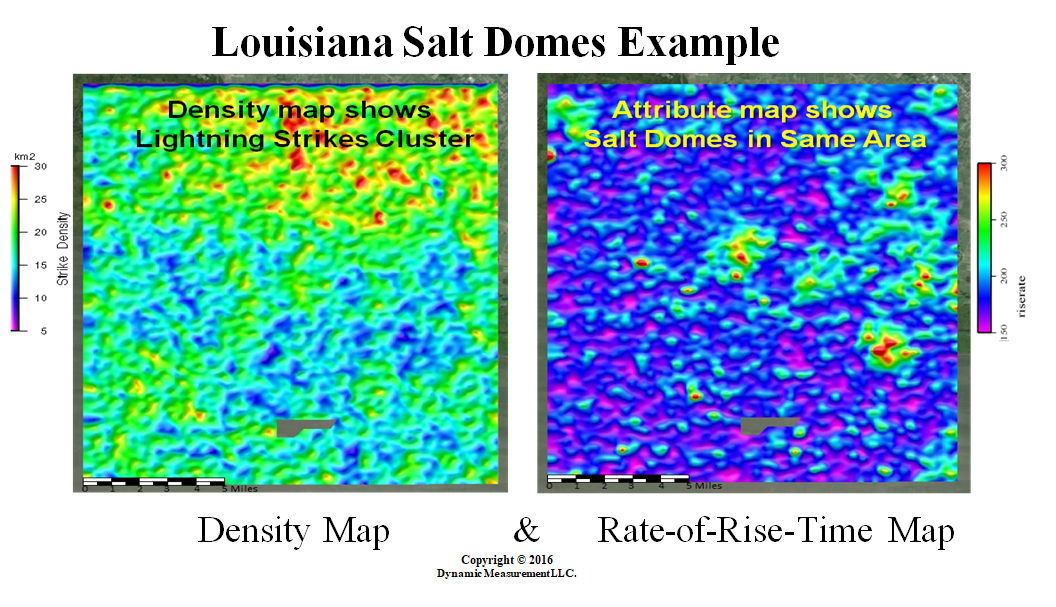
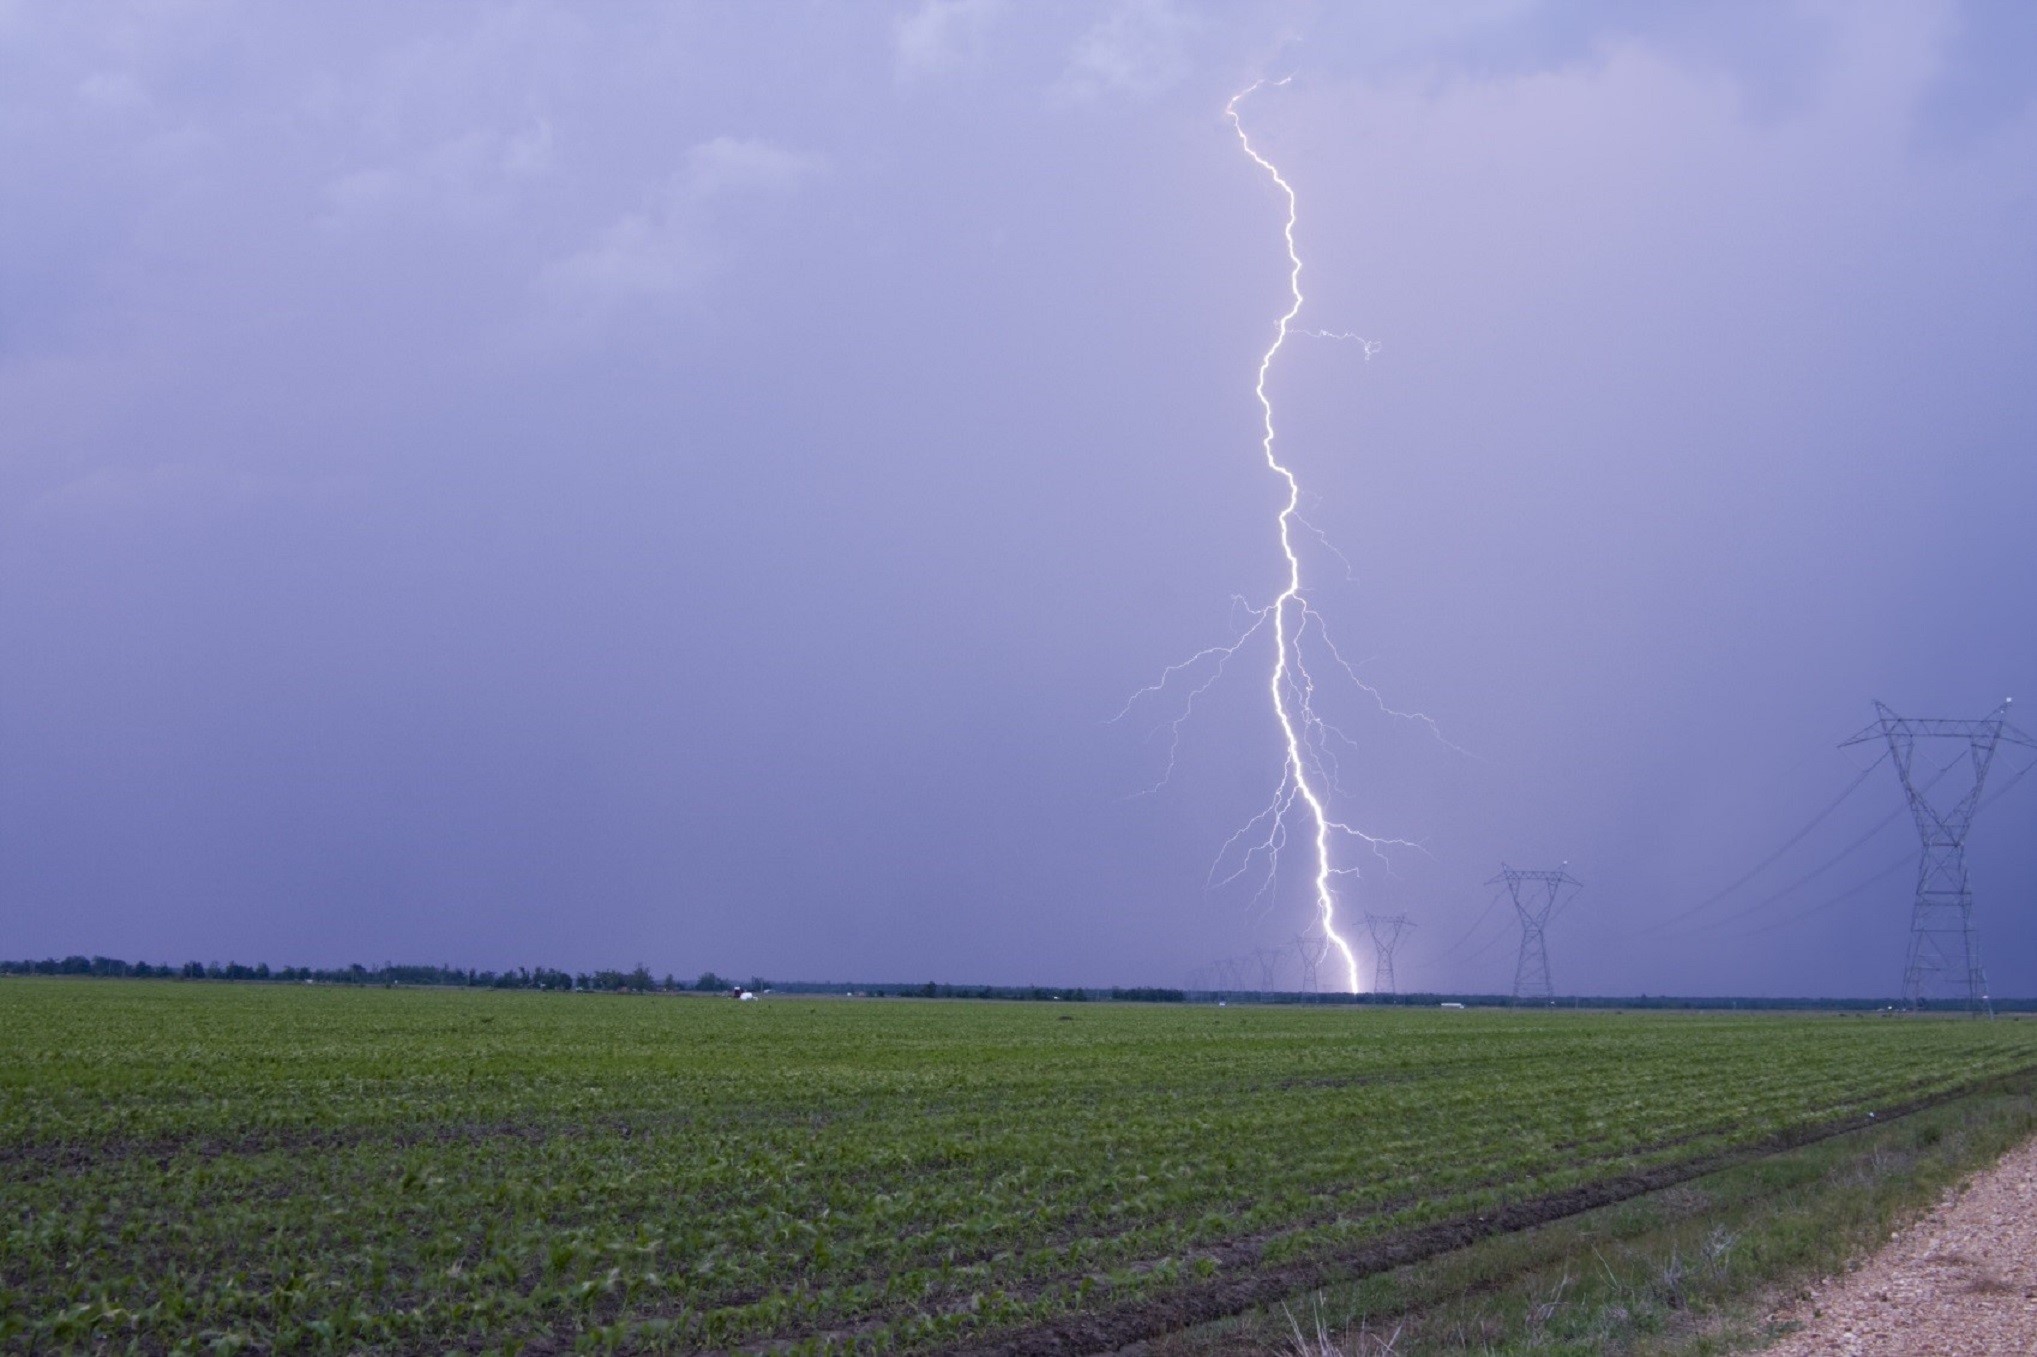
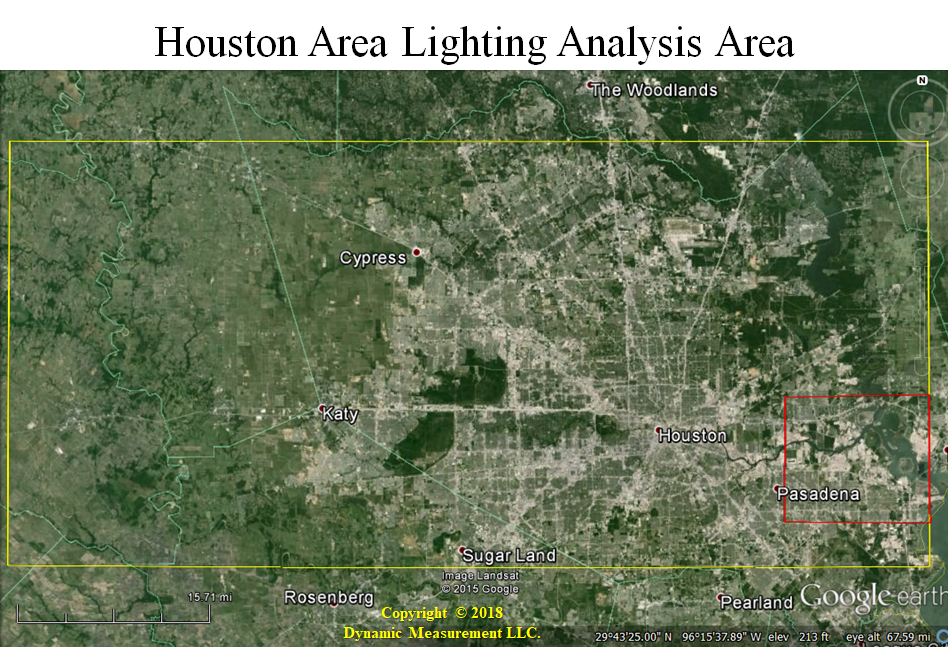
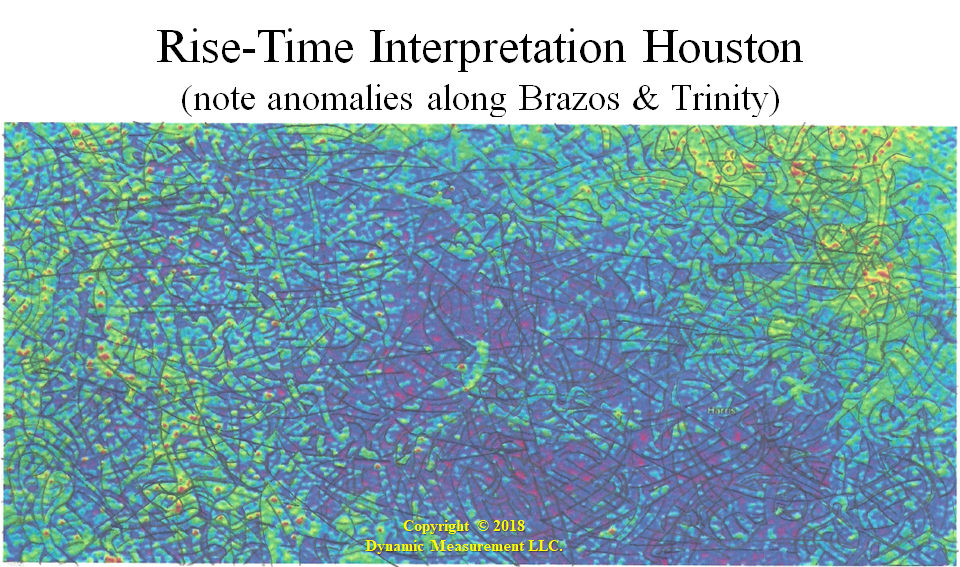
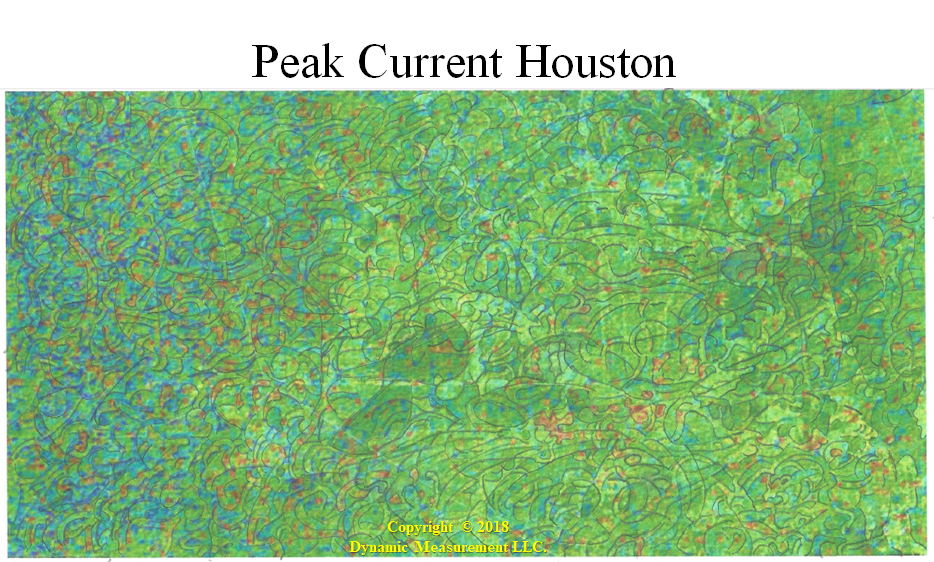
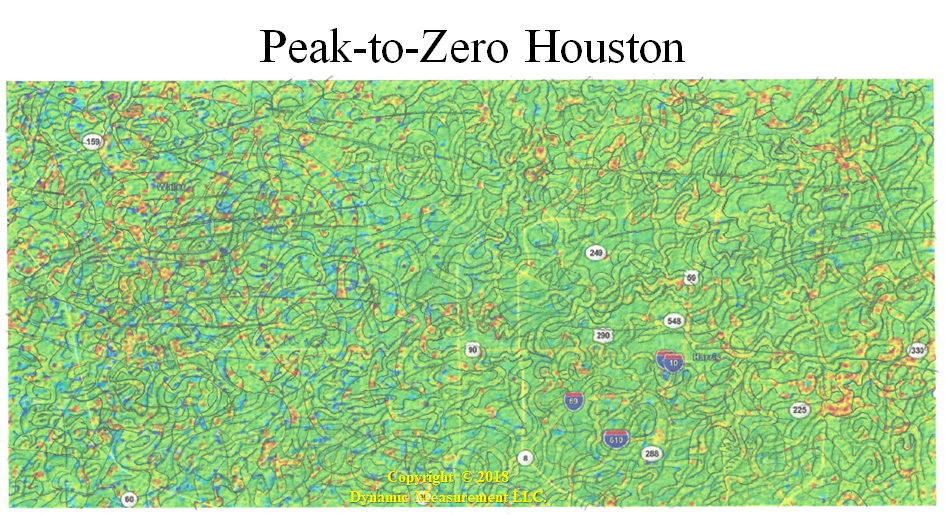
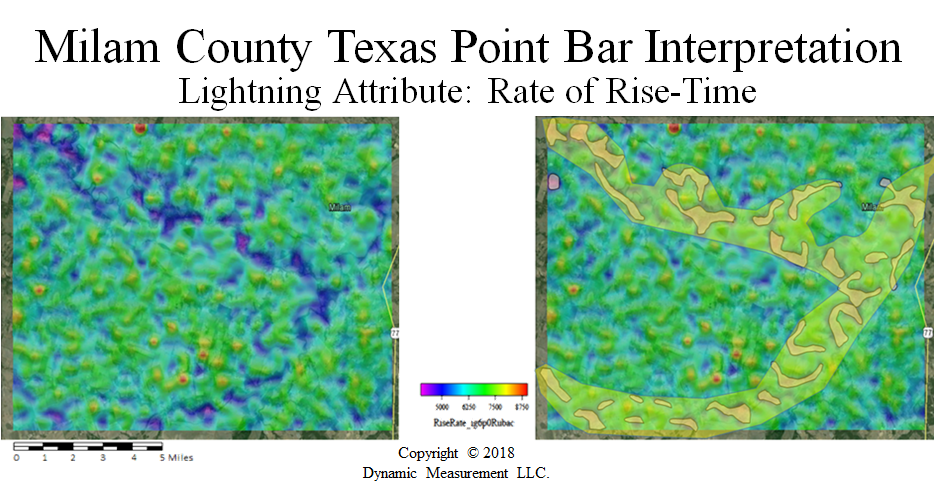
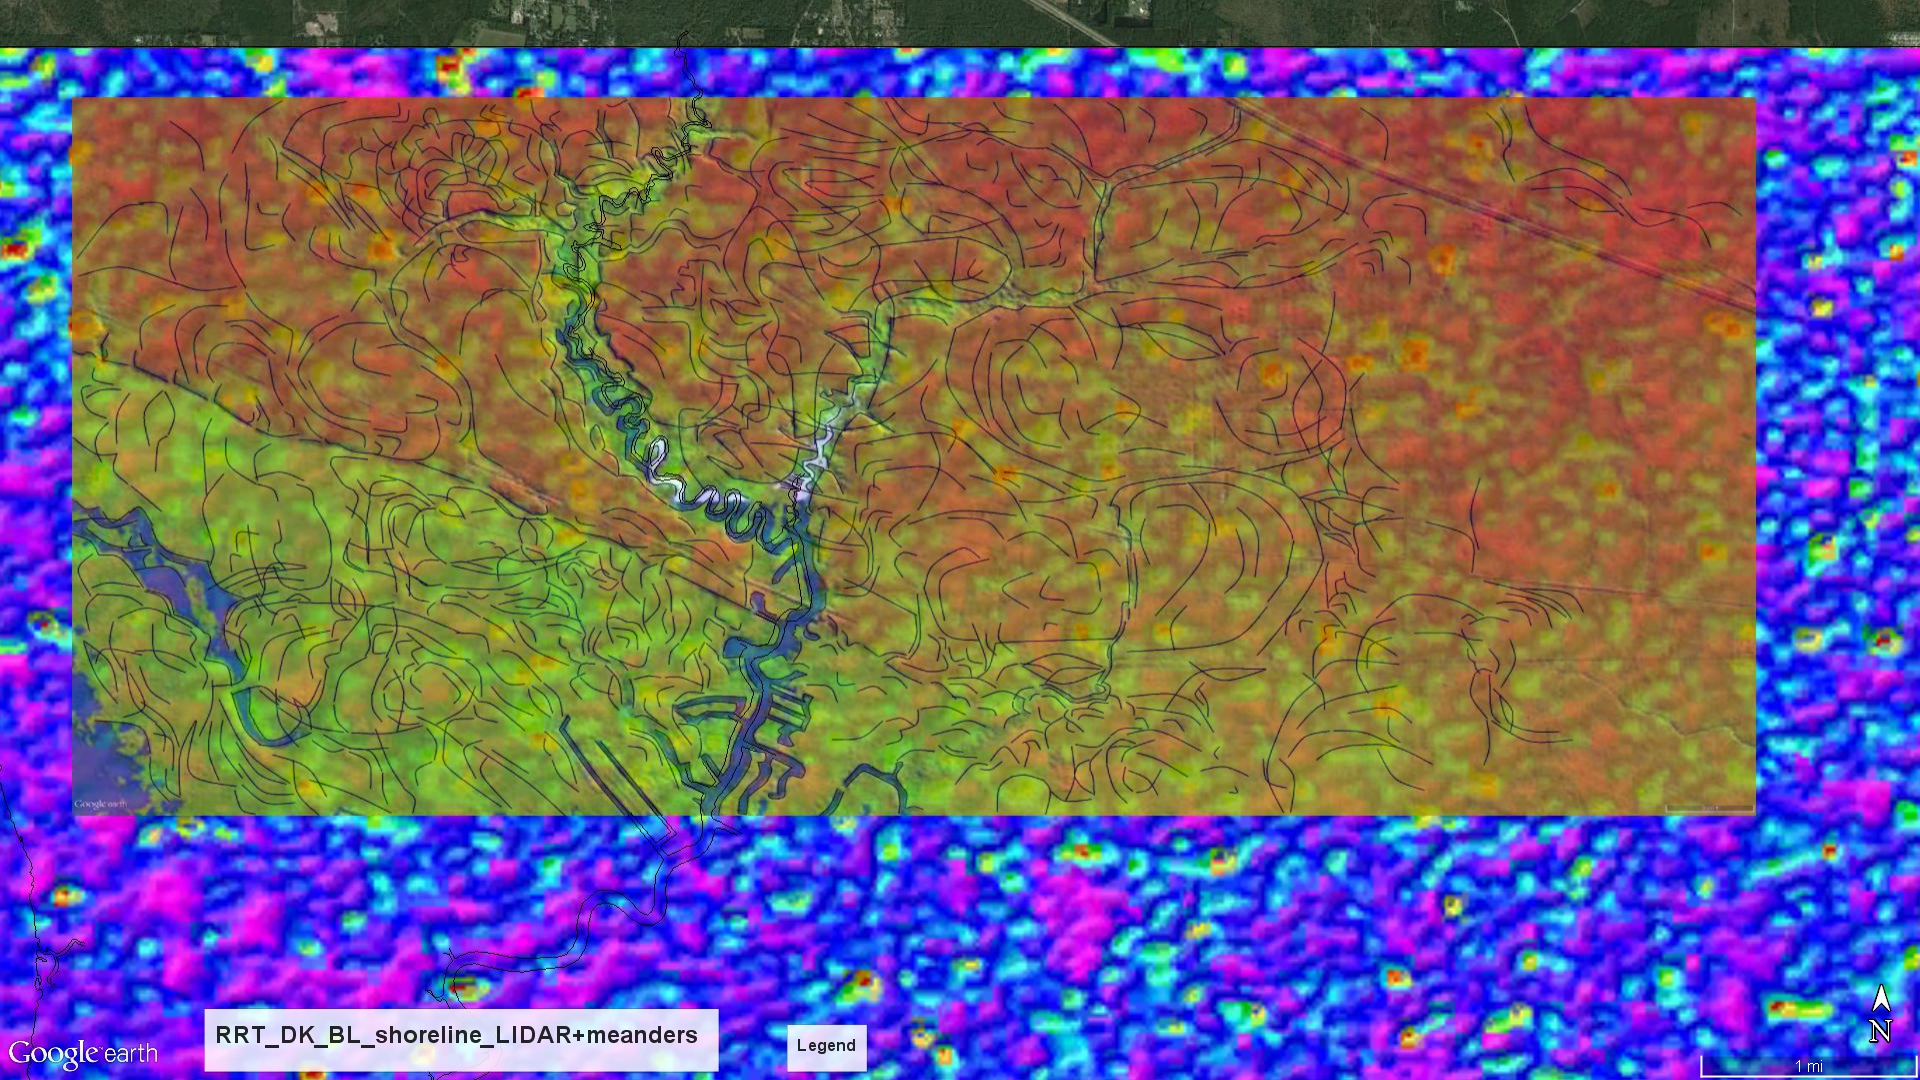
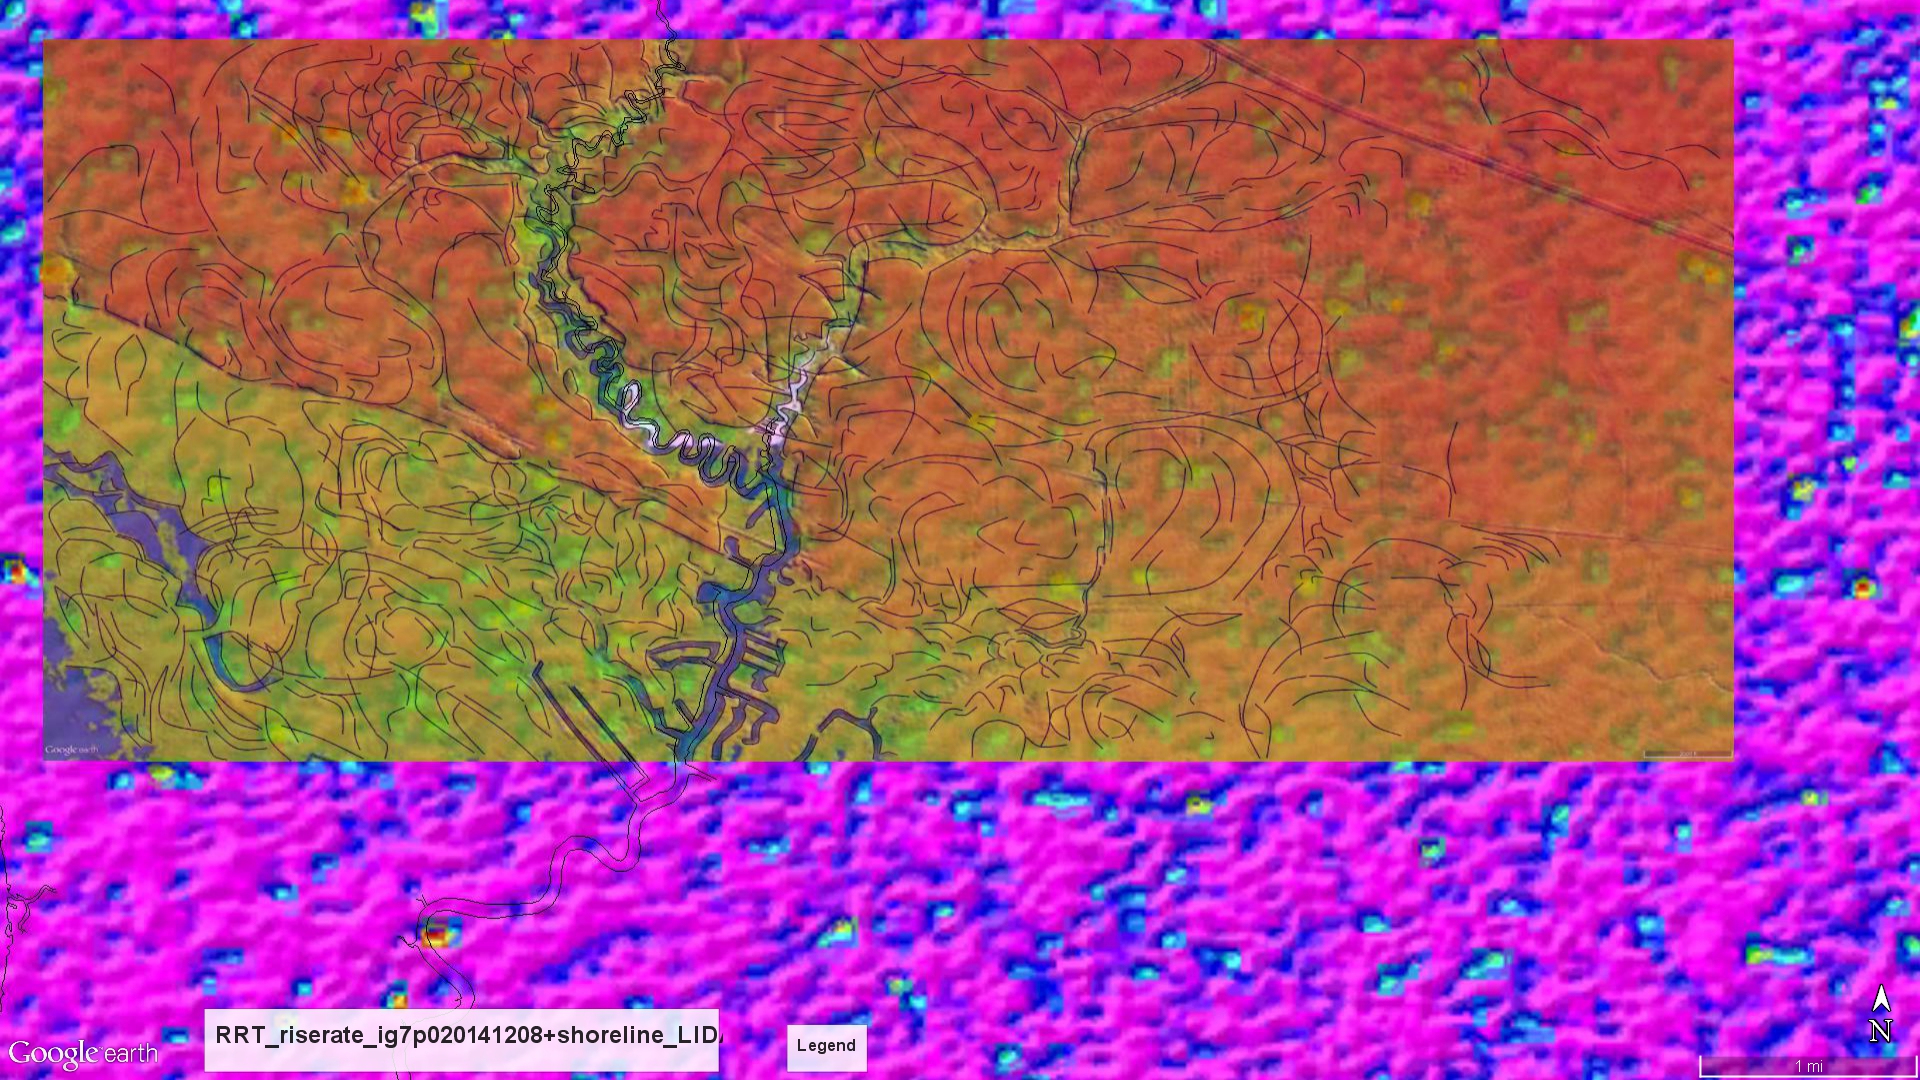
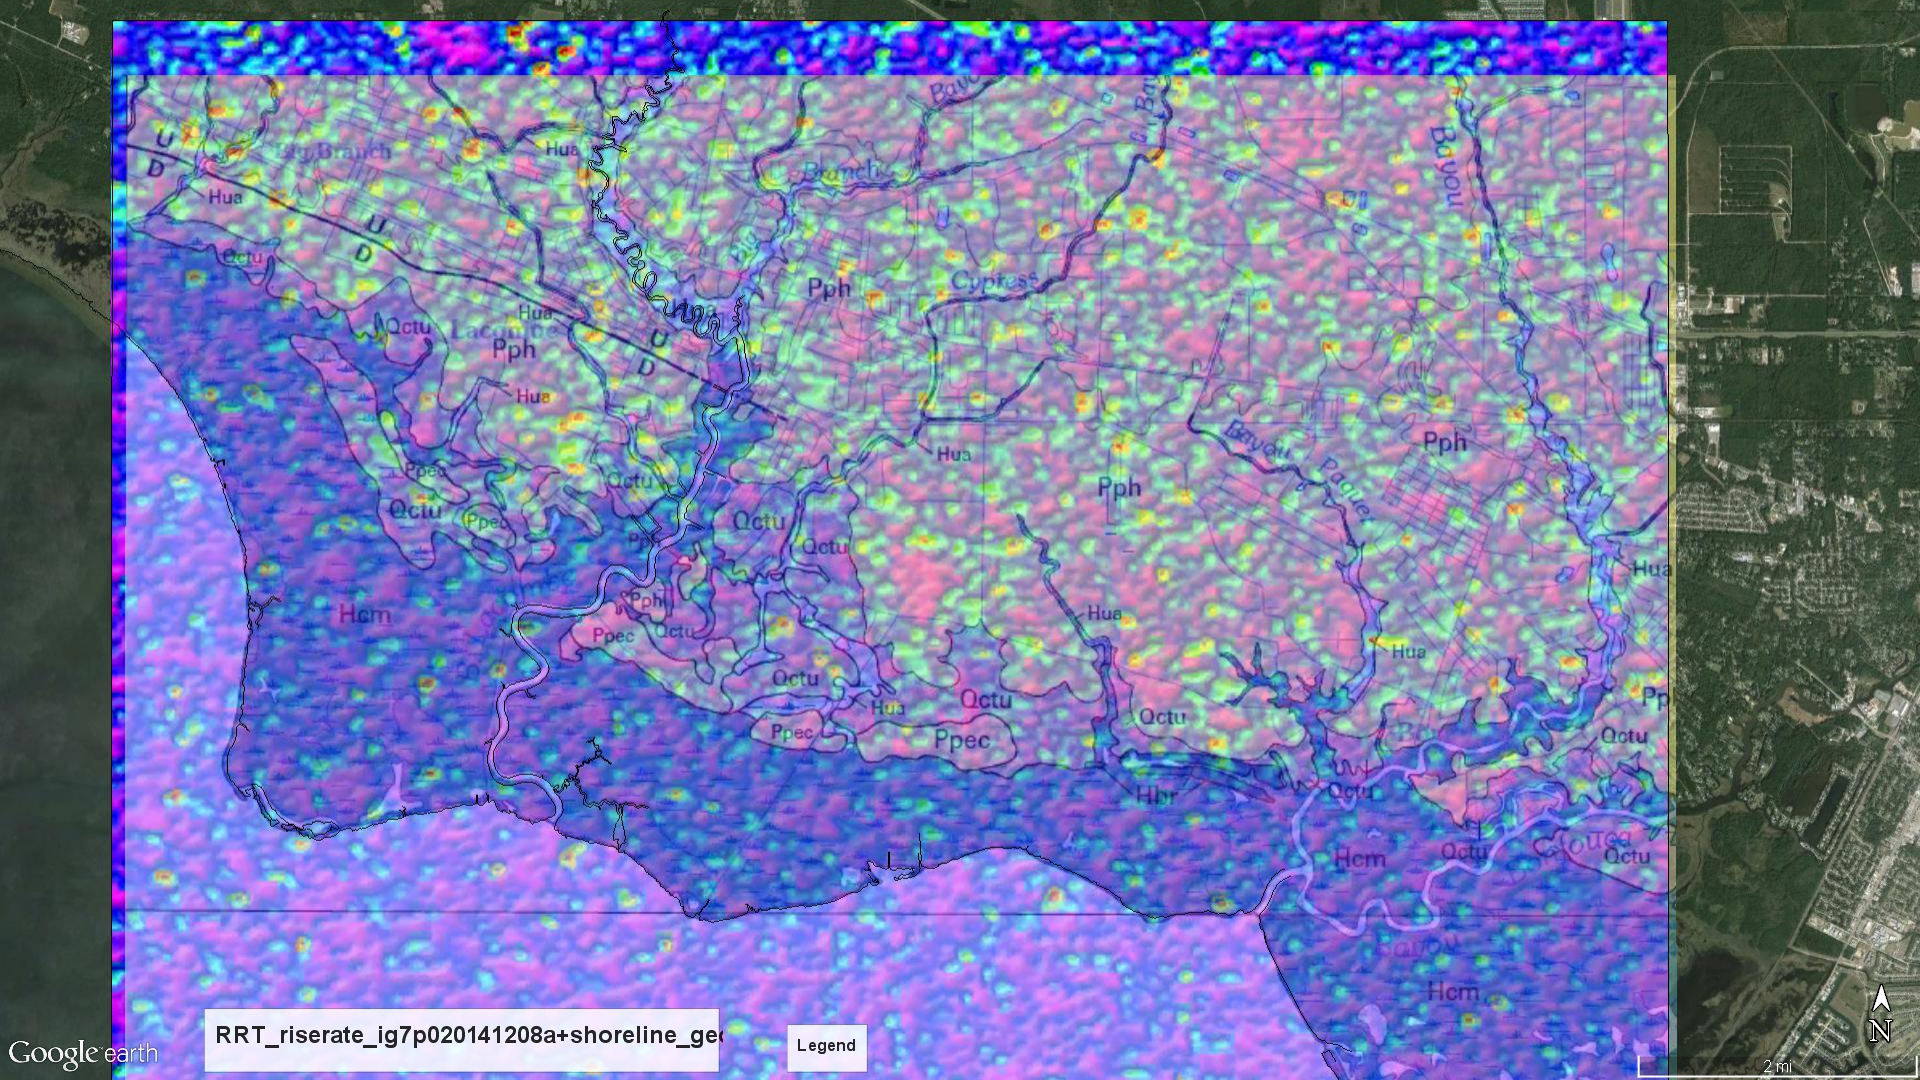
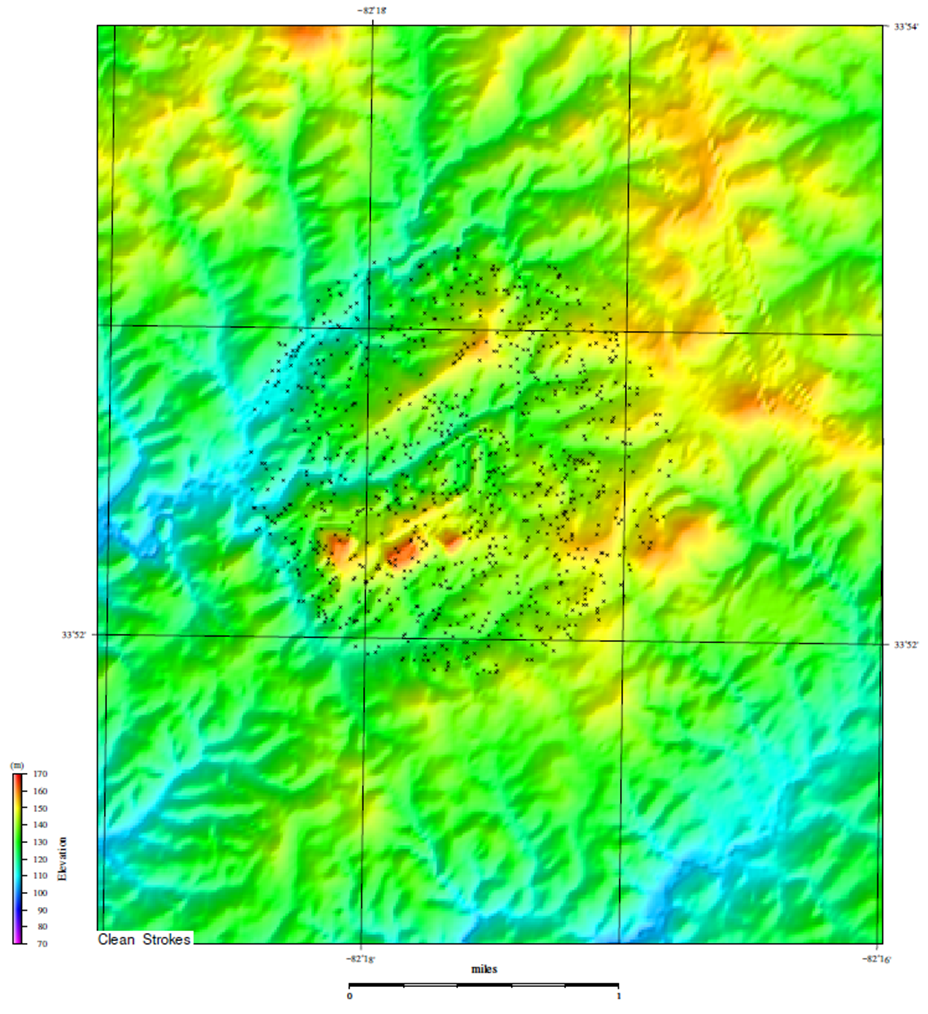
Houston Area 2010 Lightning Analysis Area | Patterns in Rise-Time Attribute Houston Map |
Patterns in Peak Current Attribute Houston Map | Patterns in Peak-to-Zero Attribute Houston Map |
Point Bars picked on Milam County, TX Rise-Time | LIDAR Meanders over Rise-Time Goose Point, LA |
LIDAR Meanders Rate-of-Rise-Time Goose Point | Geology over Rate-of-Rise-Time Goose Point |
3 Salt Domes Iberia, LA not on Density on R-R-T | Background Lightning Photo |
![](11_Shaded_Relief_with_Satellite_View_Volcanoes.png) | ![](12_Geologic_Map.png) |
![](13_Precipitation_1961-1990.png) | ![](14_Watersheds.png) |
![](15_Watersheds_and_Streams.png) | ![](16_Land_Cover_Density_1km.png) |
![](17_Forest_Fragmentation_causes.png) | ![](18_Farms_average_size_2007.png) |
![](19_Water_Withdrawal_2005_Ground_Surface.png) | ![](20_Tornadoes_2005-2008.png) |
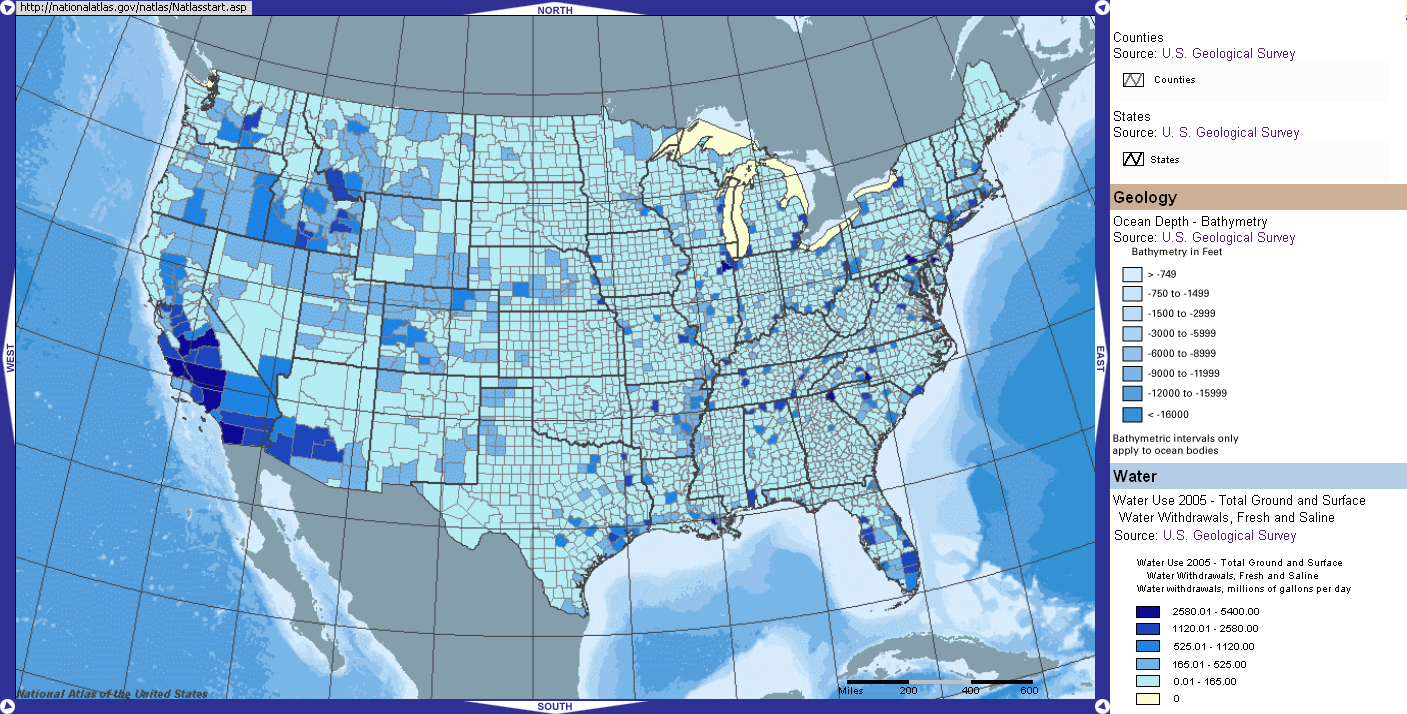
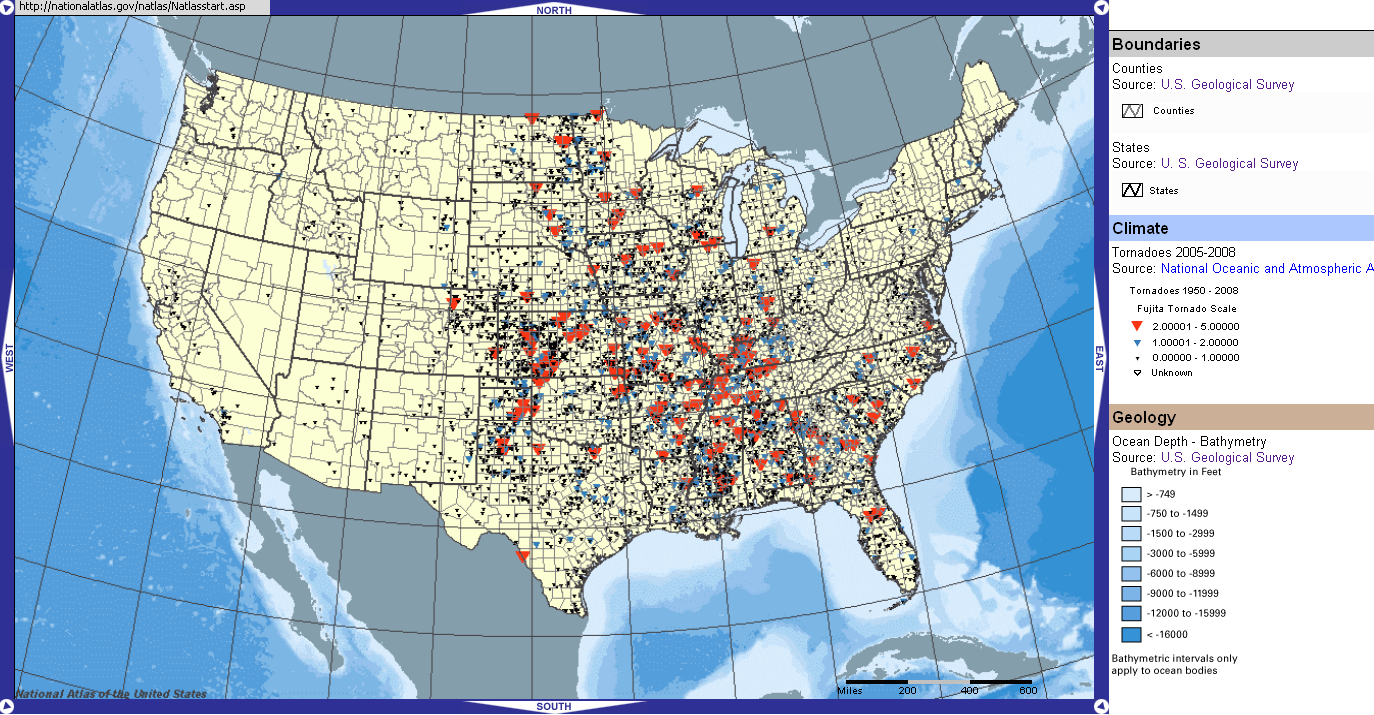
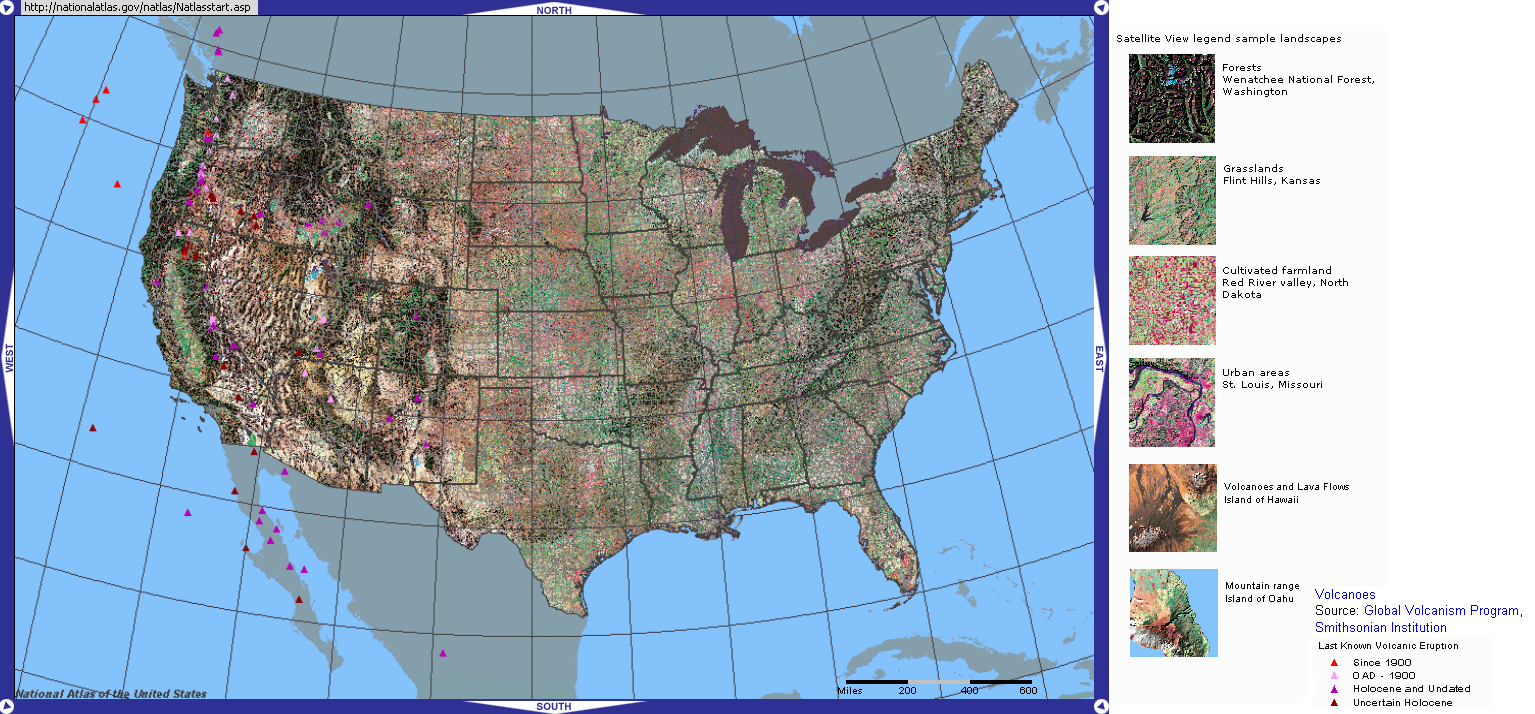
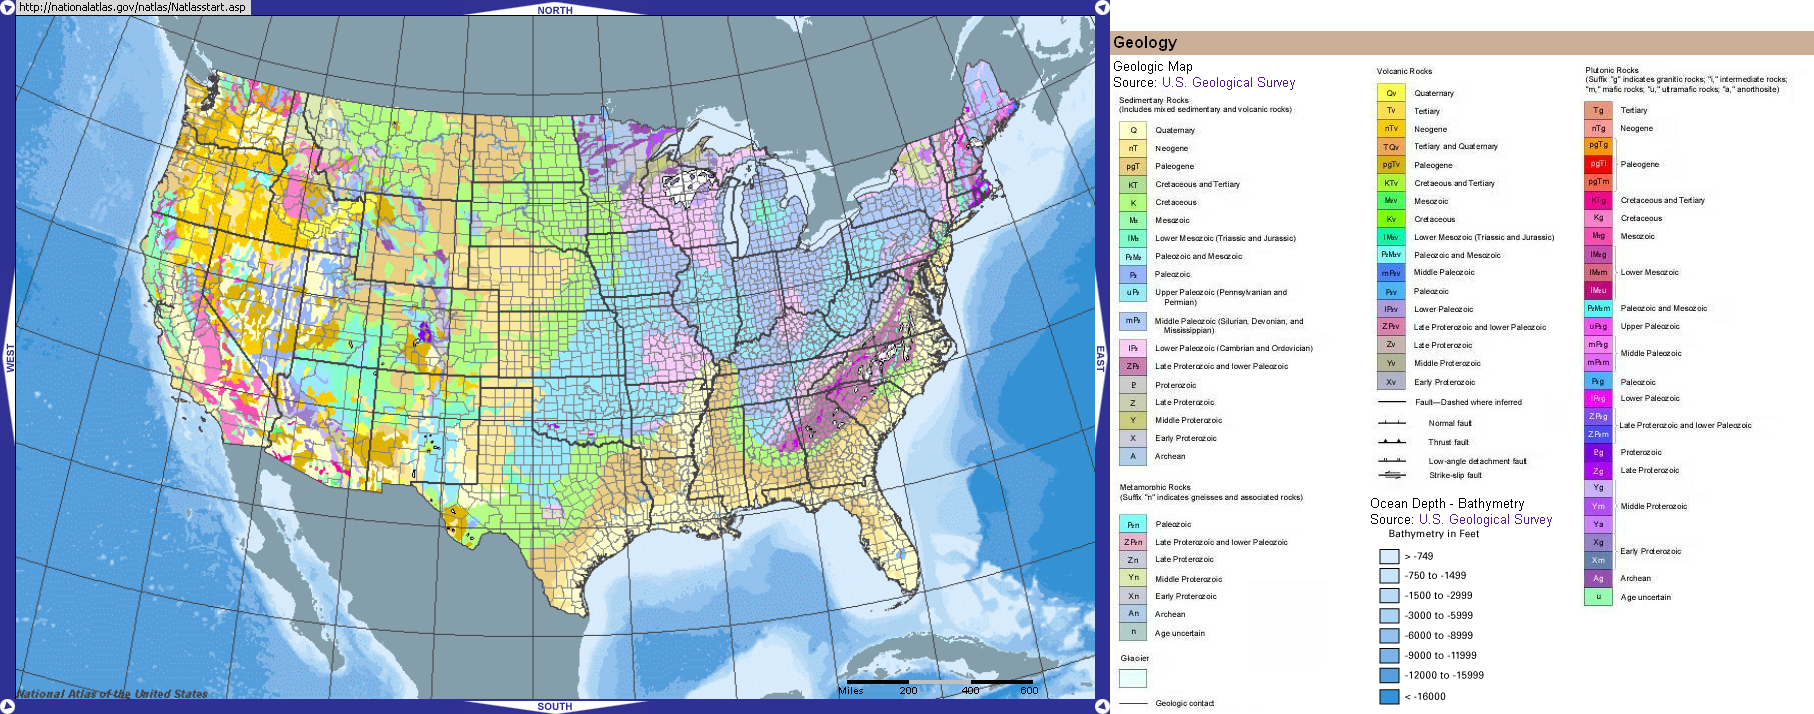
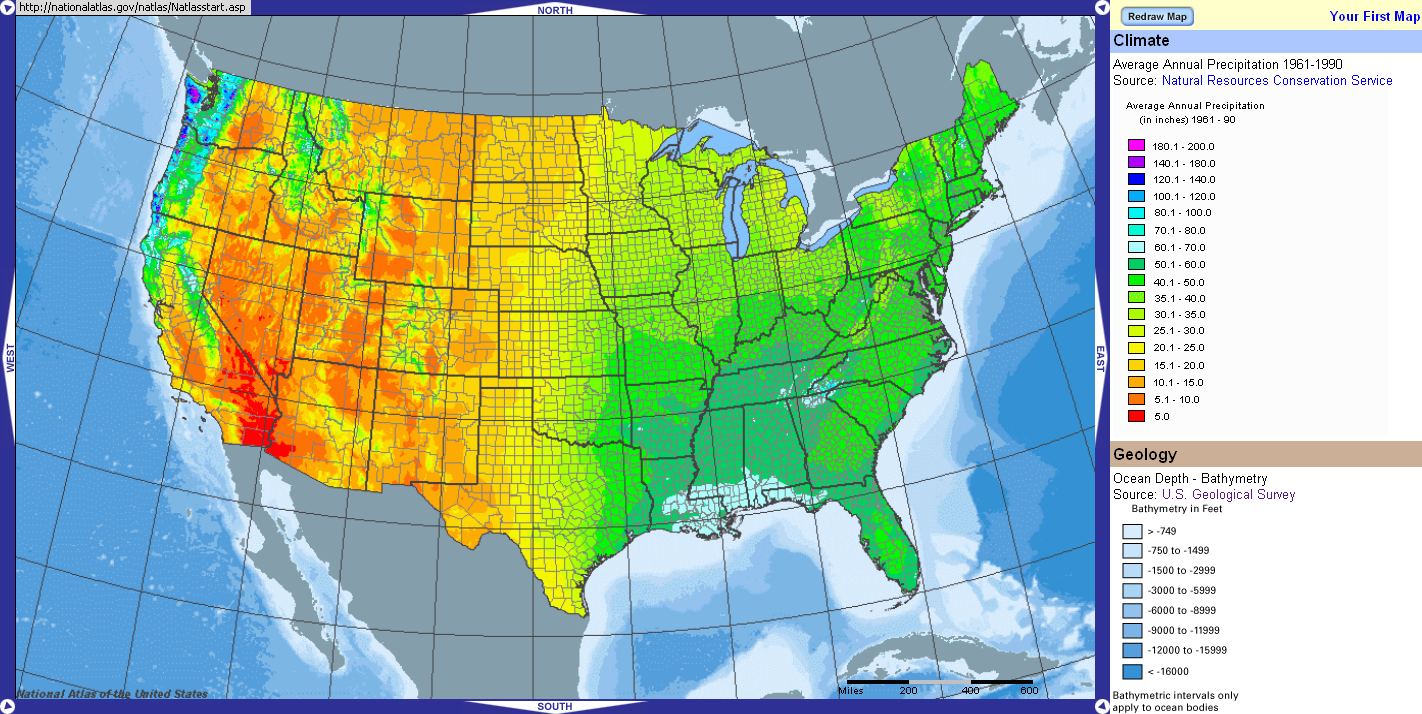
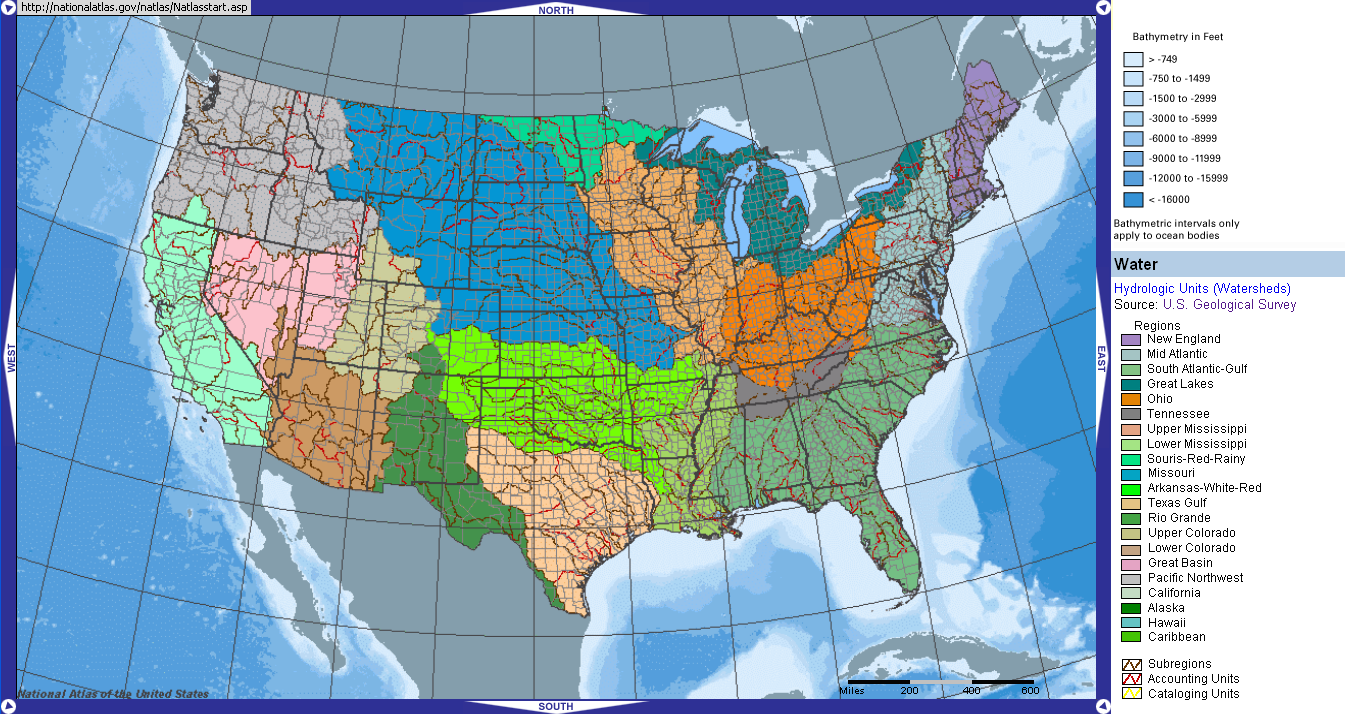
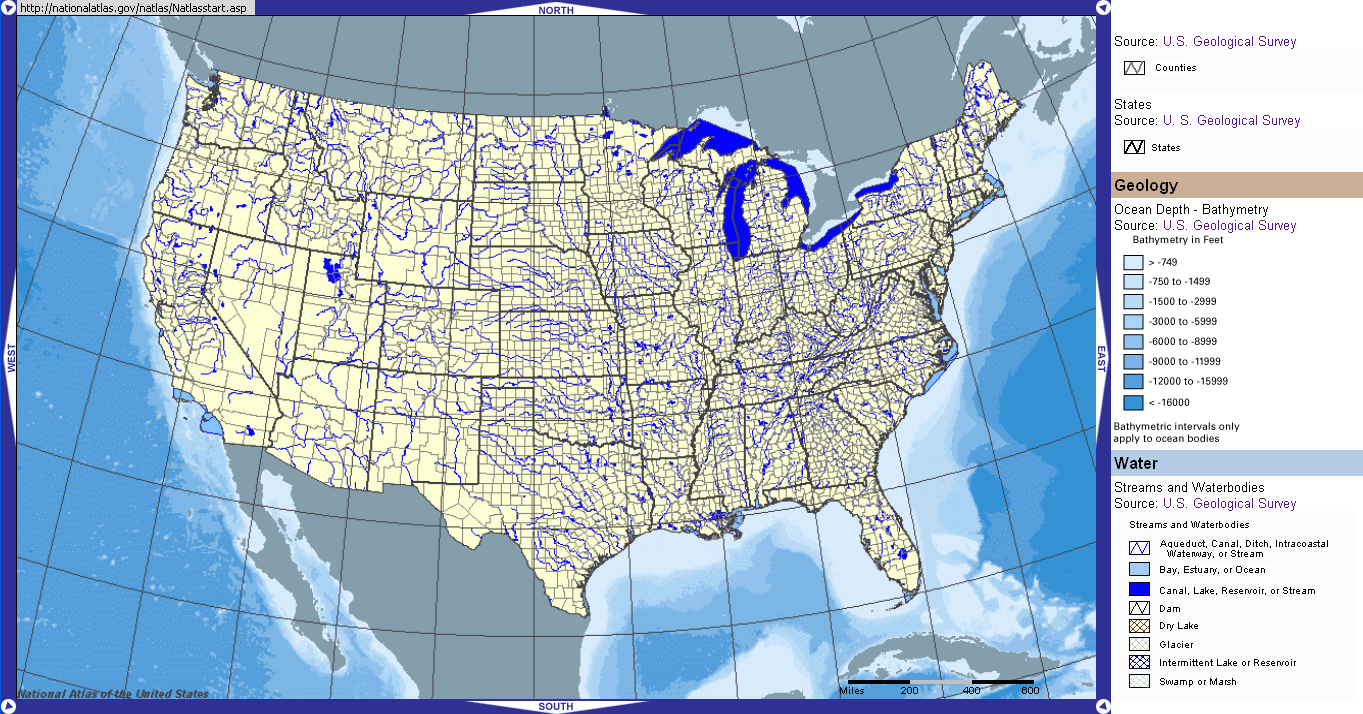
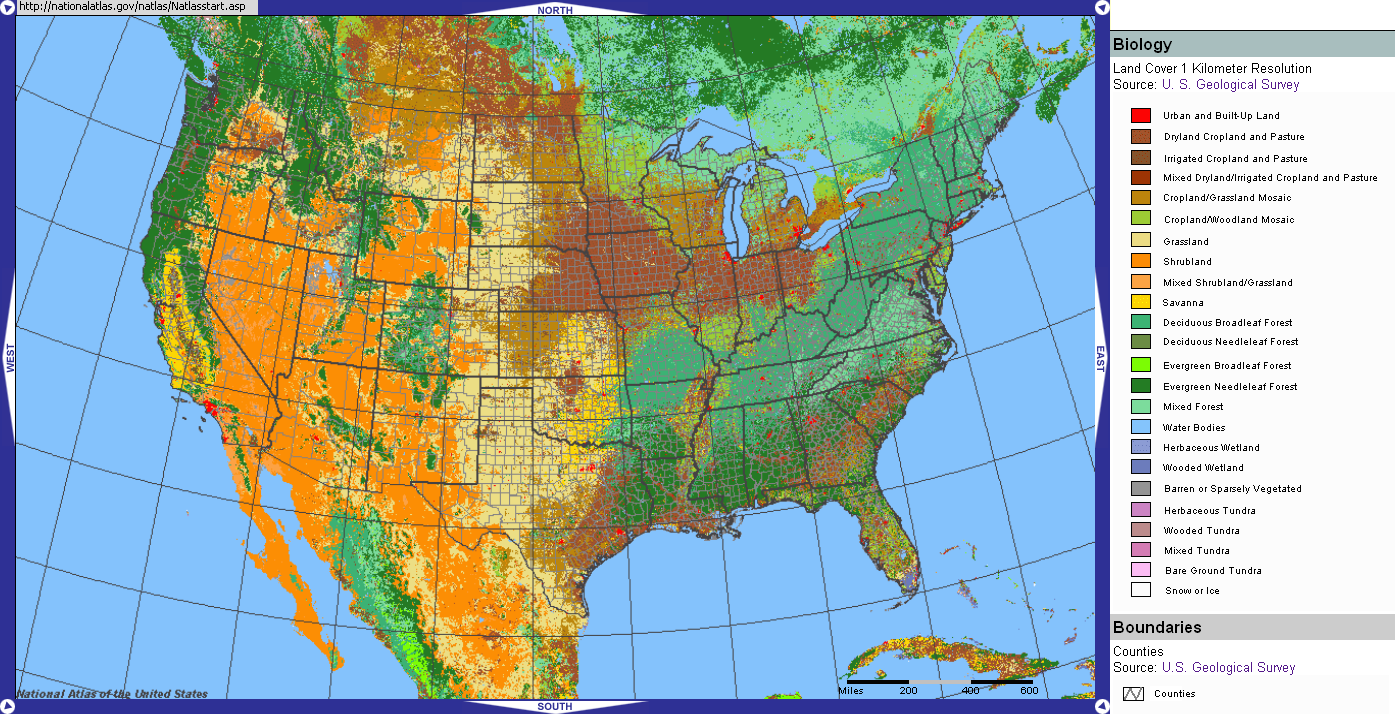
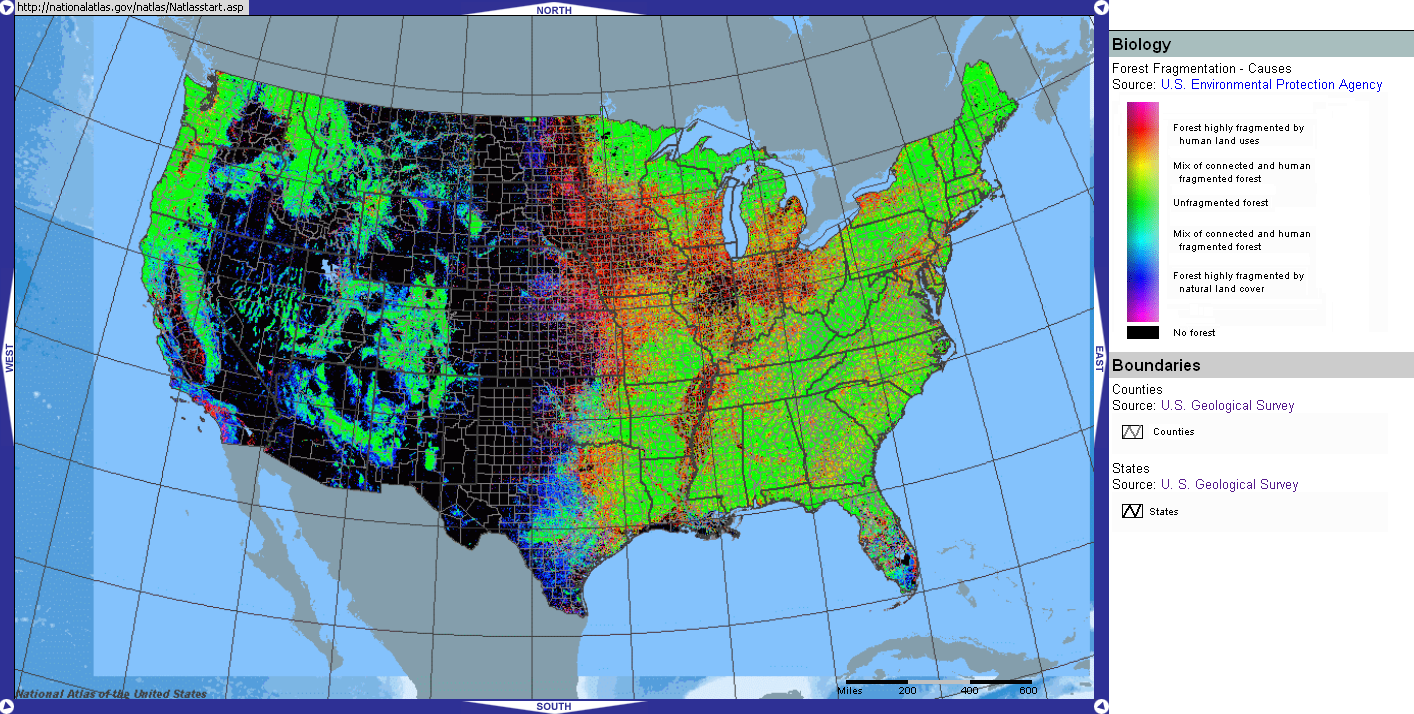
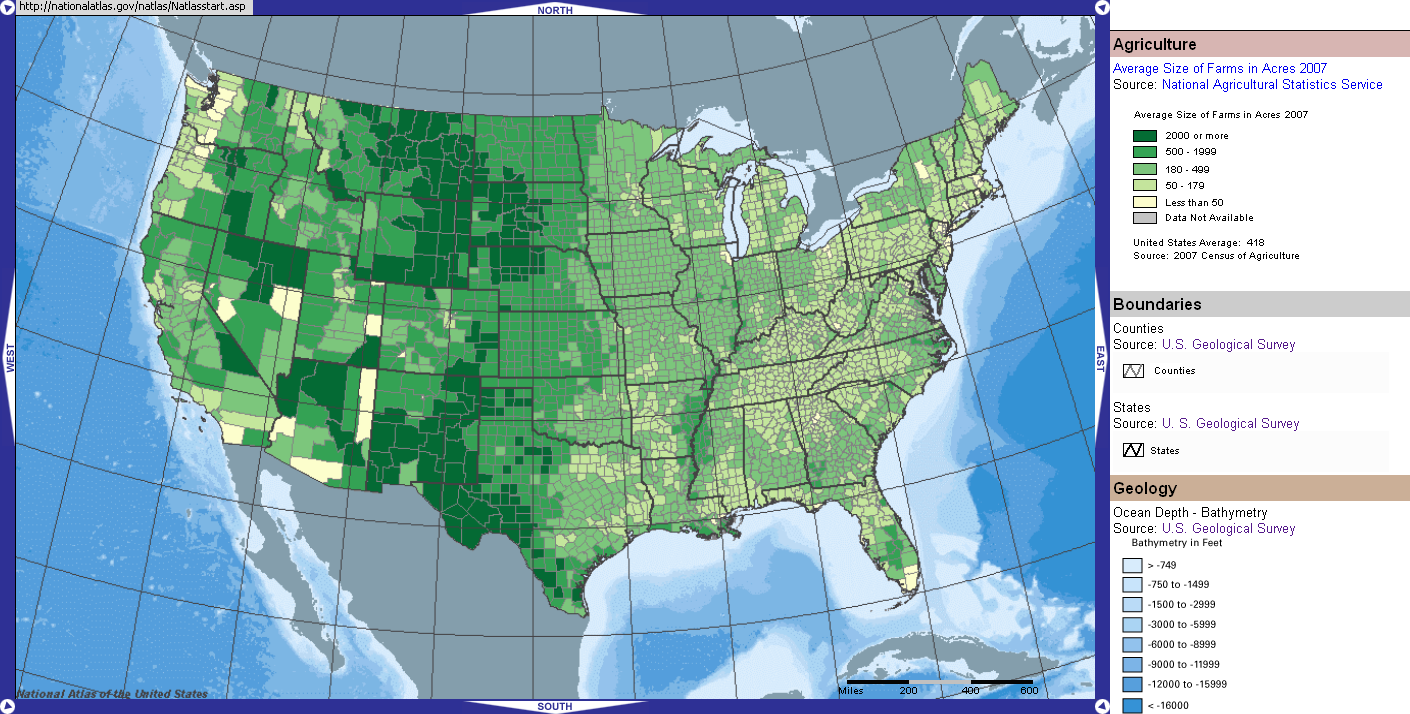
Atlas: Shaded Relief Volcanoes | Atlas: Surface Geologic Age |
Atlas: Perciptation 1961-1990 | Atlas: U.S. Watersheds |
Atlas: Streams & Waterbodies | Atlas: U.S. Biology |
Atlas: Forest Fragmentation | Atlas: U.S. Agriculture |
Atlas: U.S. Water Use | Atlas: Tornadoes 2005-2008 |
![](21_US_Gravity_Map_lg.png.png) | ![](22_US_Soil_Moisture.png) |
![](23_Coal_Continental_Divide.png) | ![](24_Calderas_Impacts_Glacial_Limits_Metamorphic_Areas.png) |
![](25_Crop_Corn_2007.png) | ![](26_Crop_Cotton_2007.png) |
![](27_Crop_Orchard_acreage_2007.png) | ![](28_Crop_Soybeans_2007.png) |
![](29_Crop_Vegetable_acreage_2007.png) | ![](30_Crop_Wheat_2007.png) |
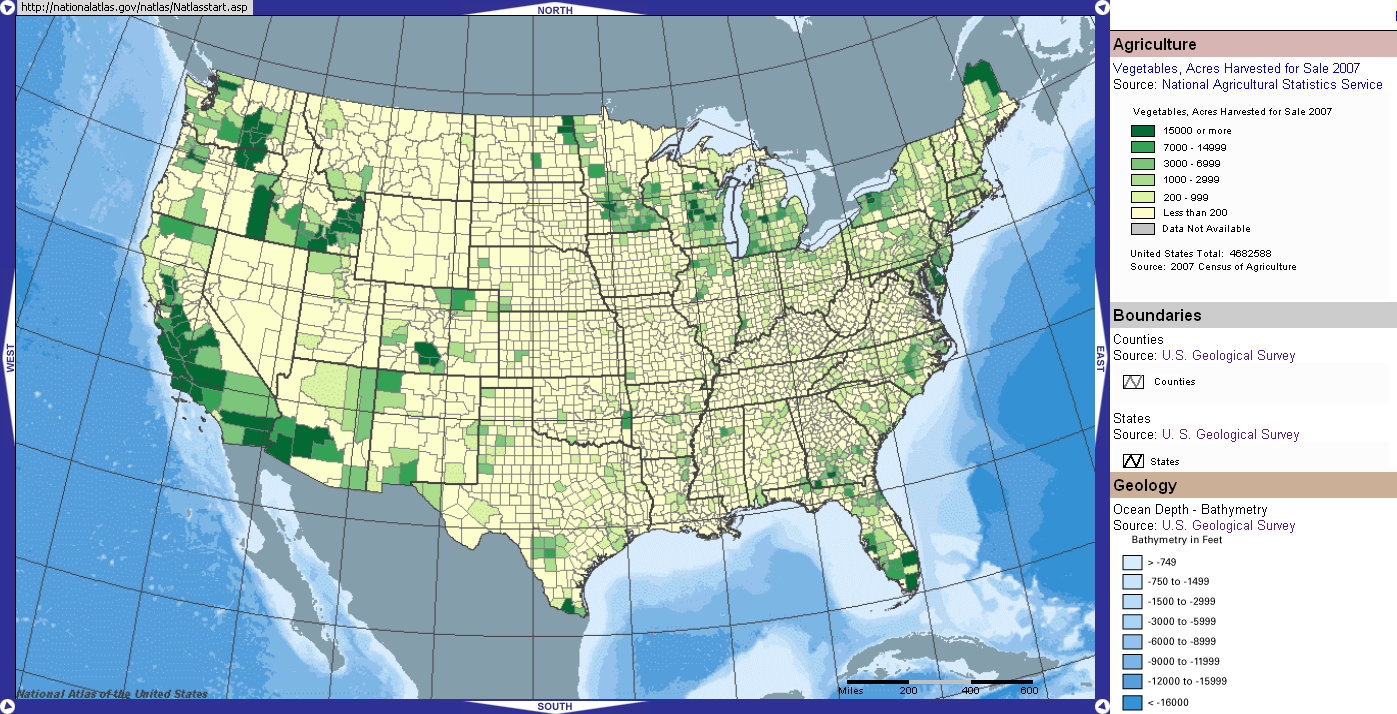
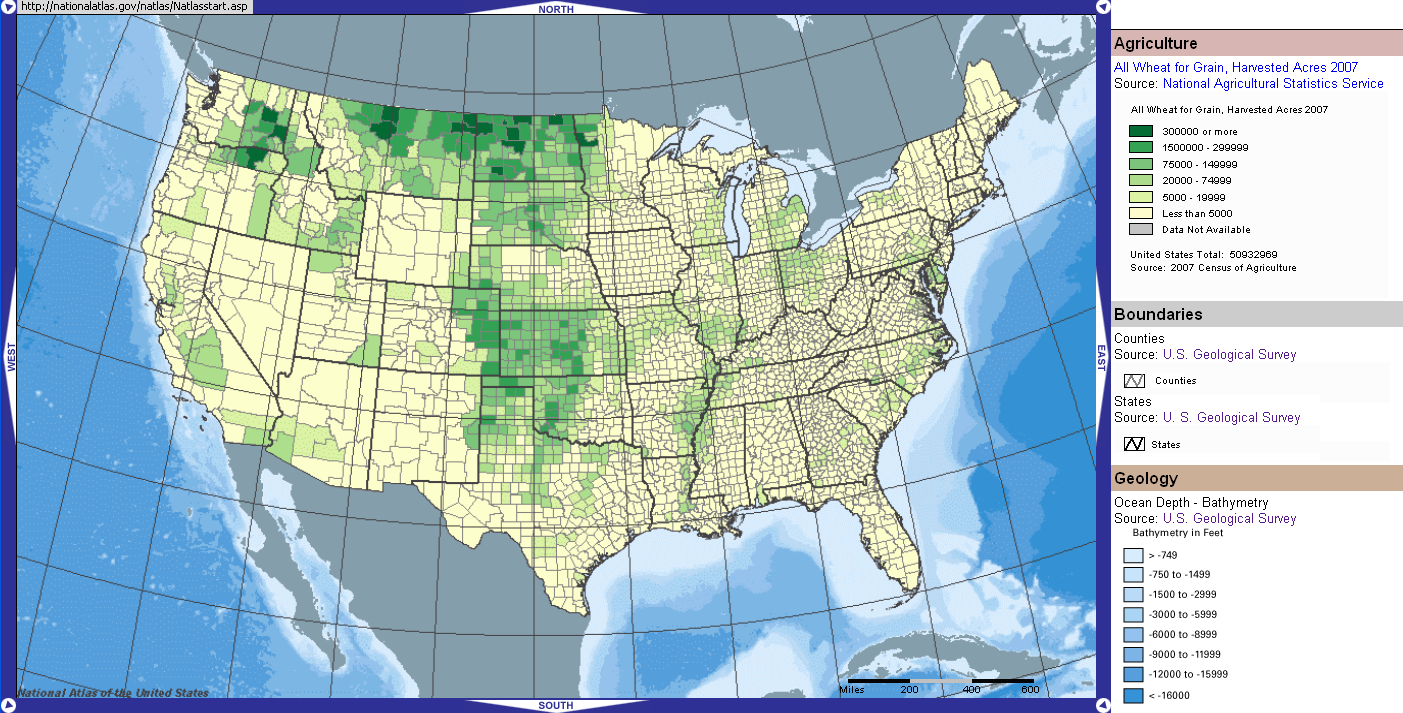
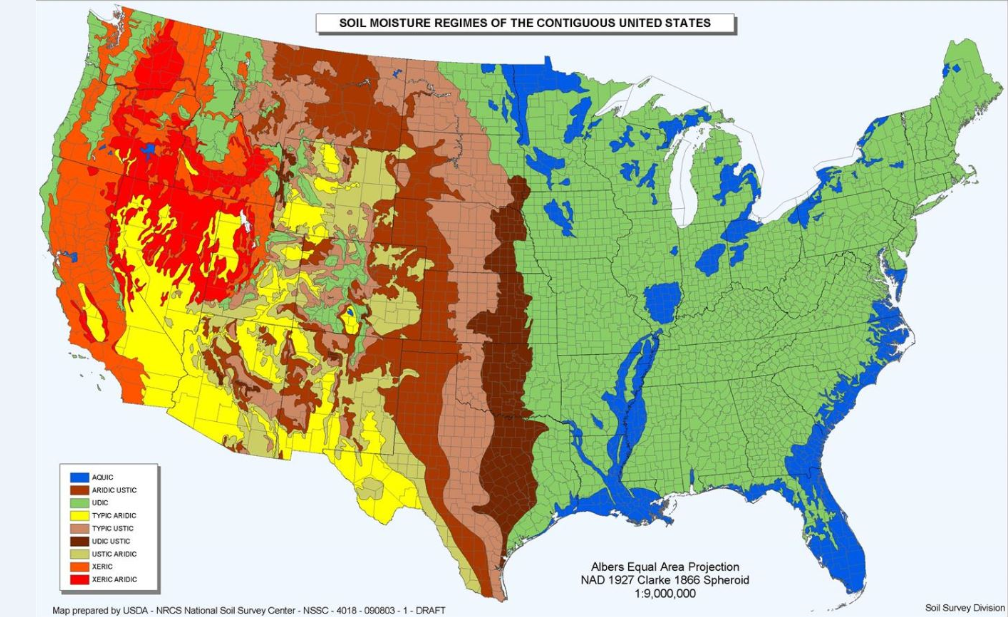
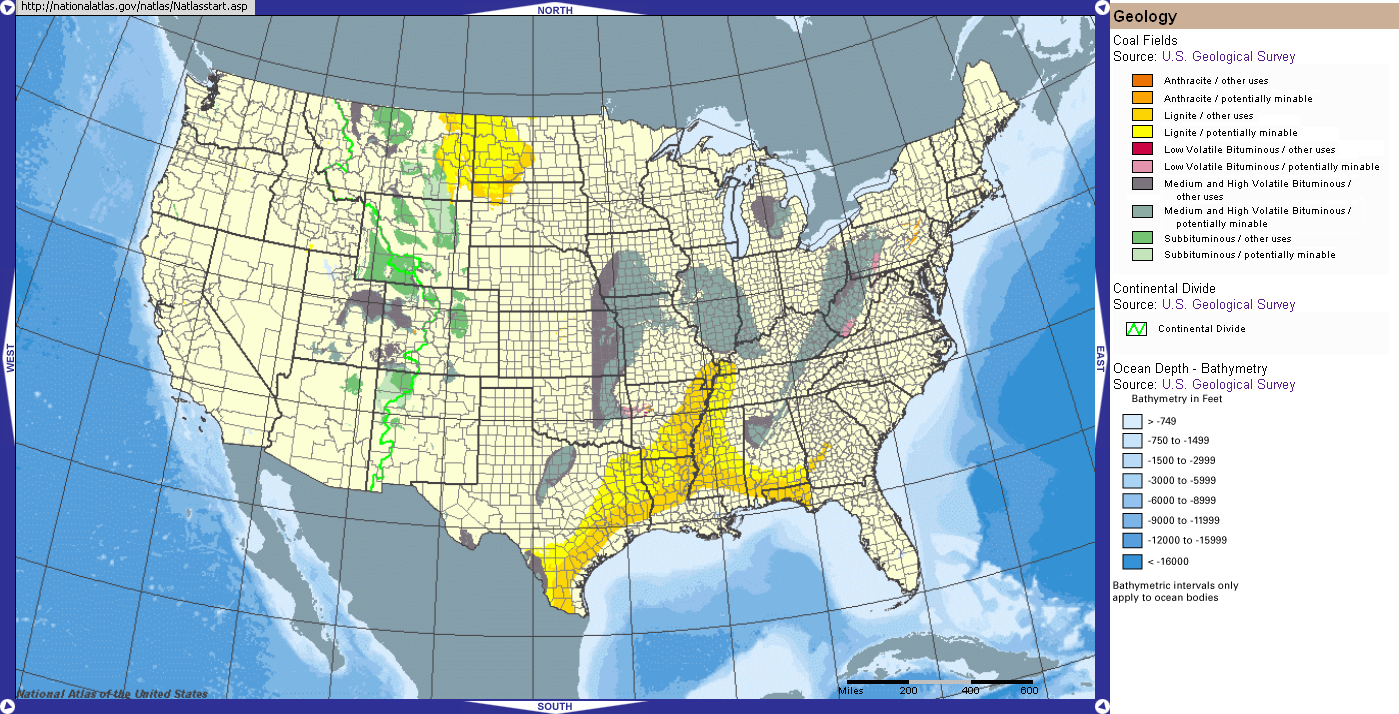
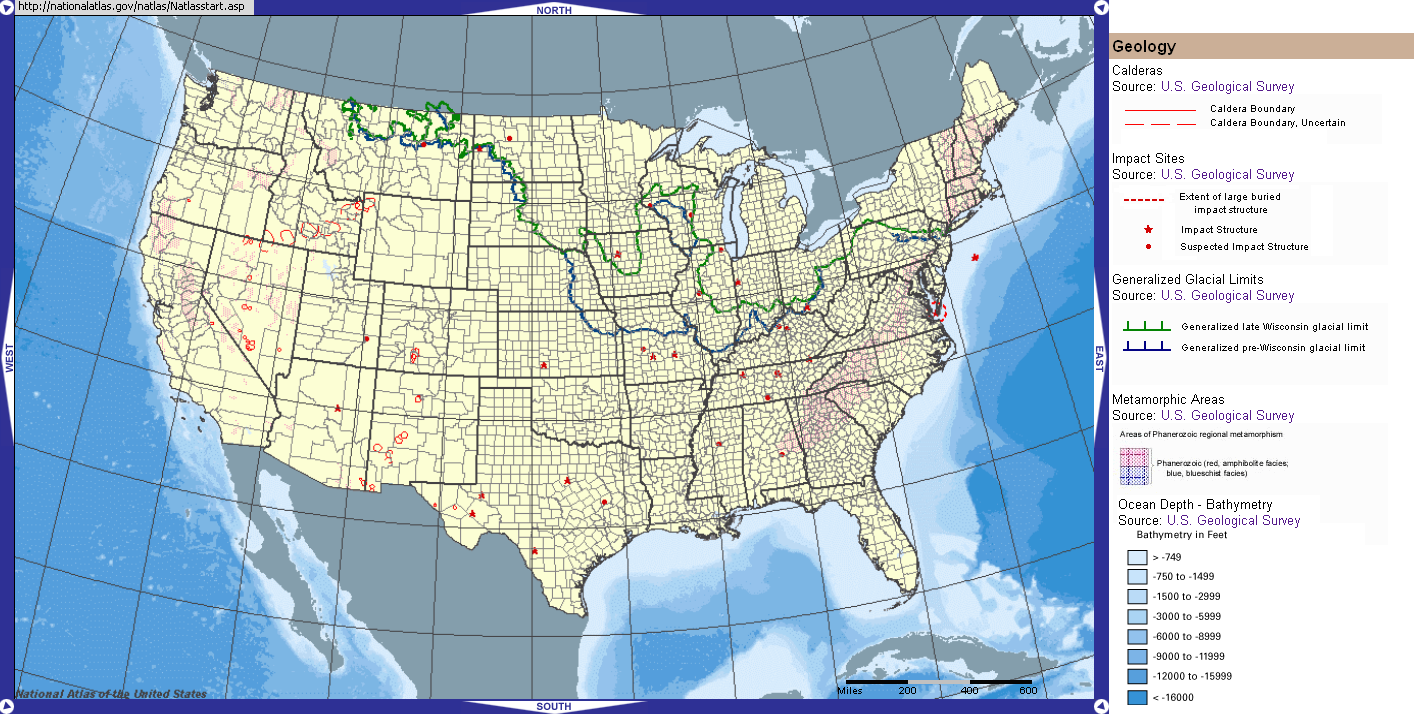
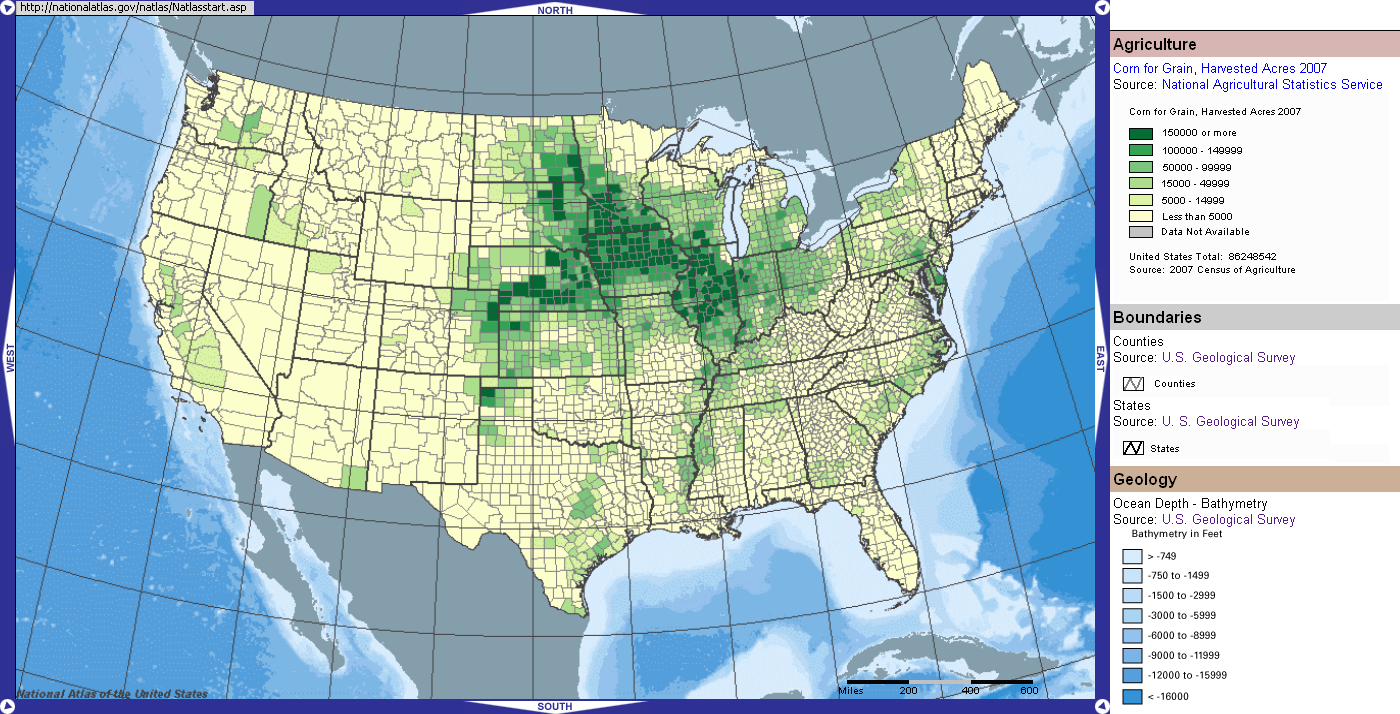
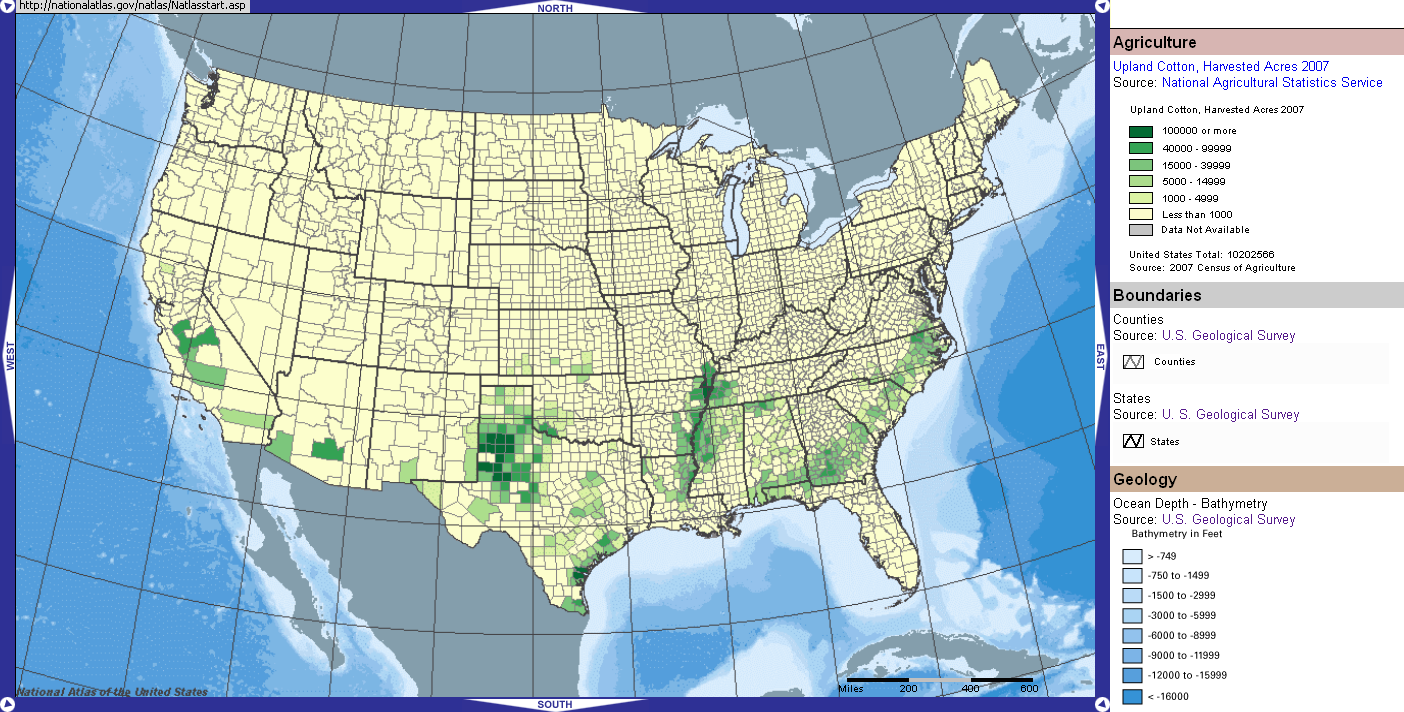
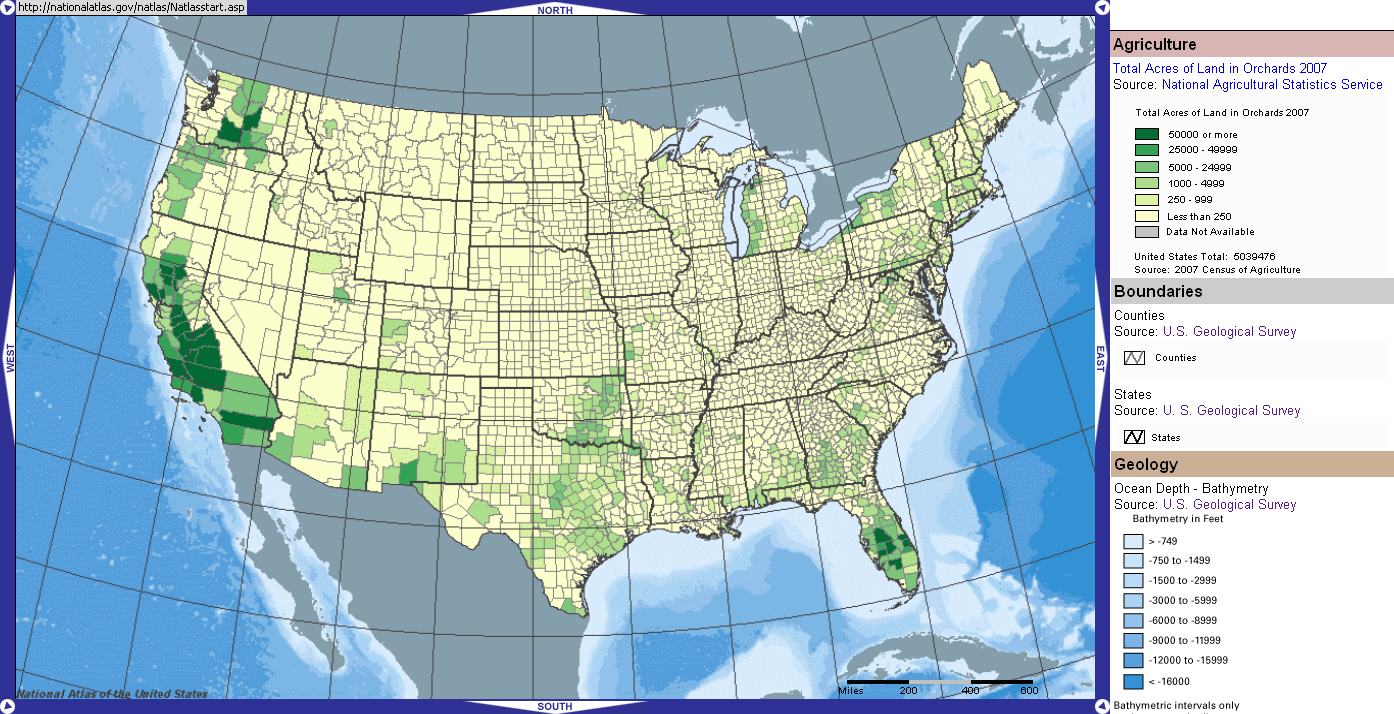
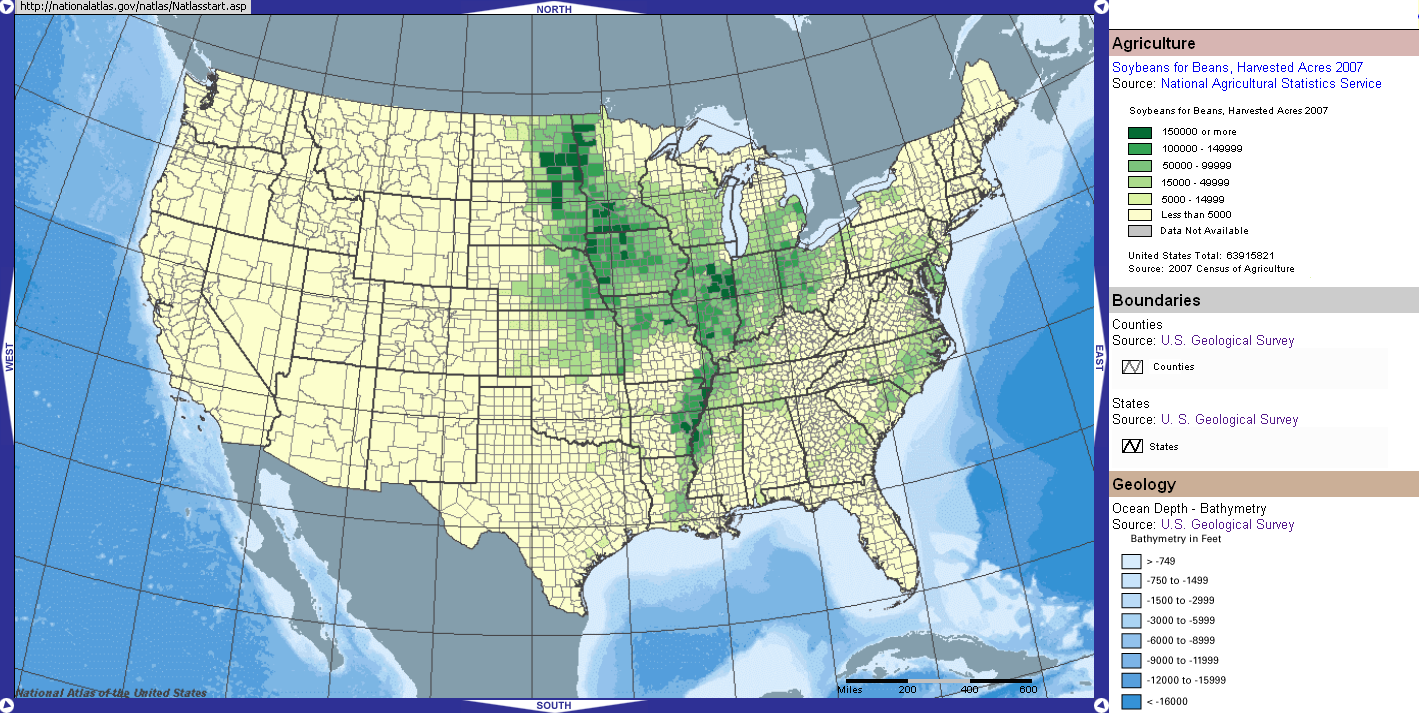
Atlas: U.S. Gravity Map | Atlas: Soil Moisture Regimes |
Atlas: U.S. Coal Fields | Atlas: U.S. Calderas |
Atlas: U.S. Corn for Grain | Atlas: U.S. Upland Cotton |
Atlas: Acres of Land in Orchards | Atlas: Soybeans for Beans |
Atlas: U.S. Vegetables | Atlas: U.S. Wheat for Grain |
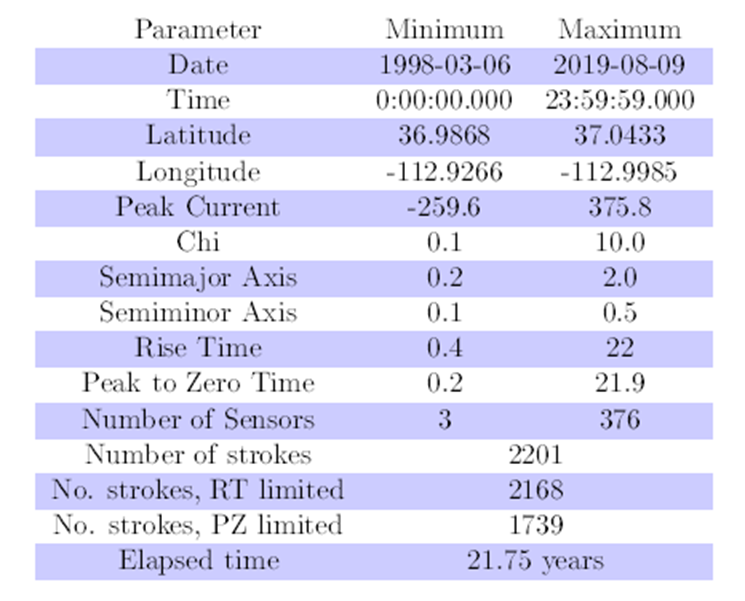
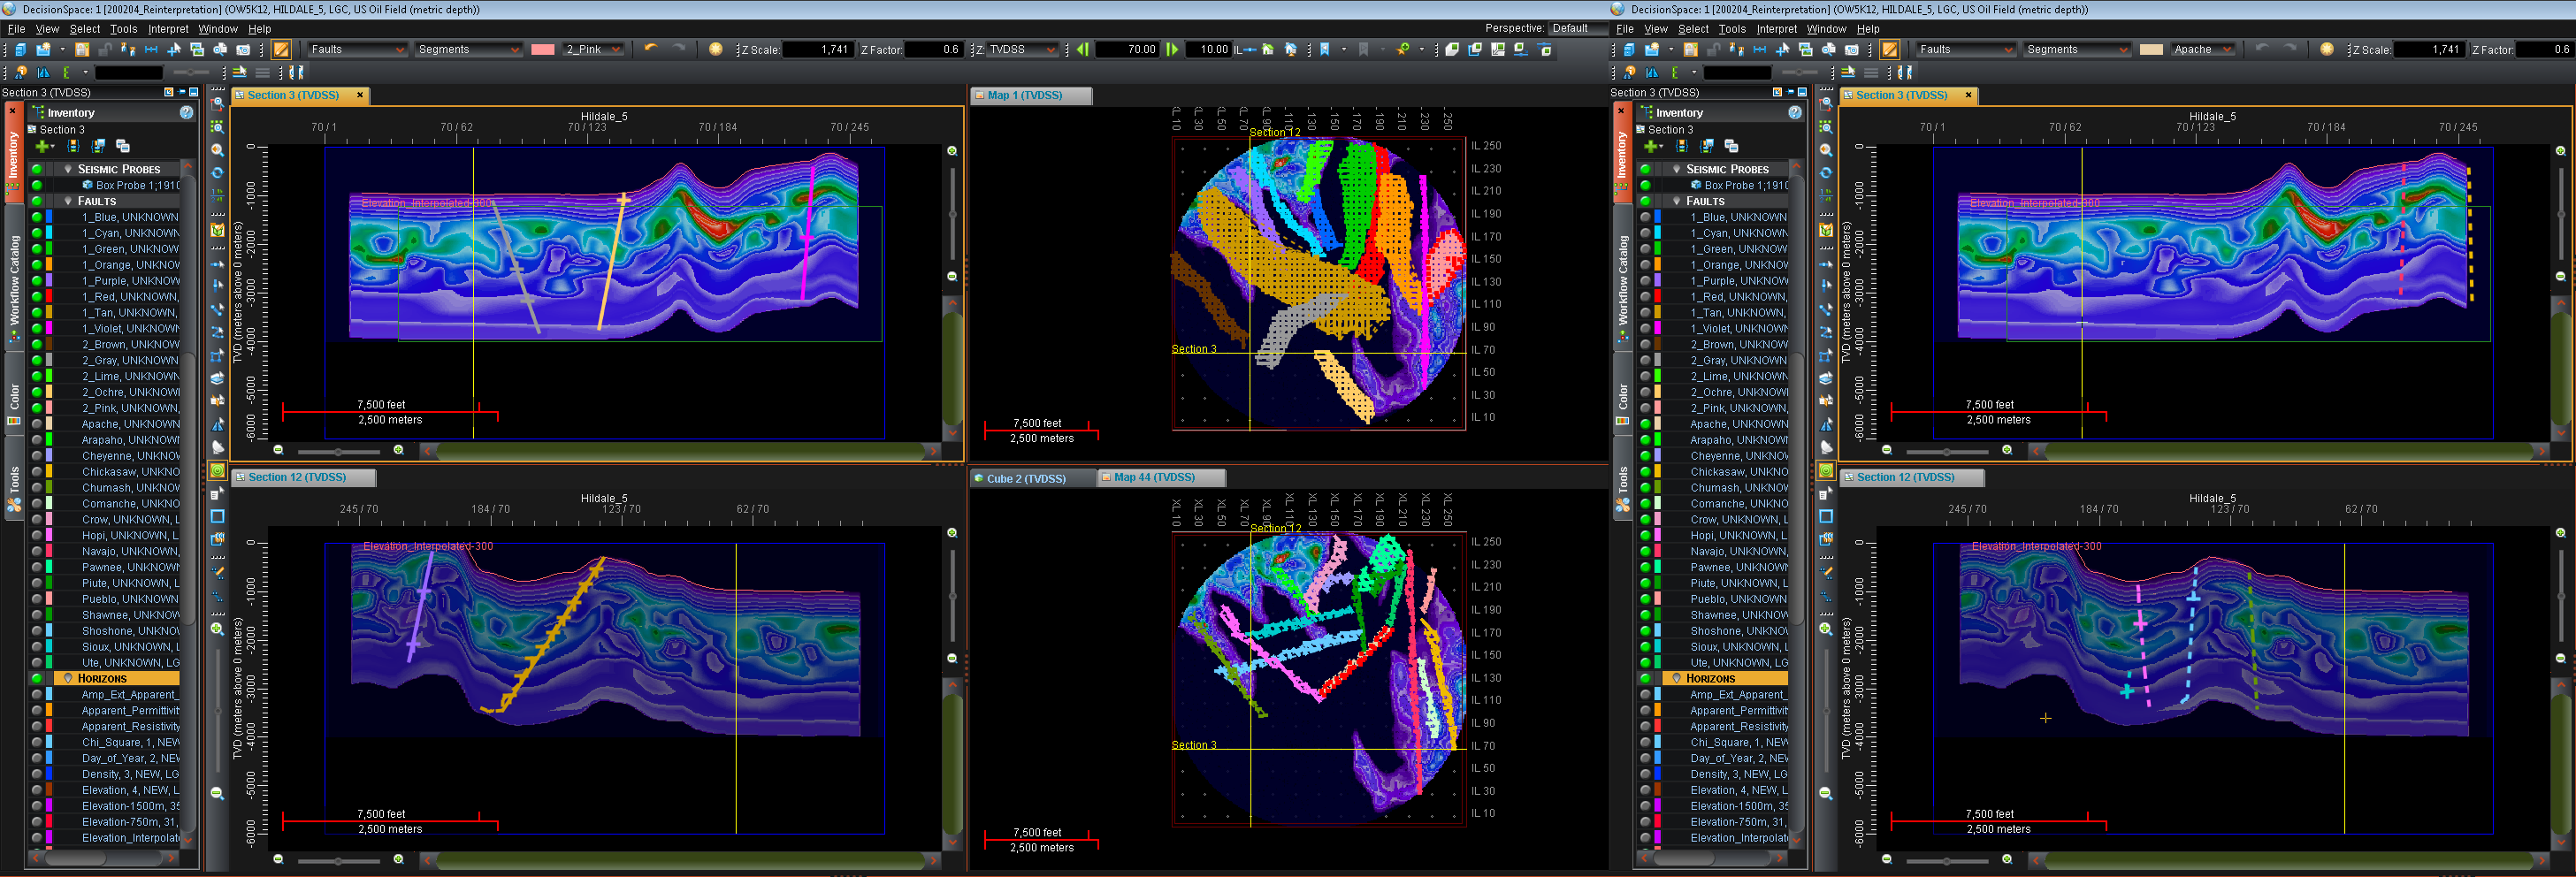
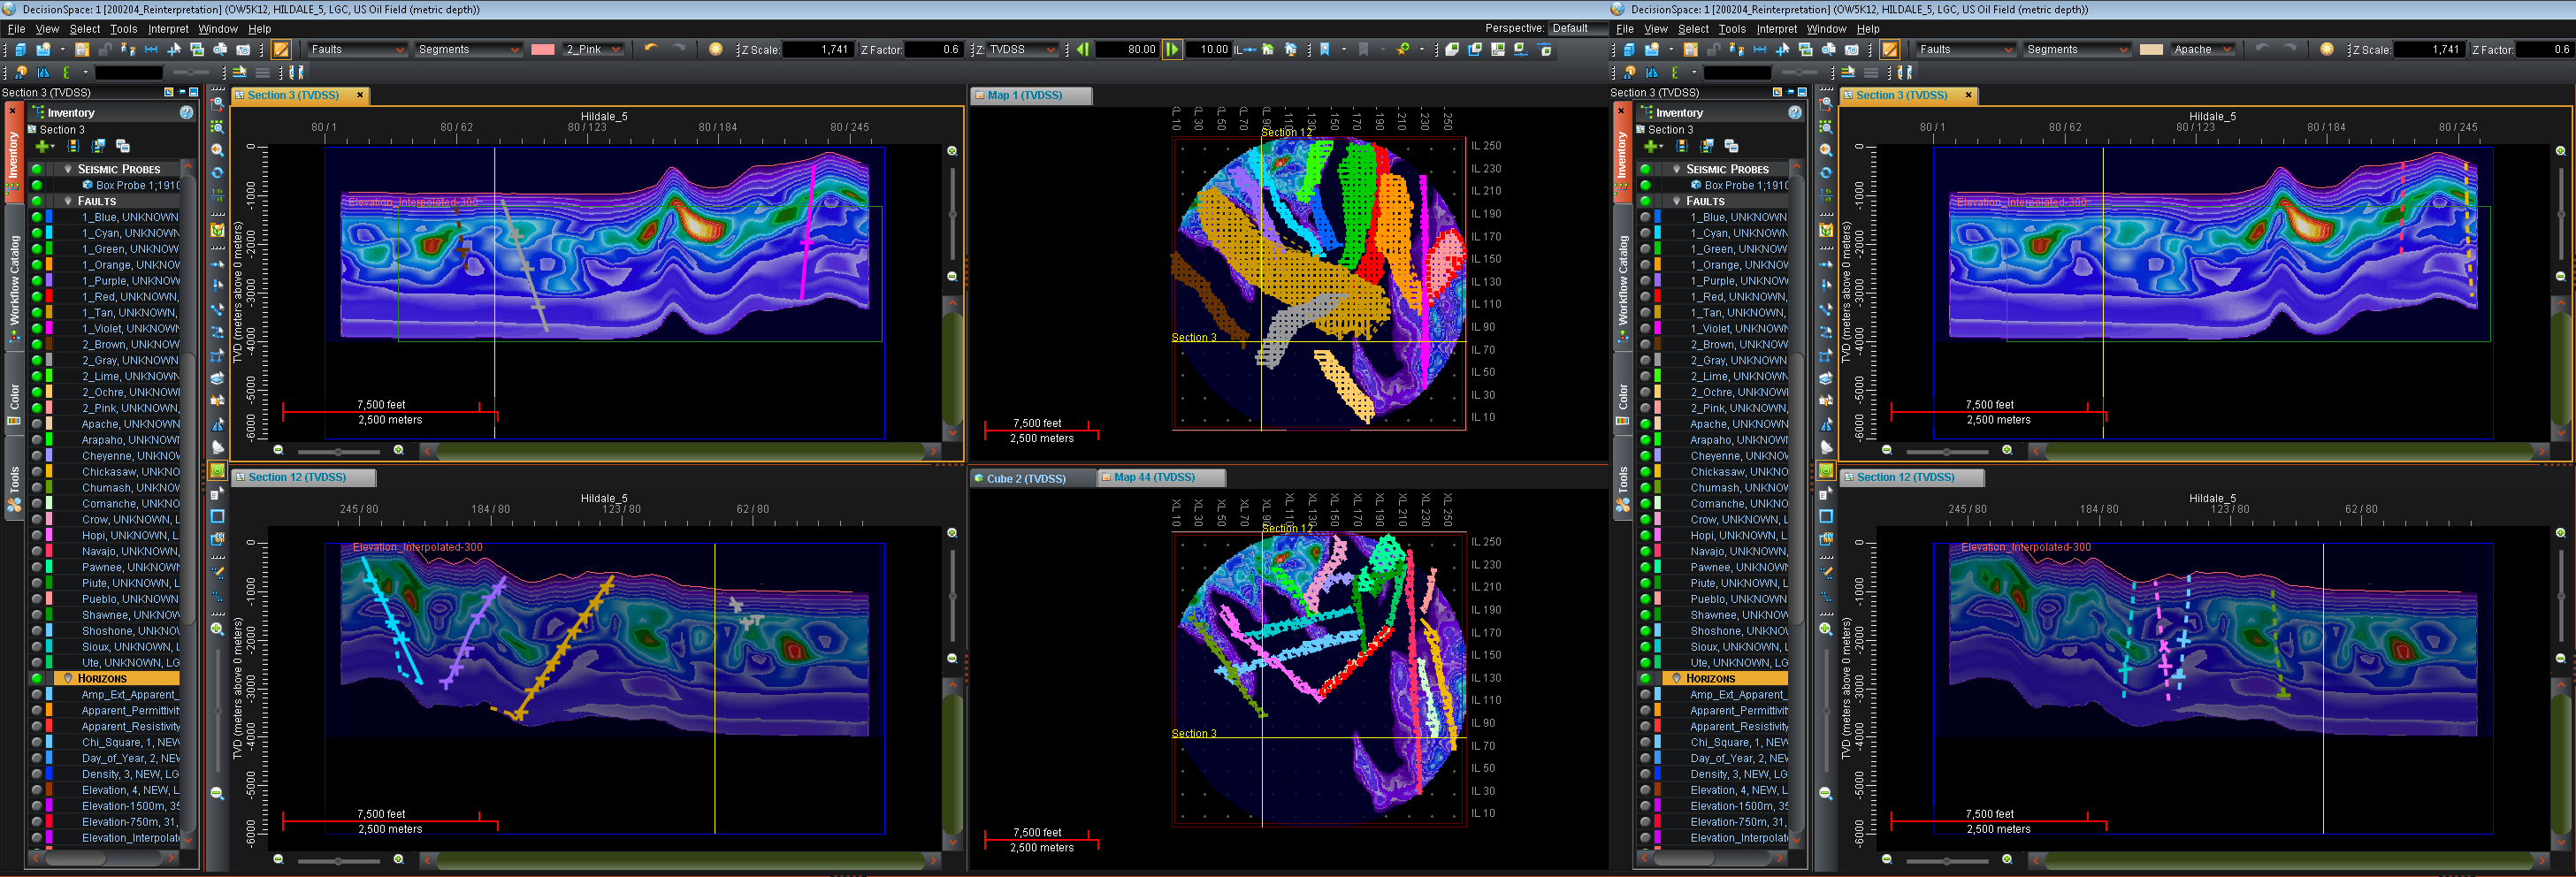
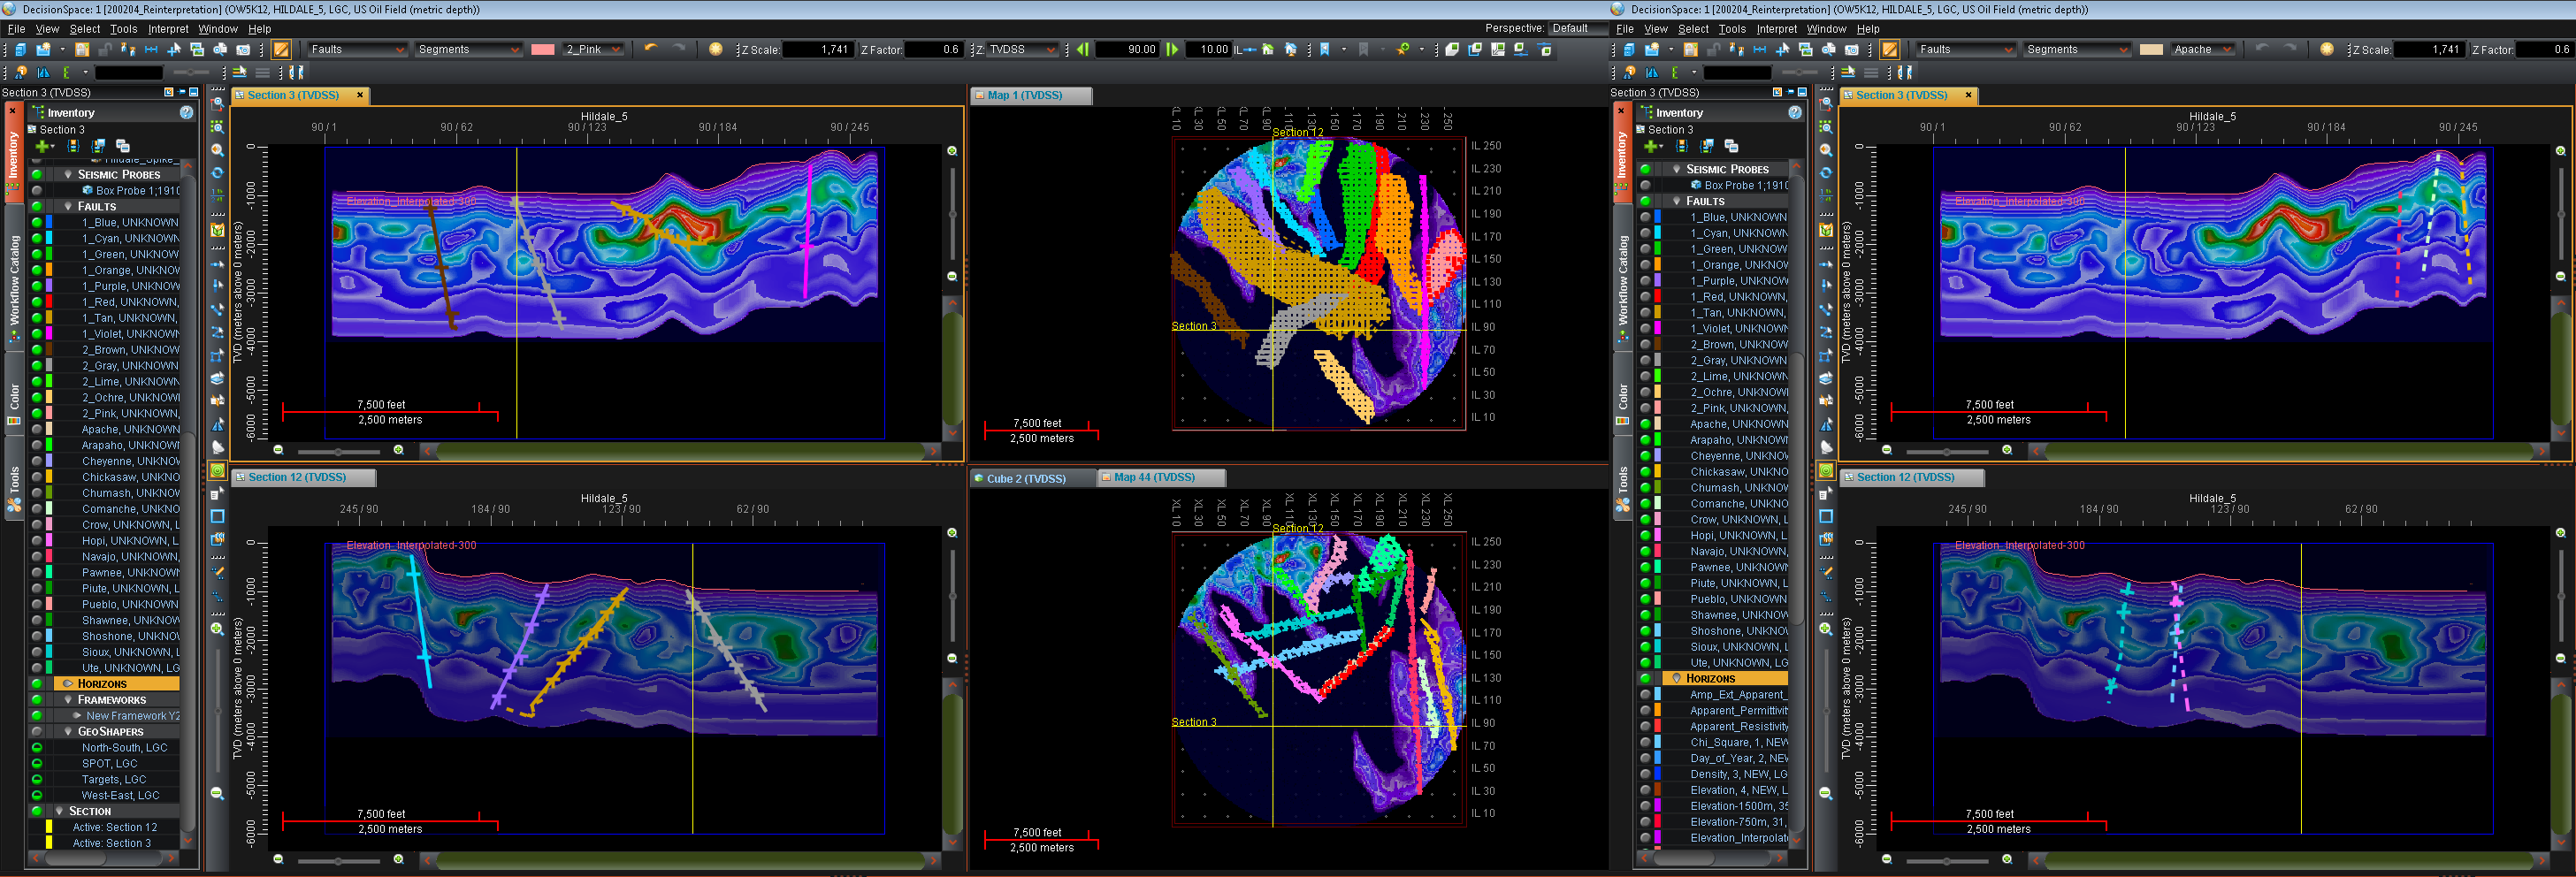
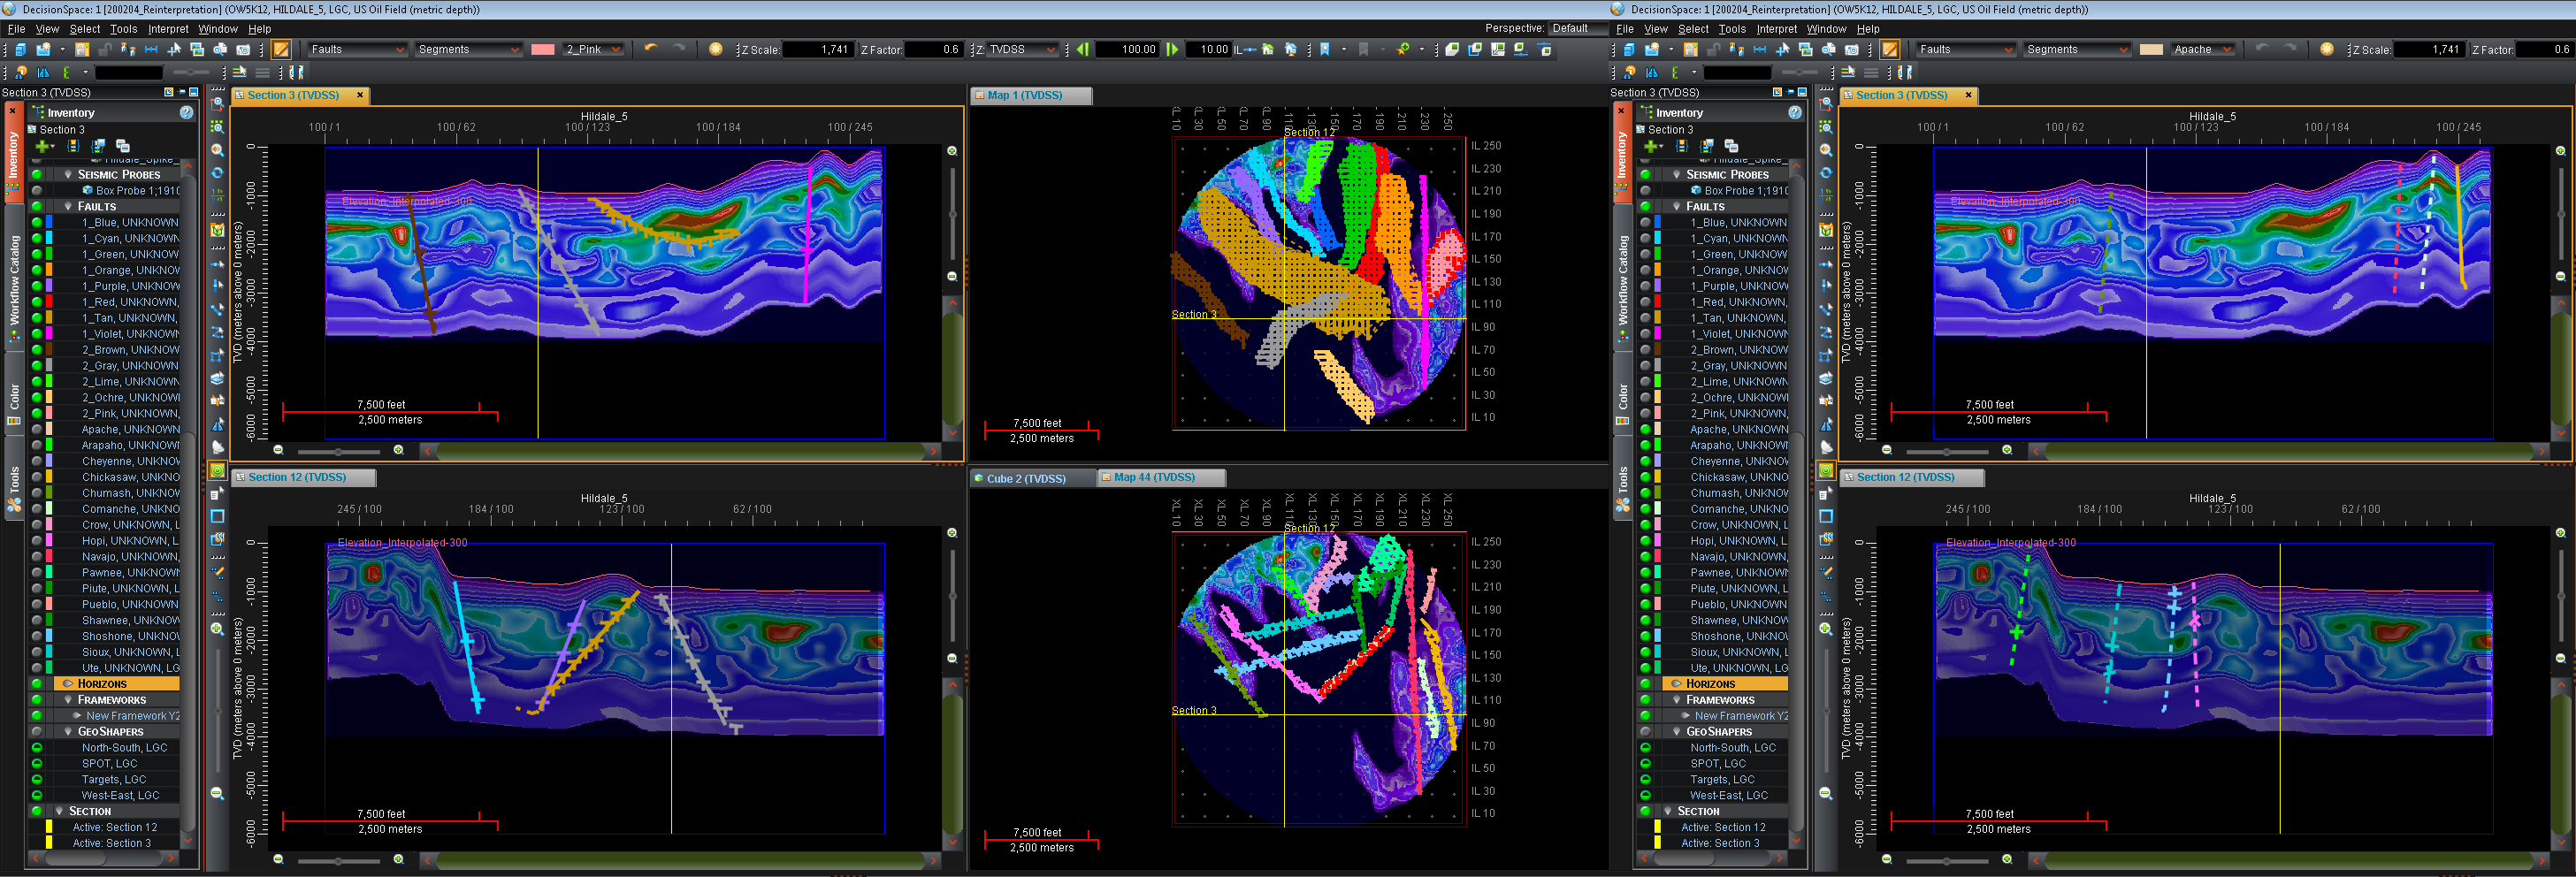
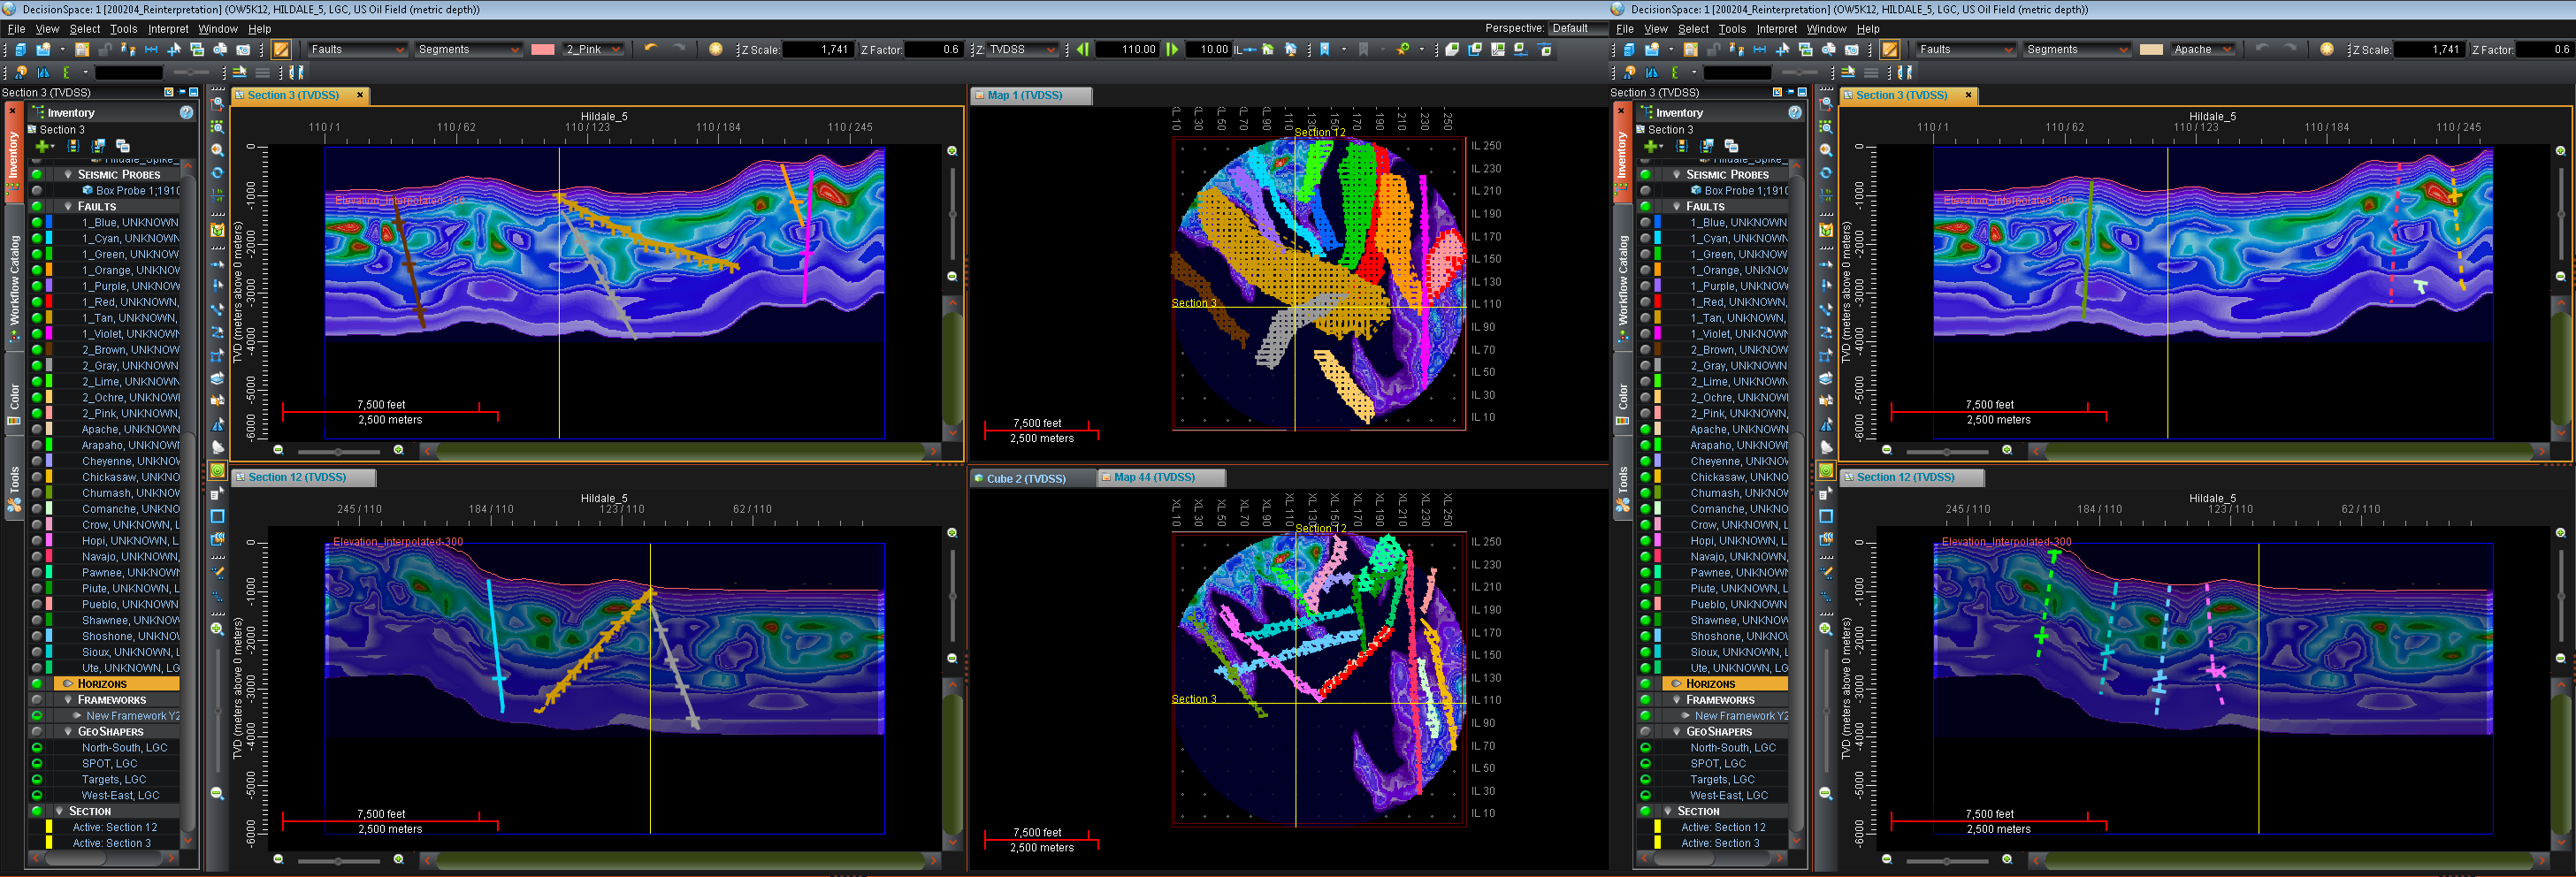
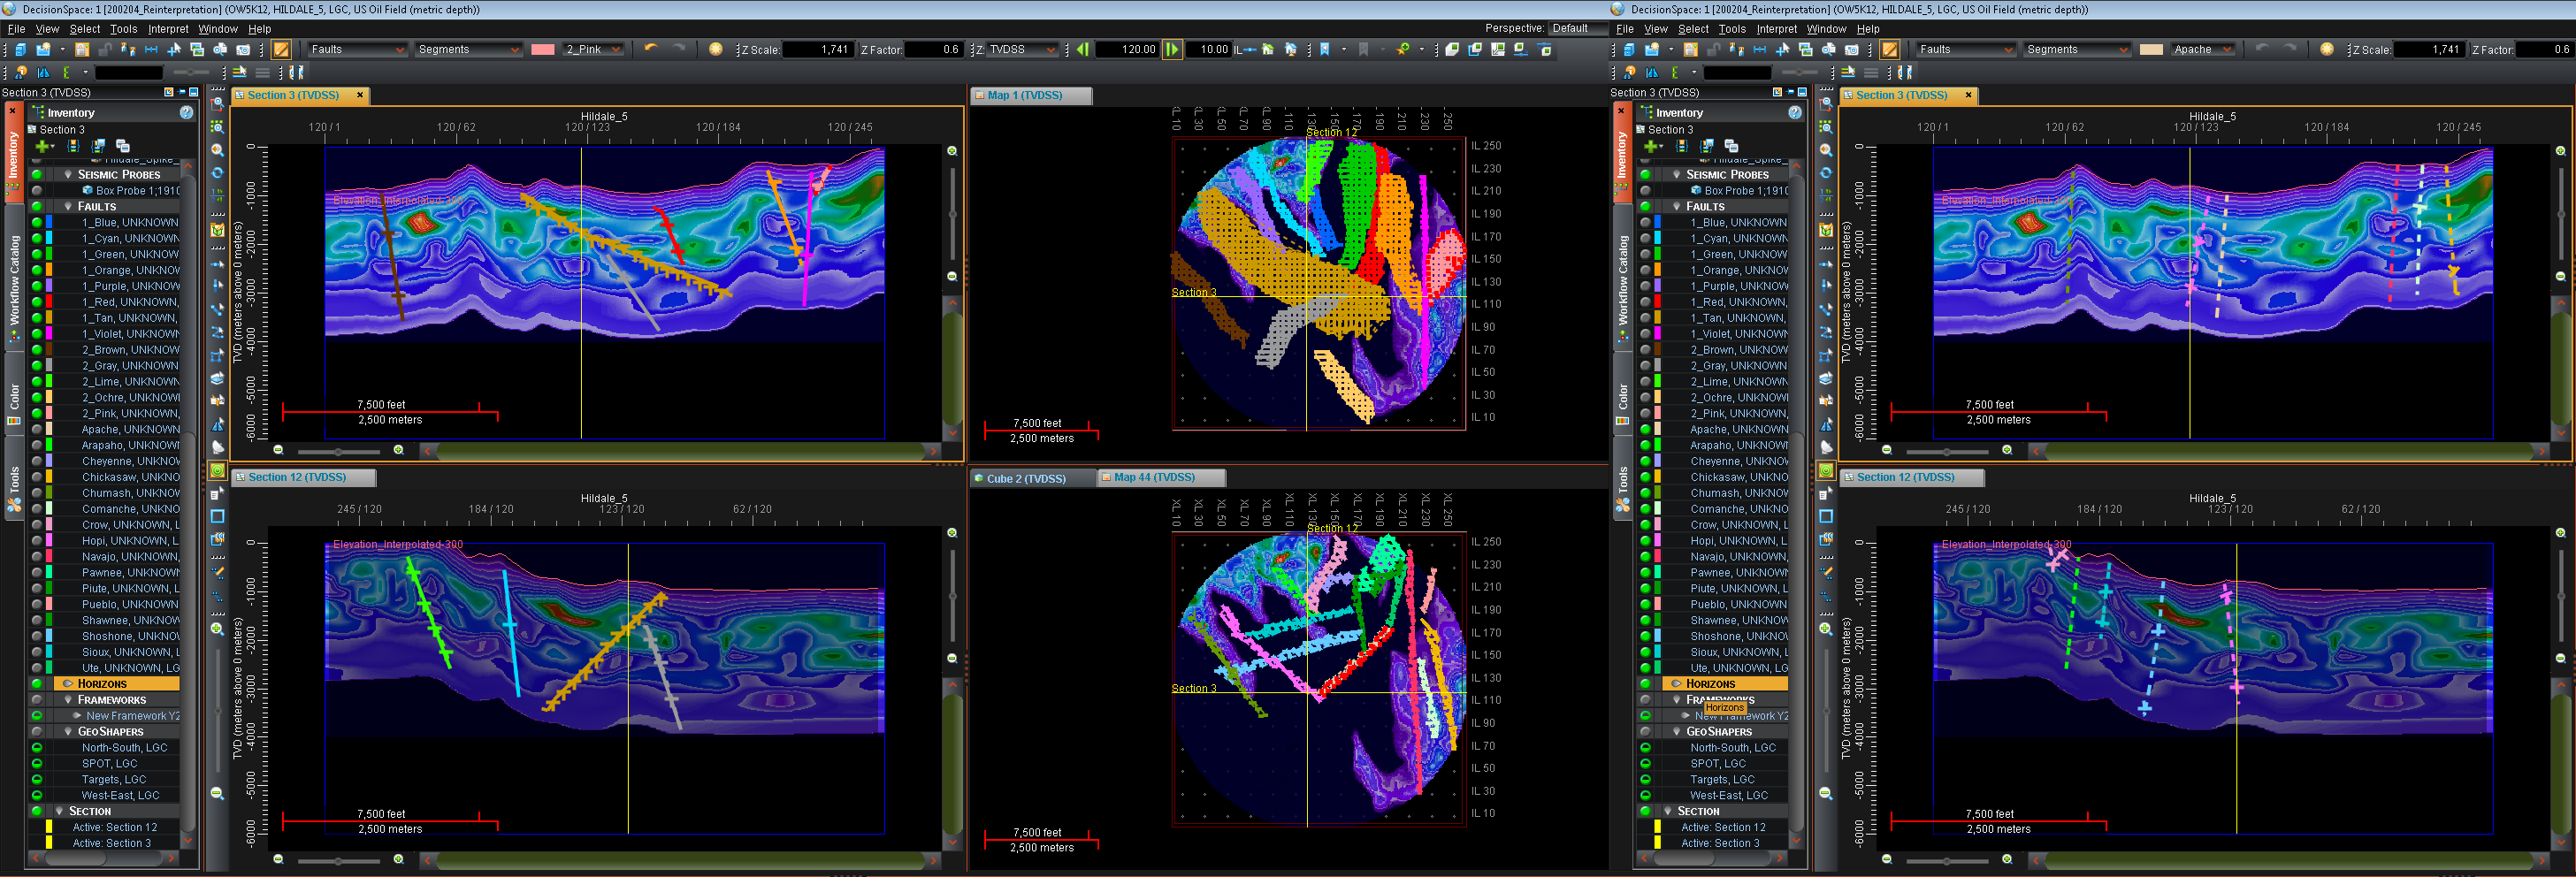
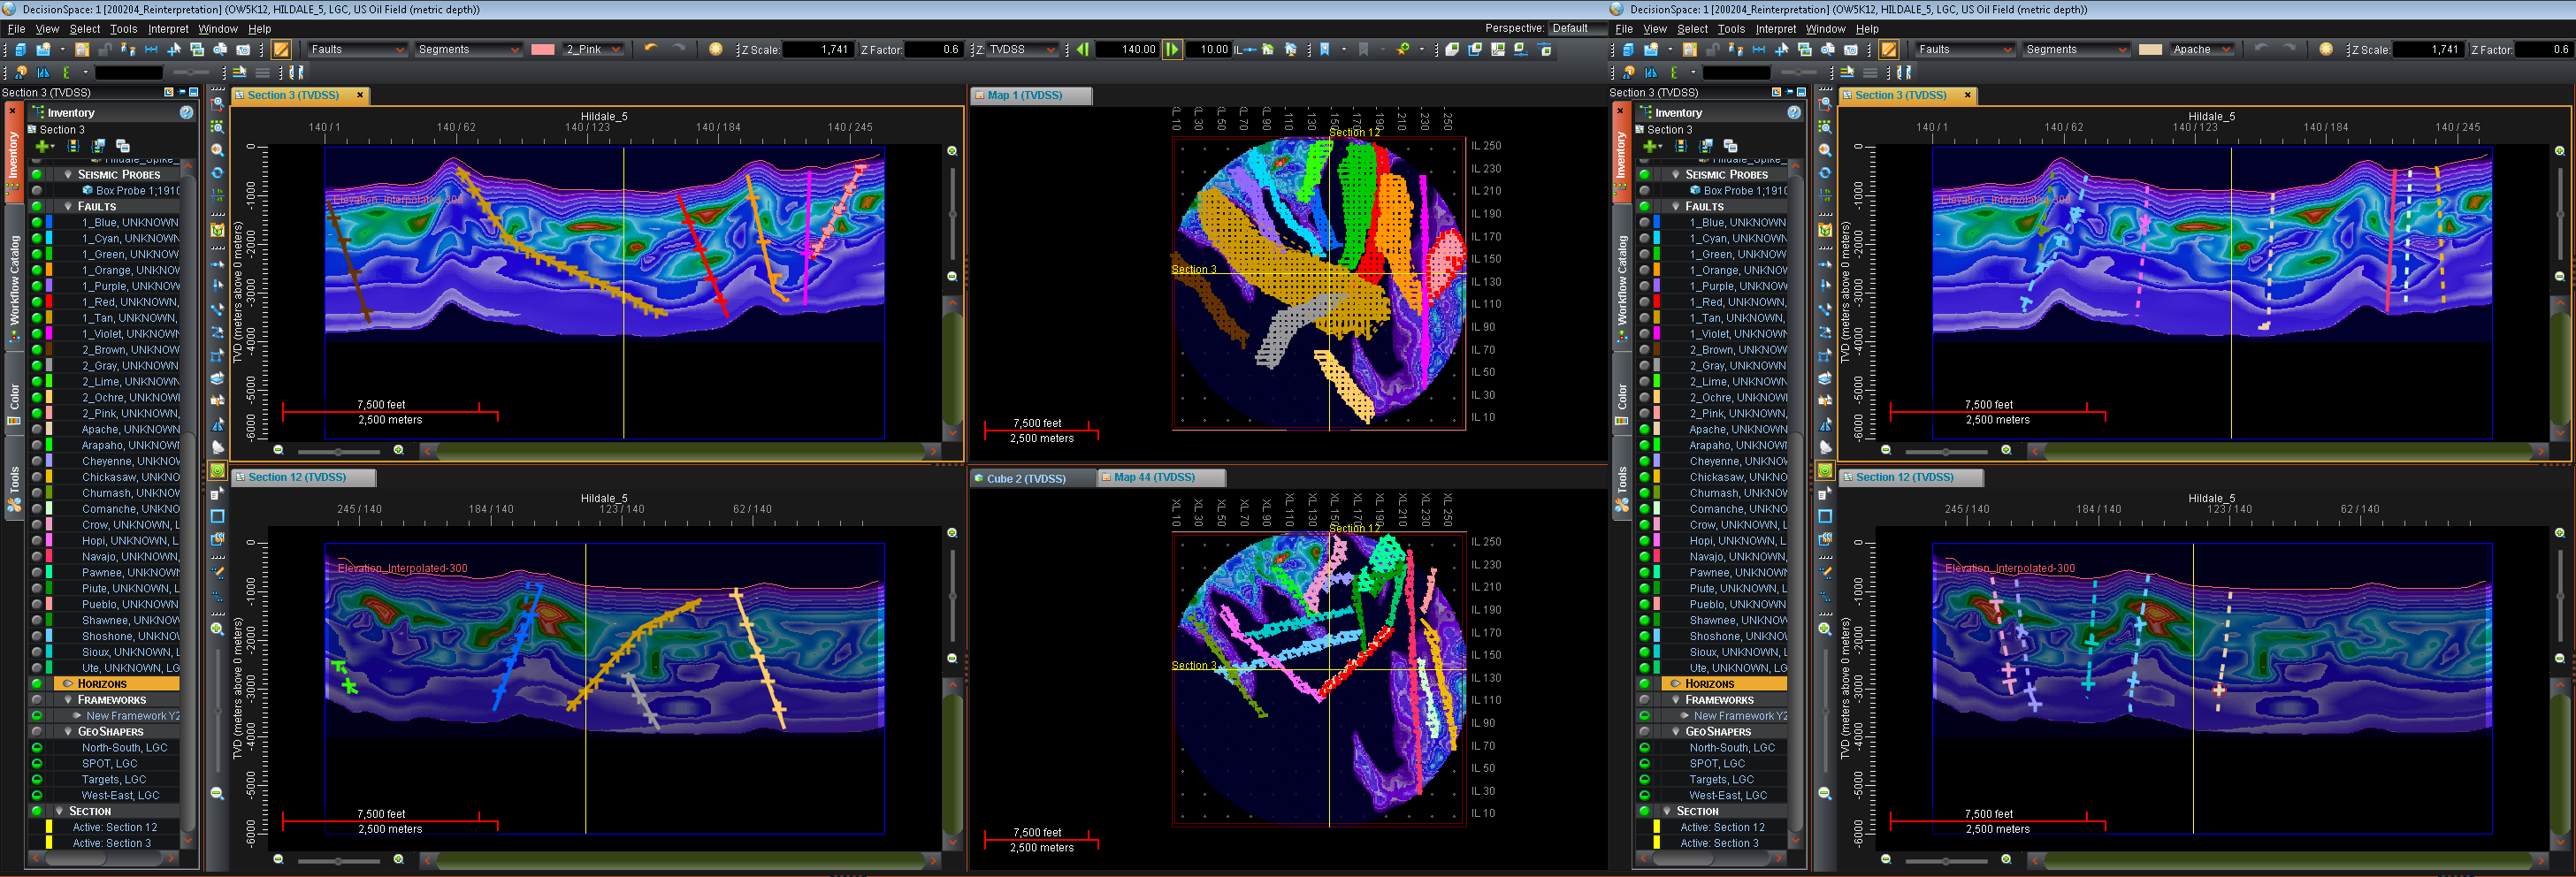
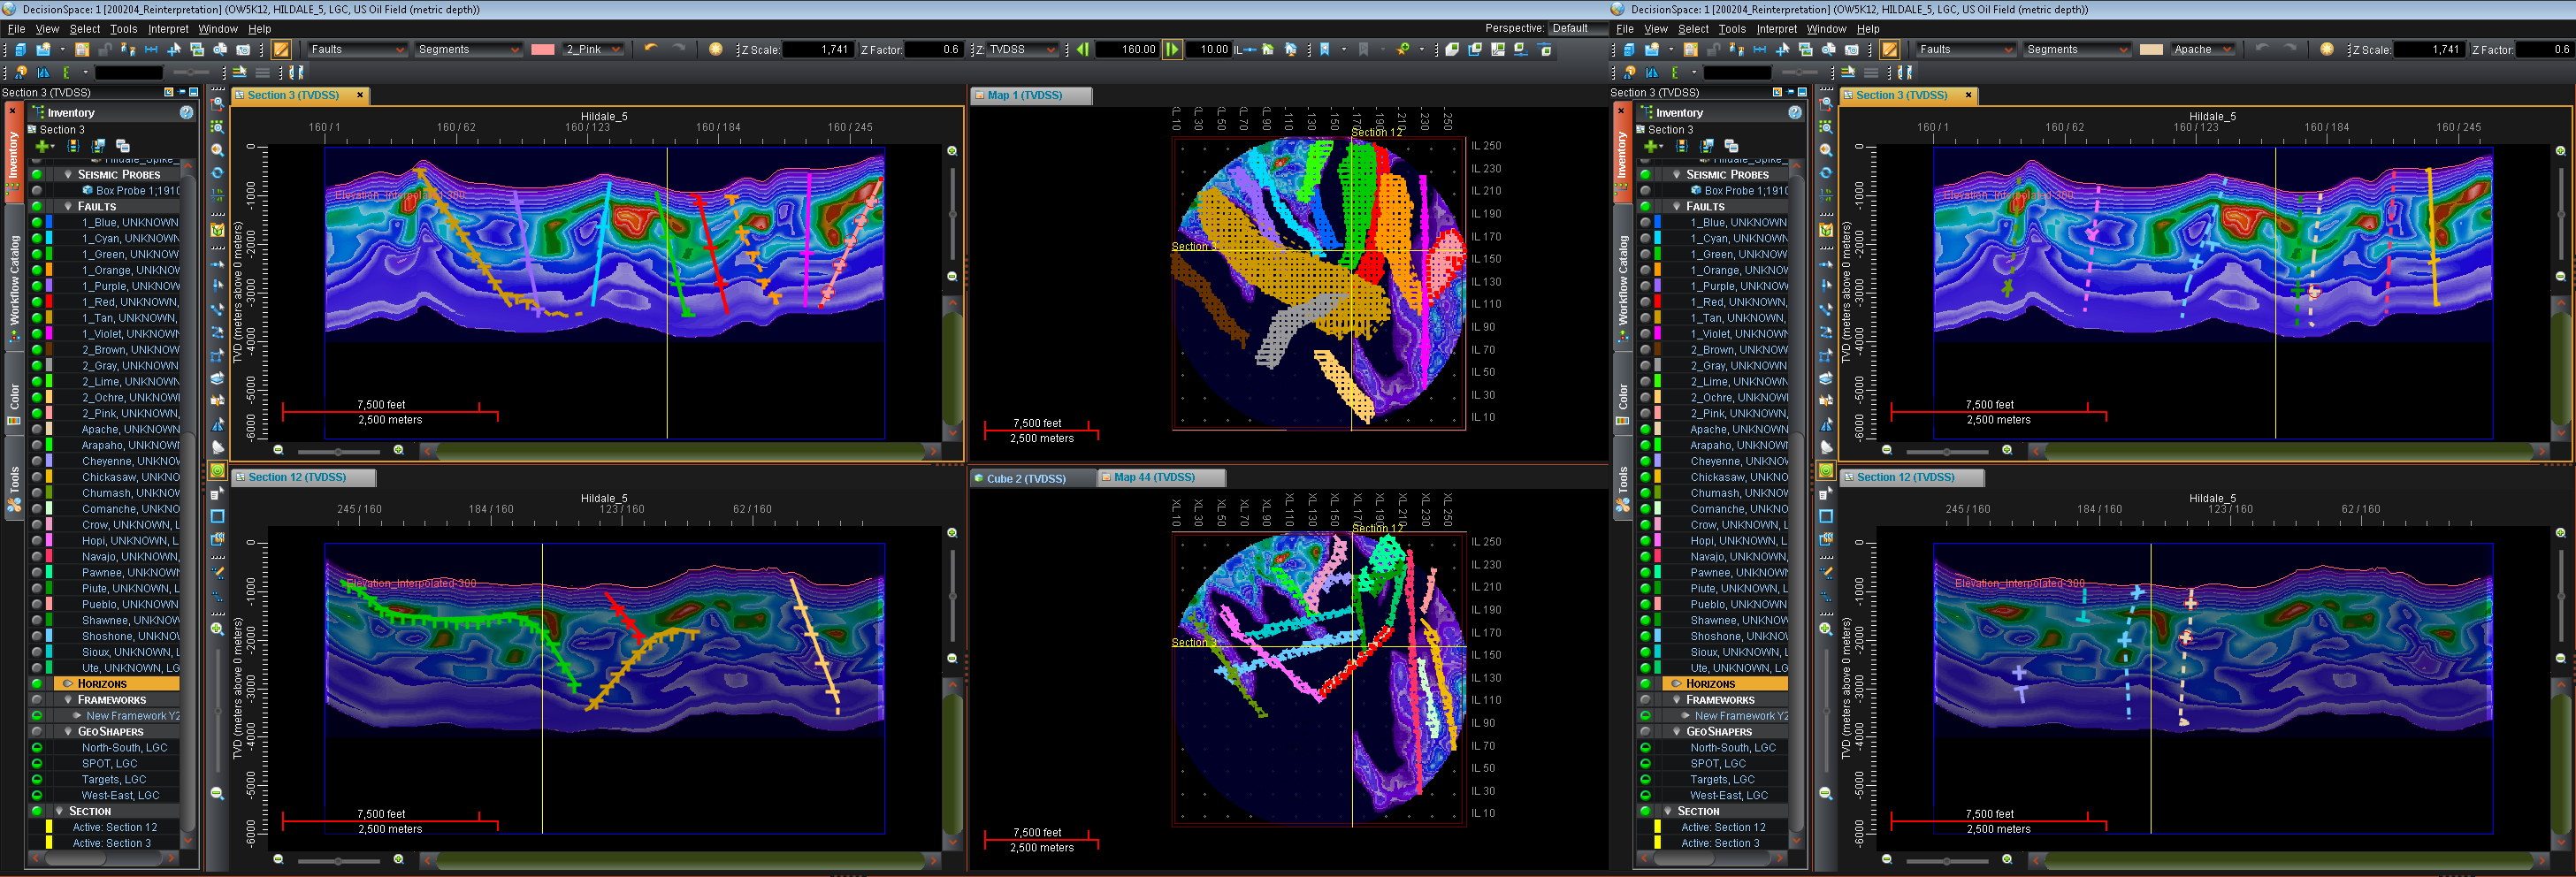
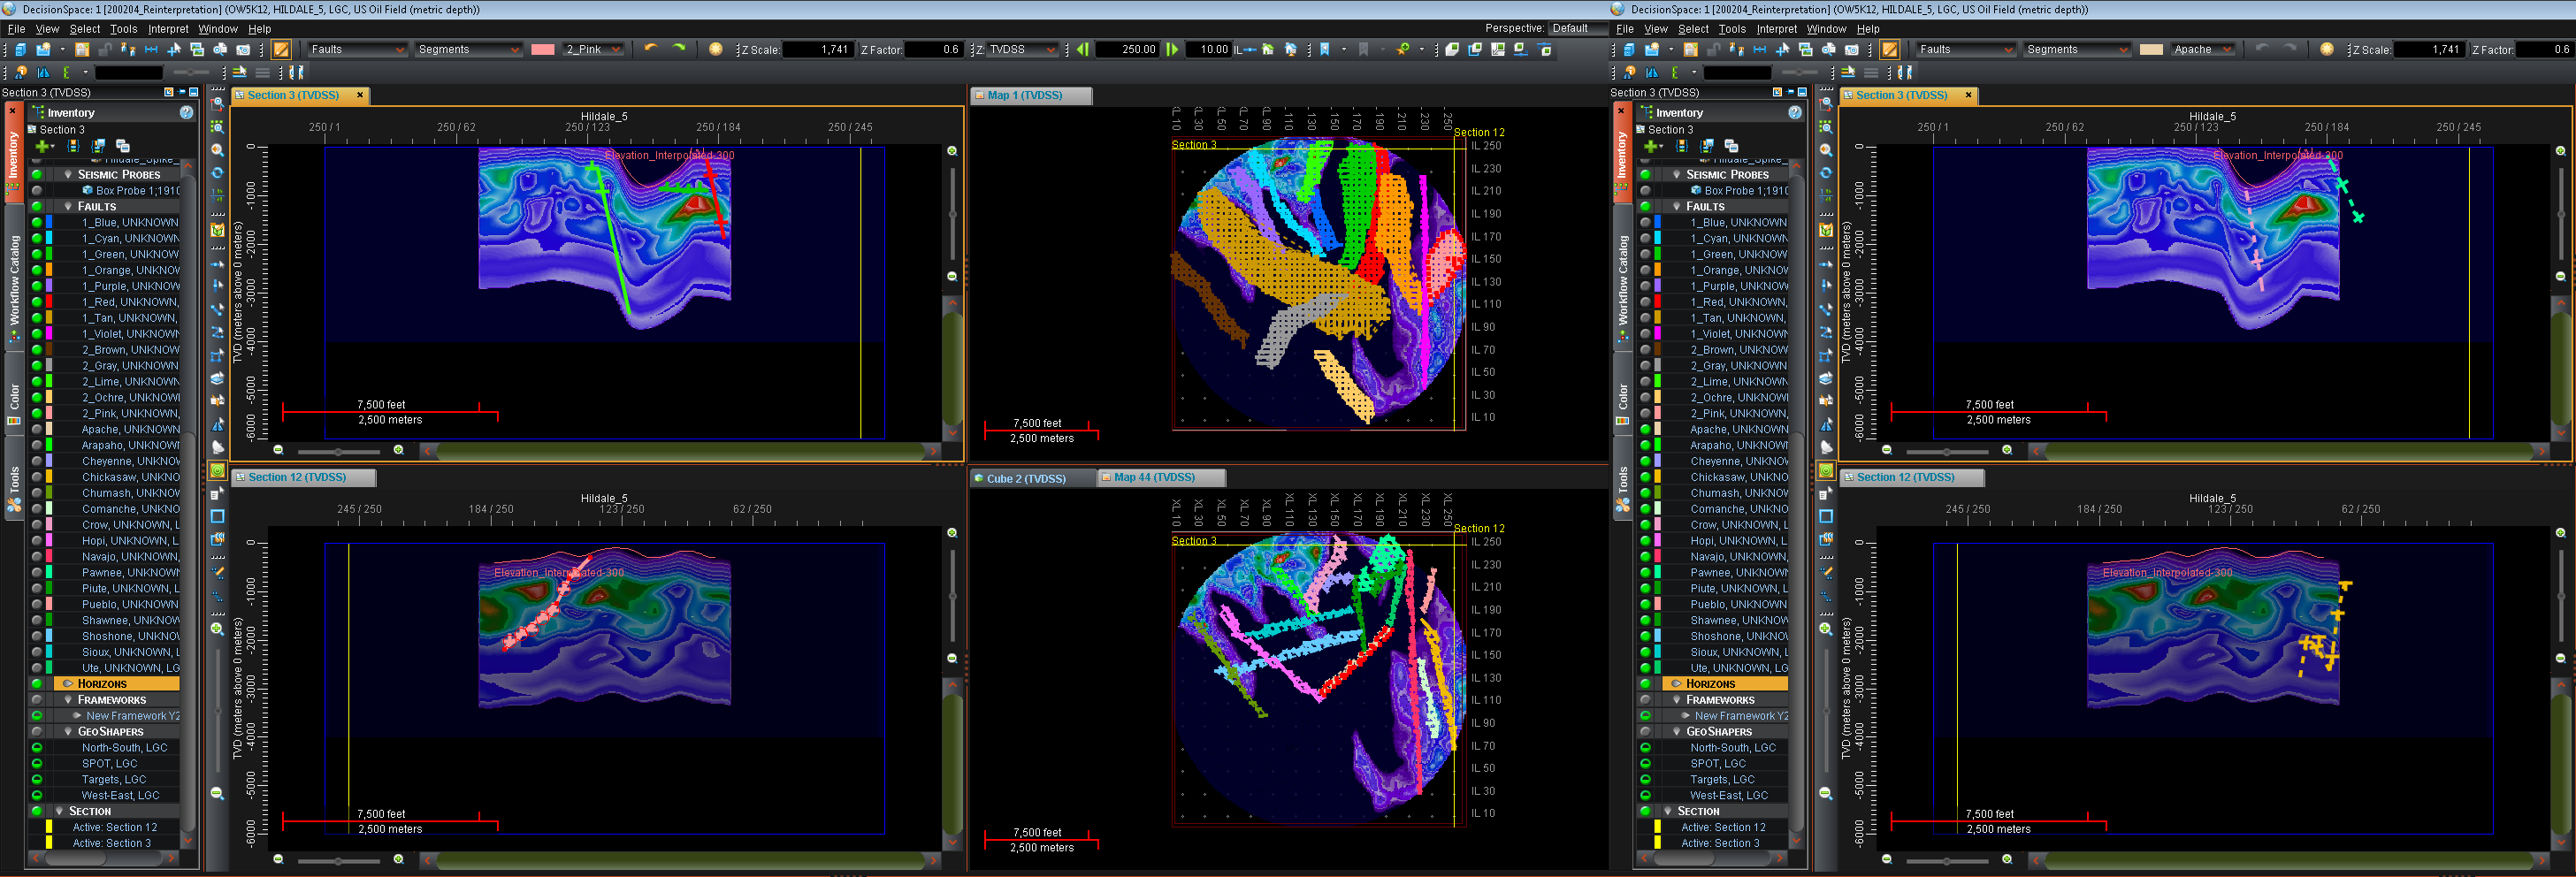
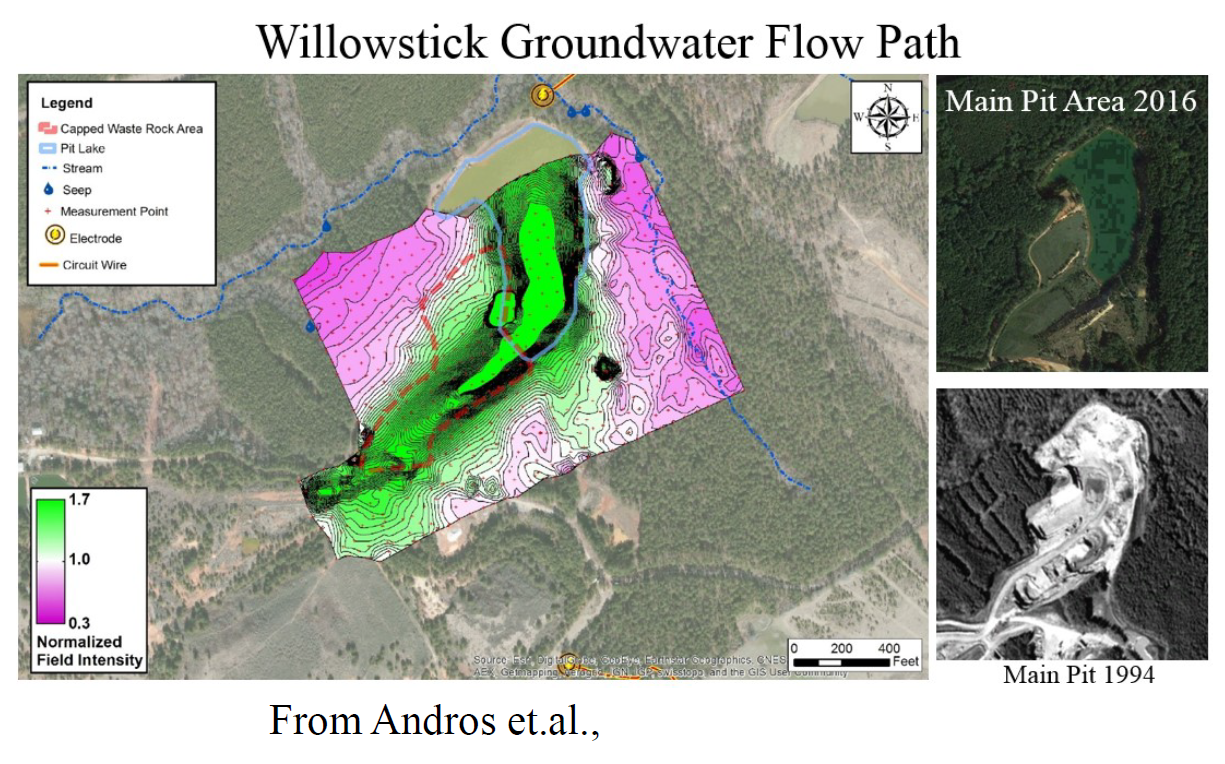
![](Hildale_01_N-S_GoogleEarth_Profile.png) | ![](Hildale_02_W-E_GoogleEarth_Profile.png) |
![](Hildale_03_SPOT_Circumference_GoogleEarth_Profile.png) | ![](Hildale_04_Closest_Utah+Arizona_Wells.png) |
![](Hildale_05_Willowstick_Summary_Map.png) | ![](Hildale_06_HydroSource_Favorable_Zones.png) |
![](Hildale_07_Data_Limits_Cleaned_Lightning_Data.png) | ![](Hildale_08_Grid_Strokes_Risk-Points.png) |
![](Hildale_09_Six_Attribute_Maps.png) | ![](Hildale_10_Six_Attribute_Maps.png) |
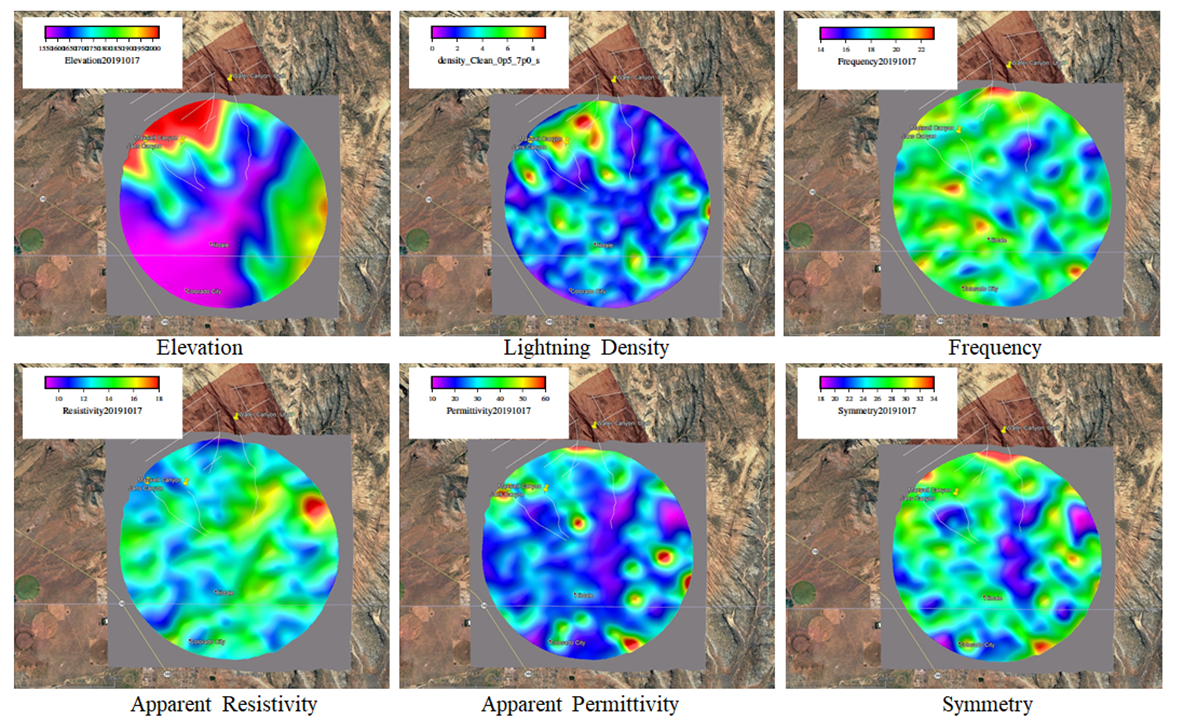
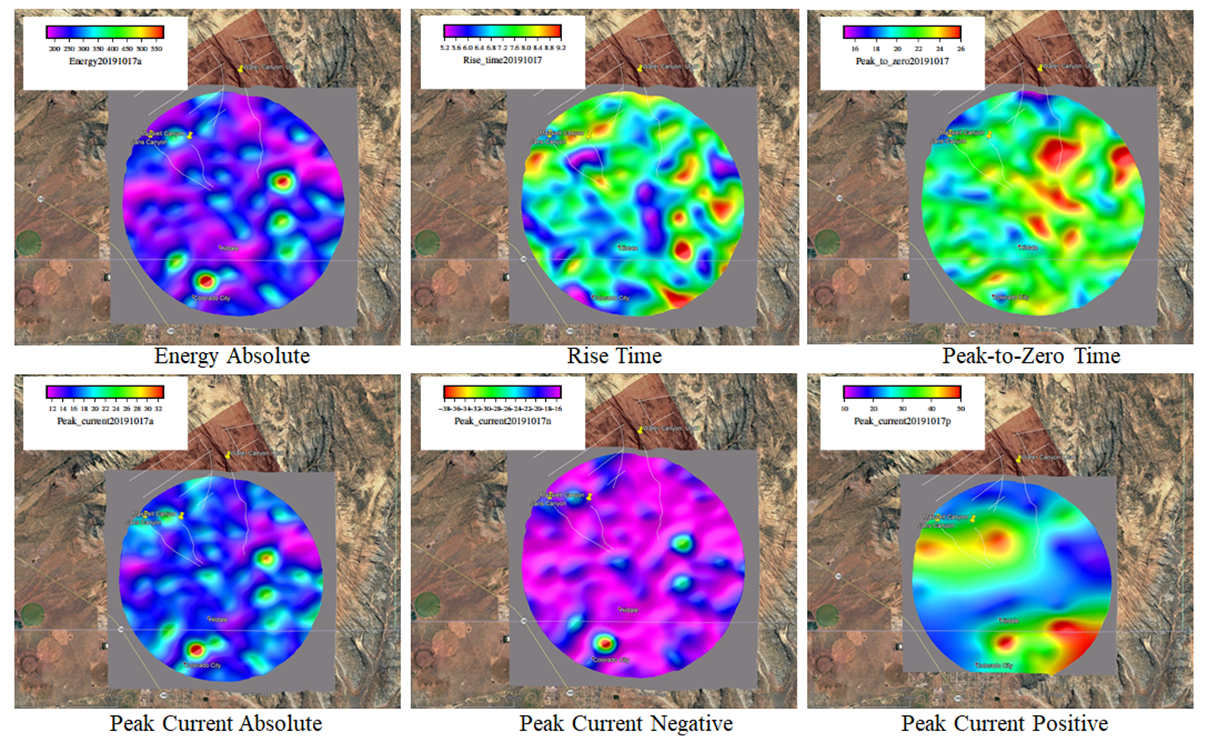
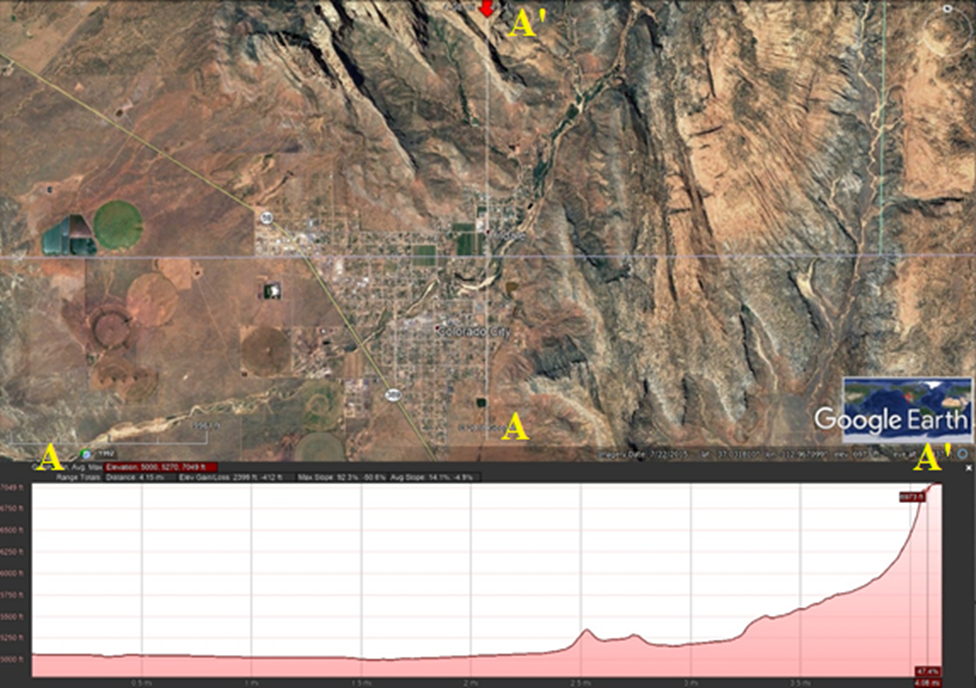
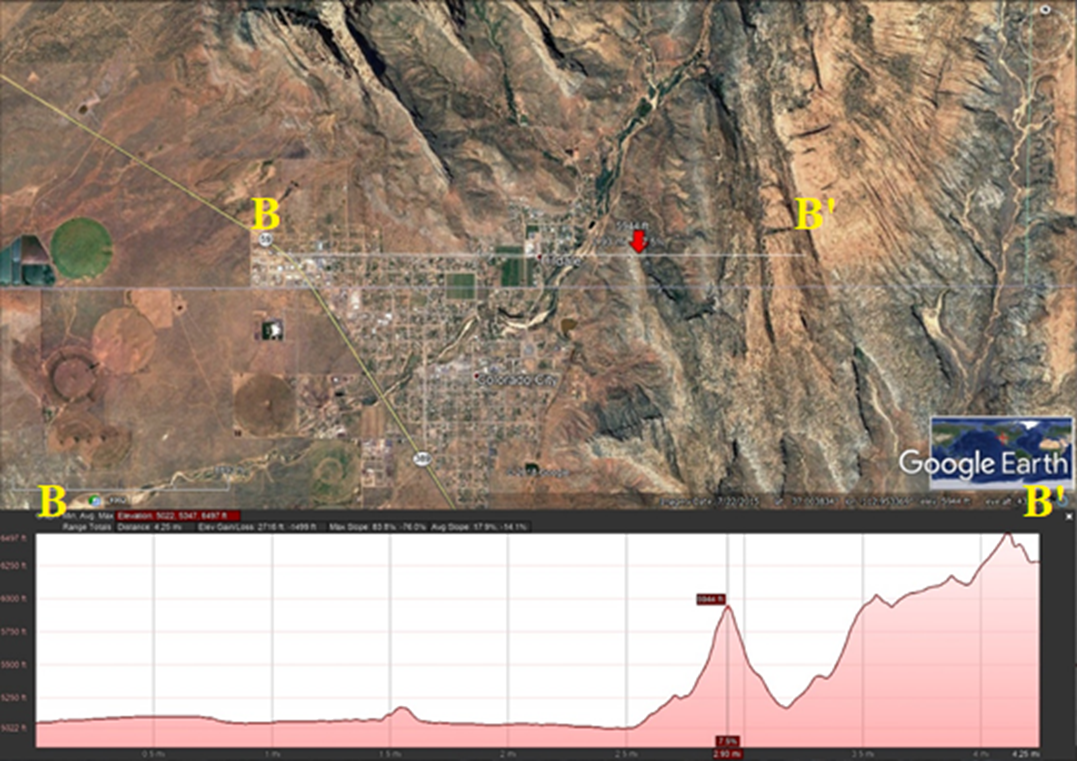
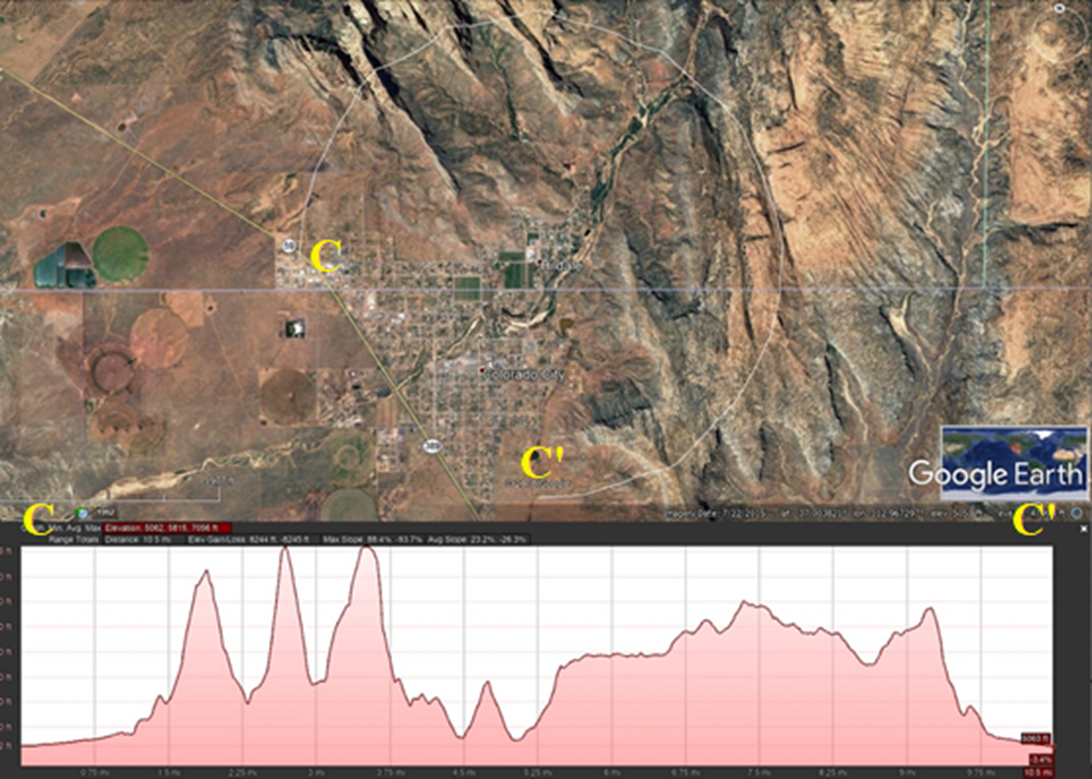
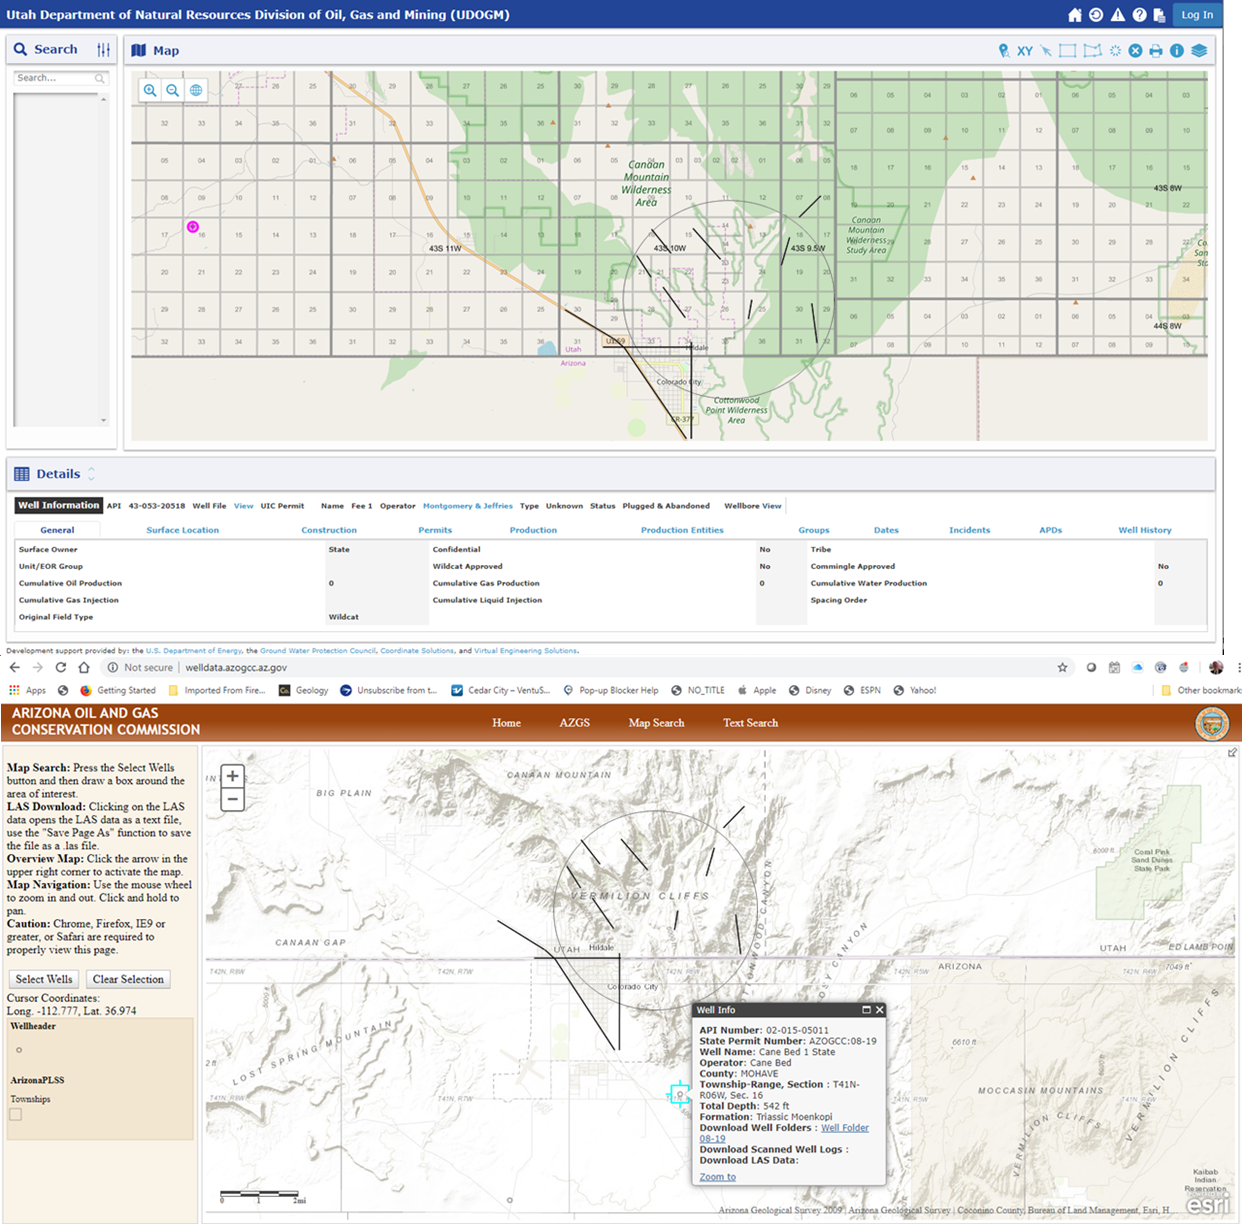
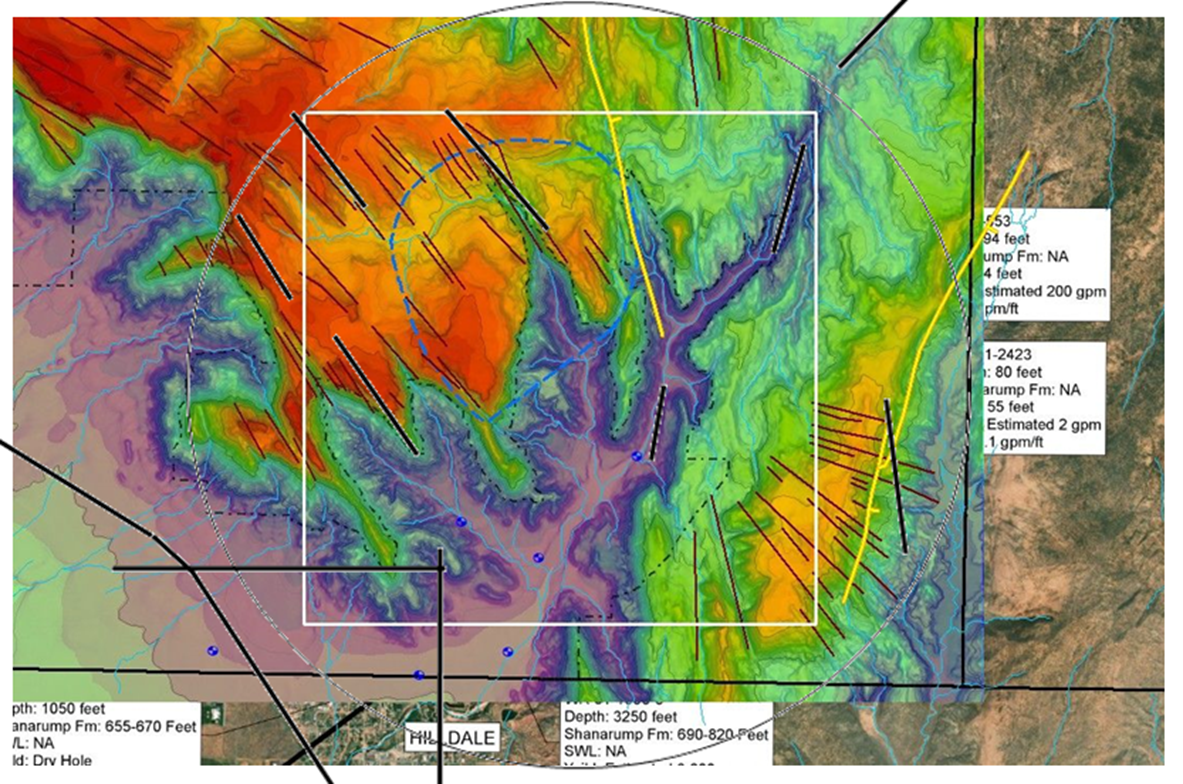
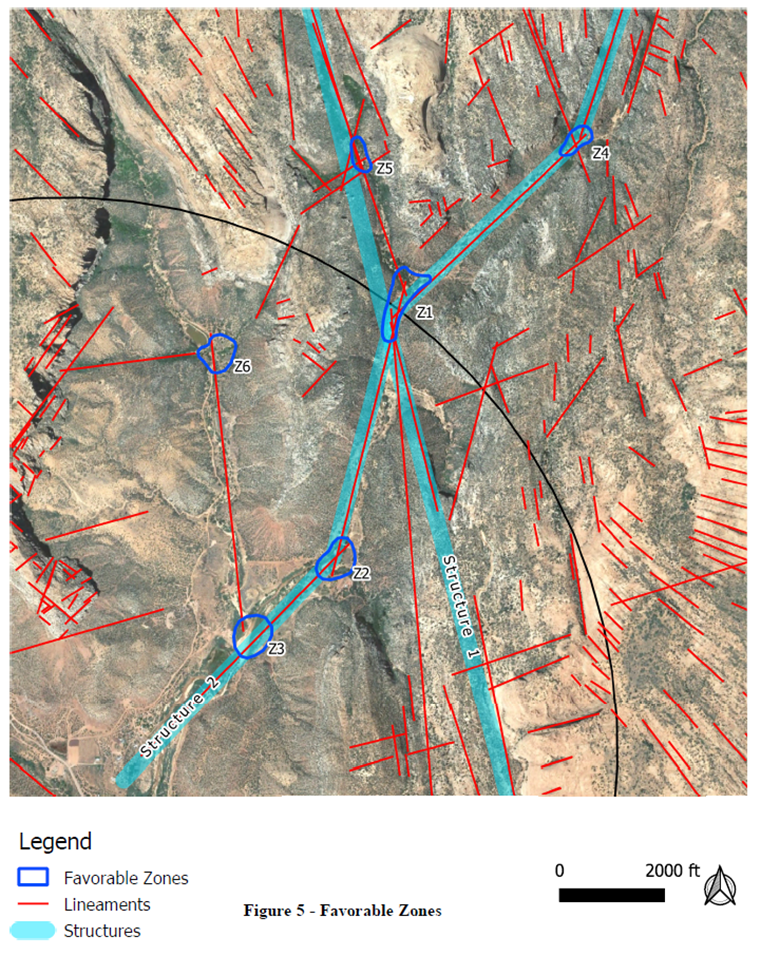
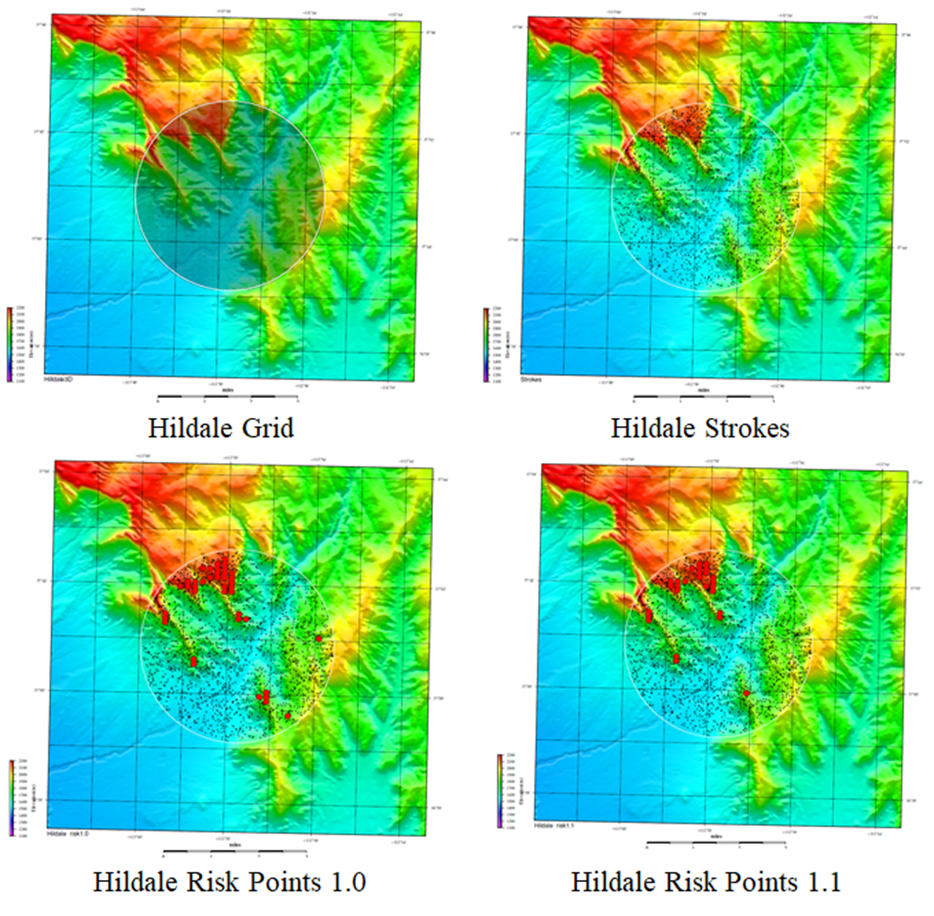
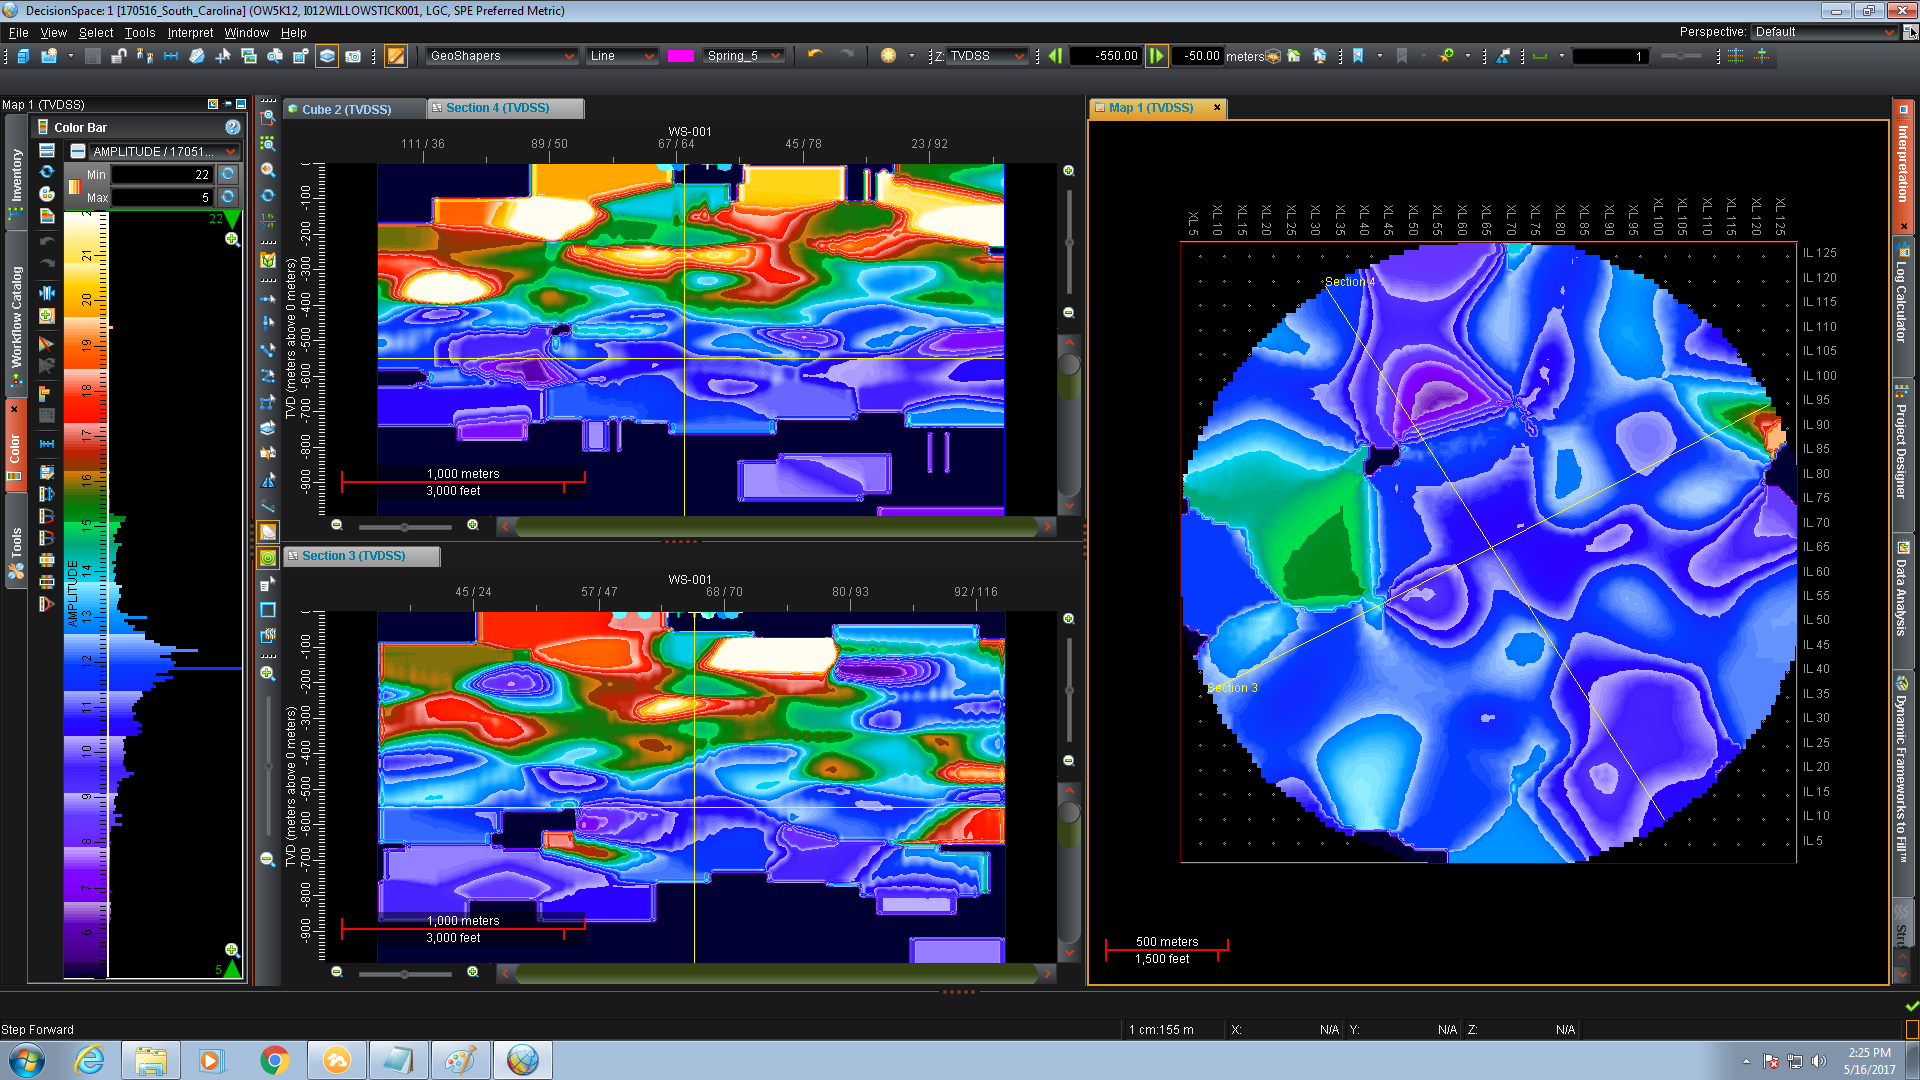
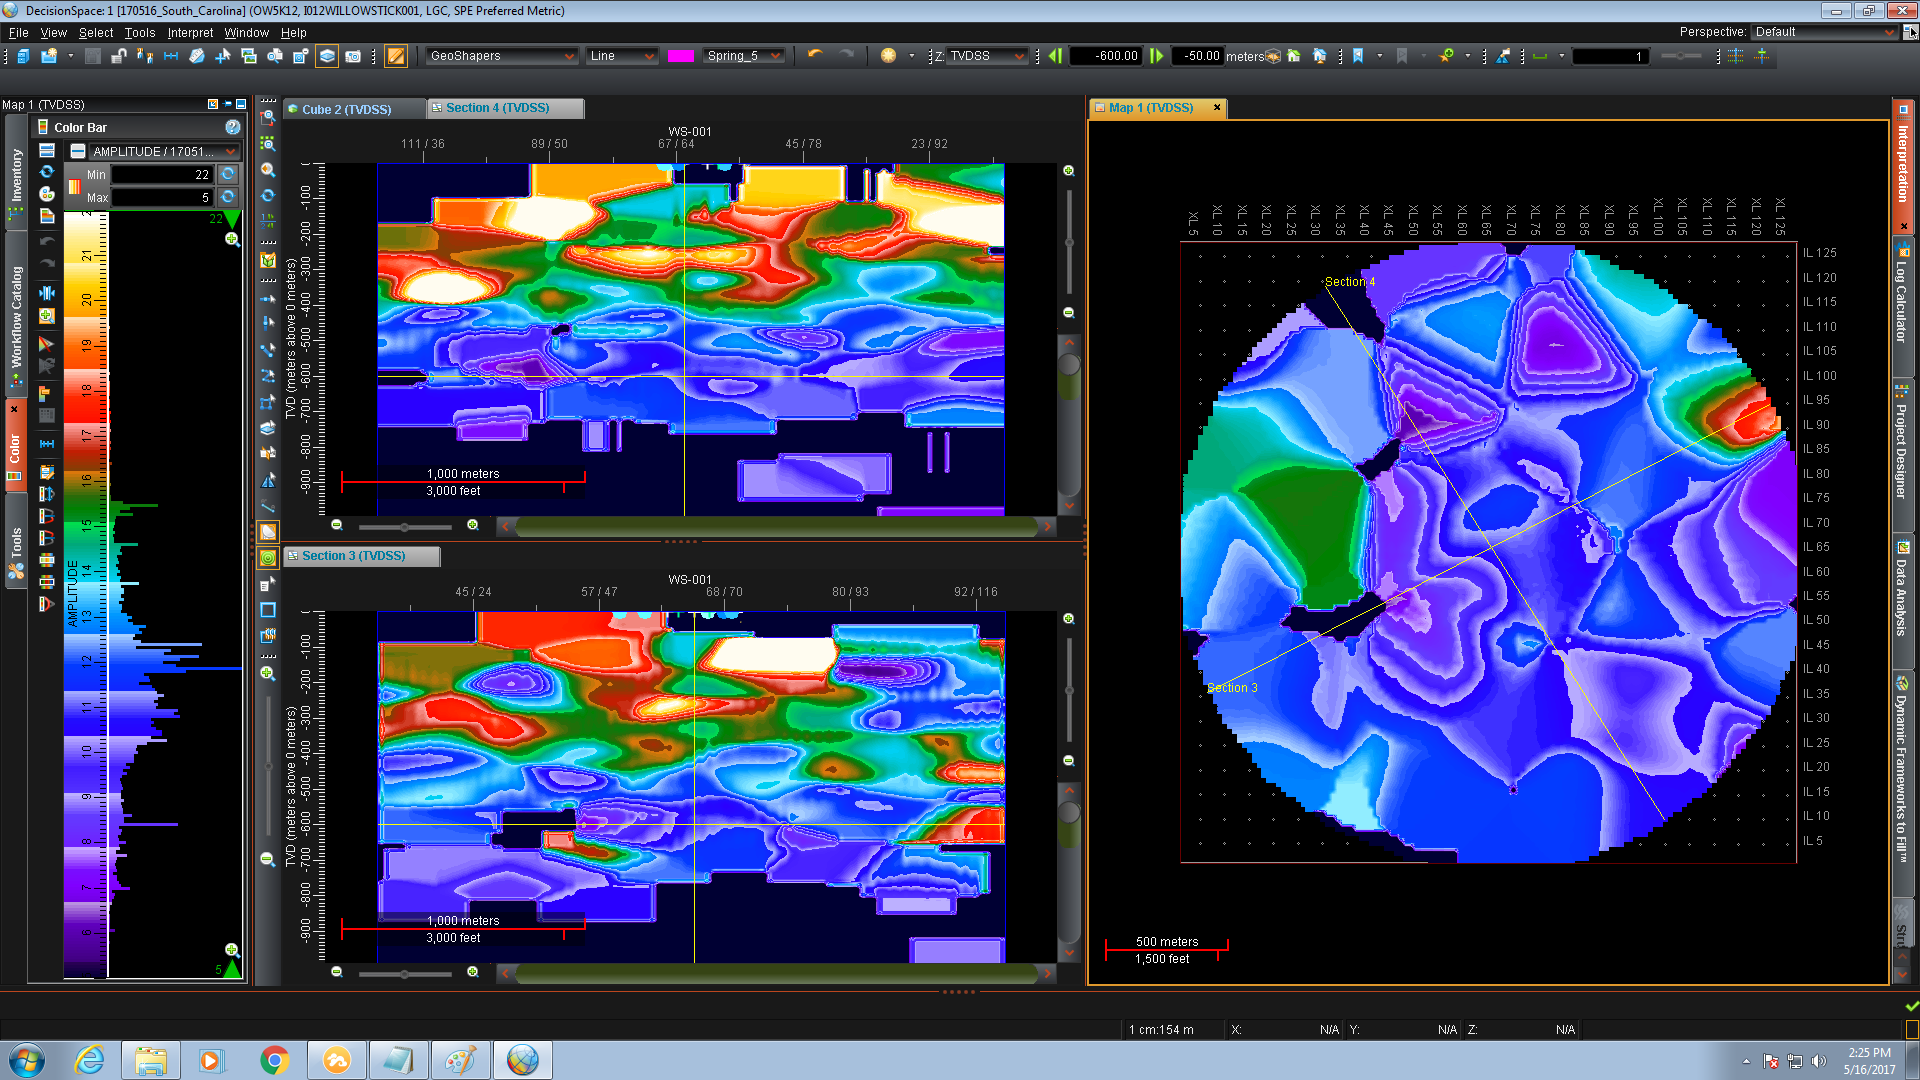
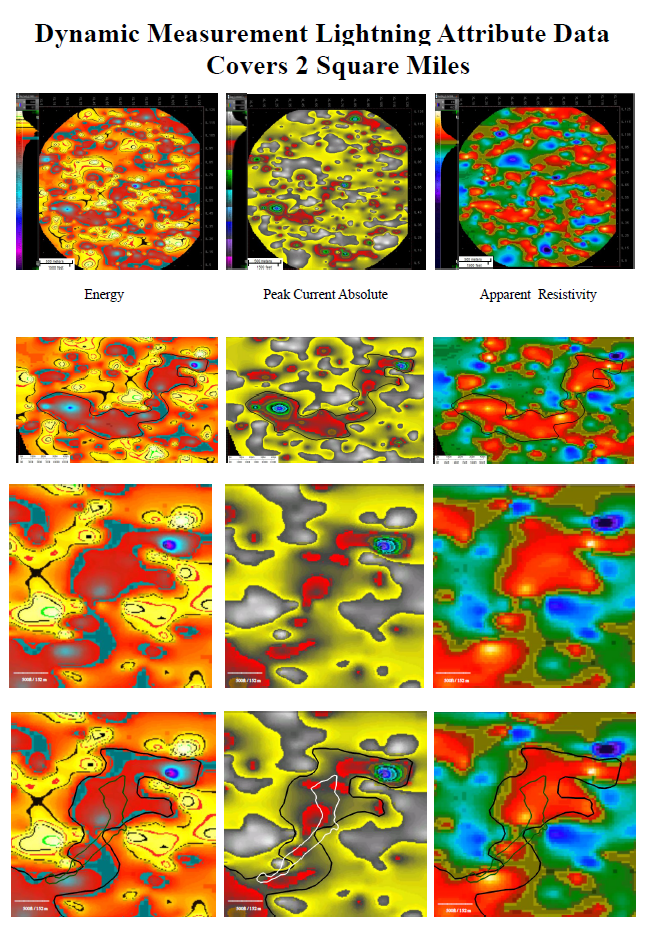
GoogleEarth Profile S-N | GoogleEarth Profile W-E |
Profile around Circumfrance | Wells in Area Arizona & Utah |
Willowstick Summary Map | HydroSource Favorable Zones |
Data Limits Lightning Data | Grid, Strokes, 2 Risk Point Maps |
Elev, Den, Freq, Rock Properties, Symmetry Maps | Energy, R-T, P2Z, PCa,n,p Maps |
![](Hildale_11_Six_Attribute_Maps.png) | ![](Hildale_12_Passive_Seismic_Profiles.png) |
![](Hildale_13_Apparent_Resistivity_Along_Passive_Seismic_Profiles.png) | ![](Hildale_14_Slices_Apparent_Resistivity.png) |
![](Hildale_15_N_NE_resistivity_geoshapes_faults_planes.png) | ![](Hildale_16_HydroSource_Lineaments_in_DecisionSpace.png) |
![](Hildale_17_Resistivity_NE_Corner_Spot.png) | ![](Hildale_18_Interpretation_Resistivity_NE_Corner_Spot.png) |
![](Hildale_19_Resistivity_Center_Spot.png) | ![](Hildale_20_Interpretation_Resistivity_Center_Spot.png) |
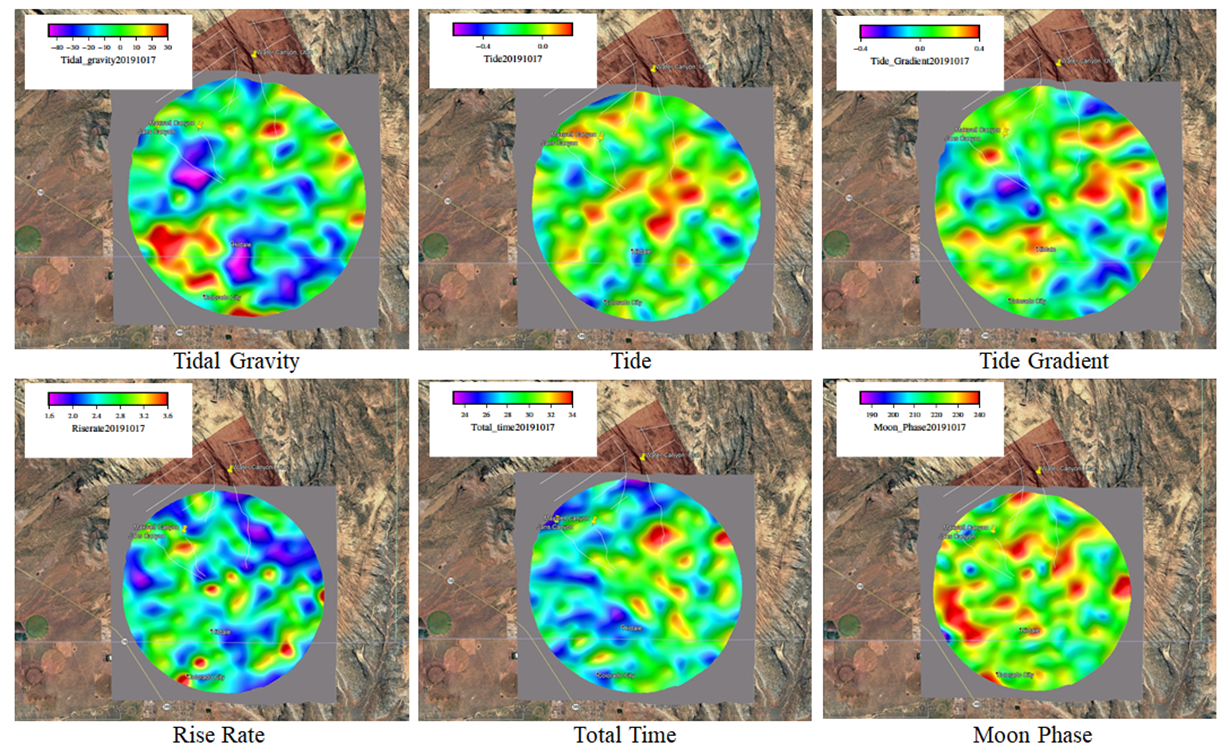
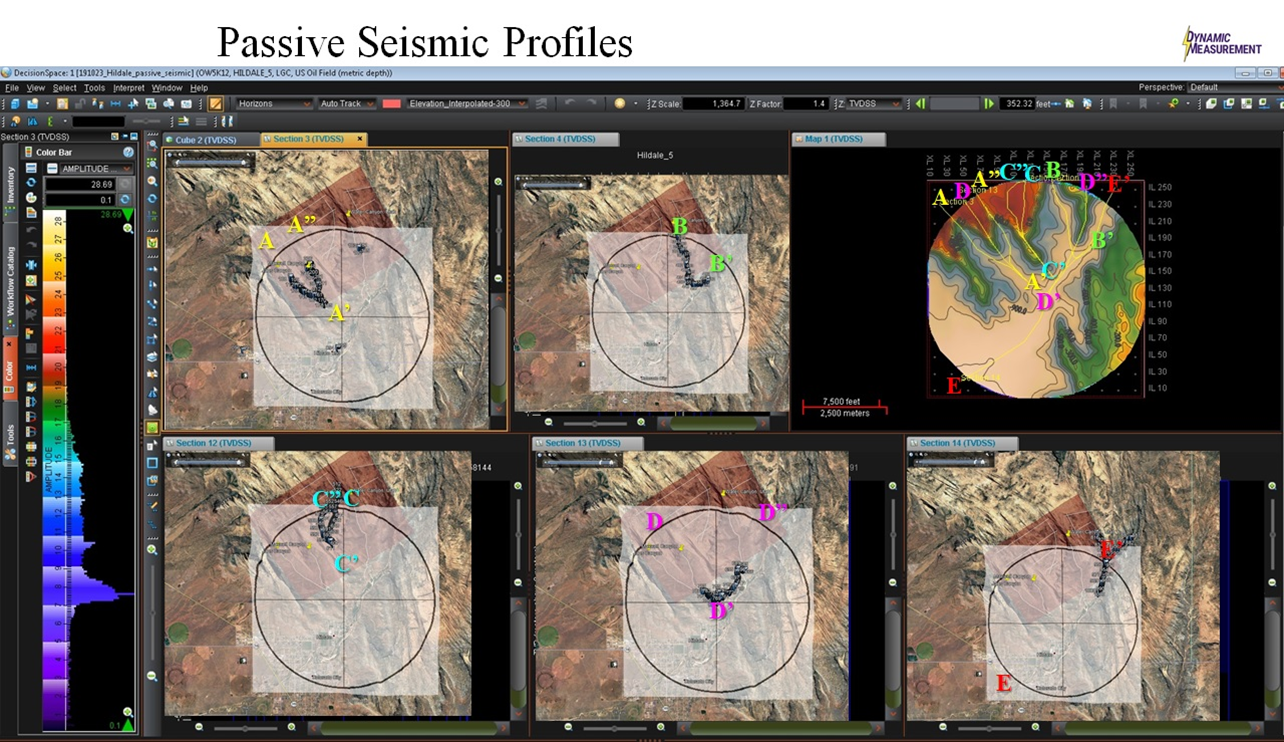
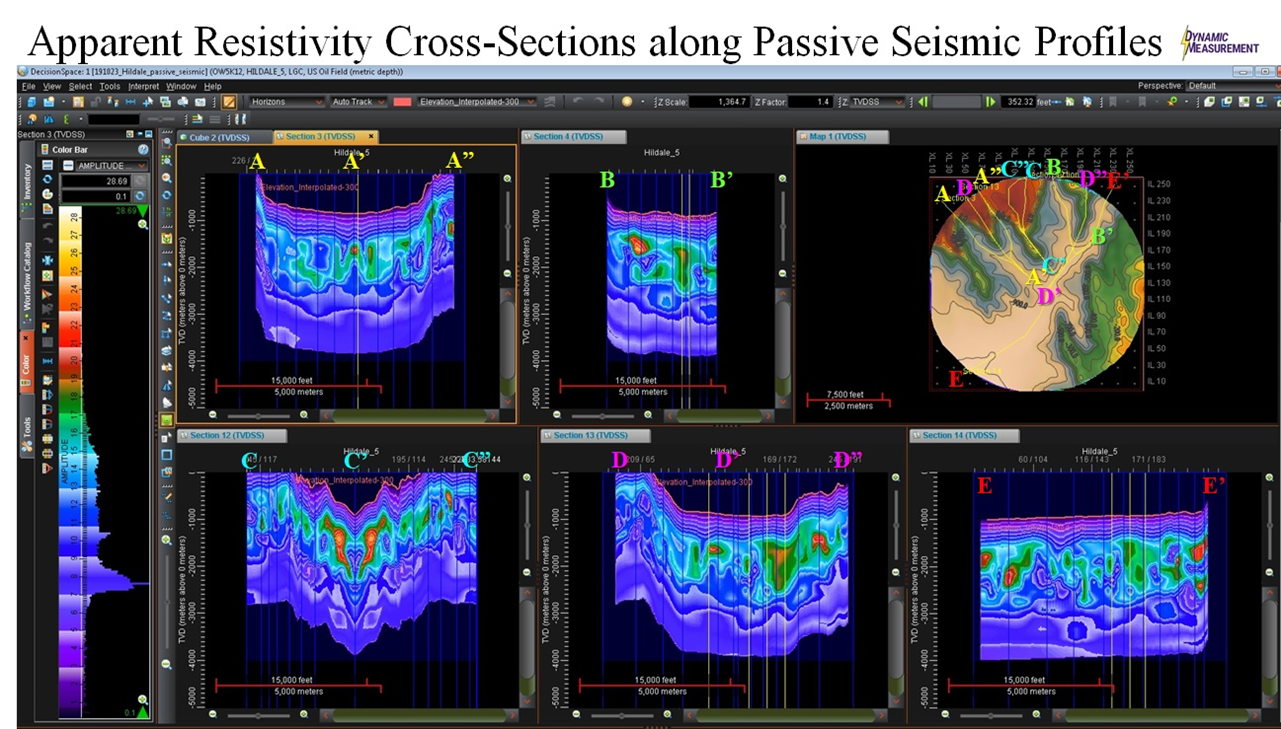
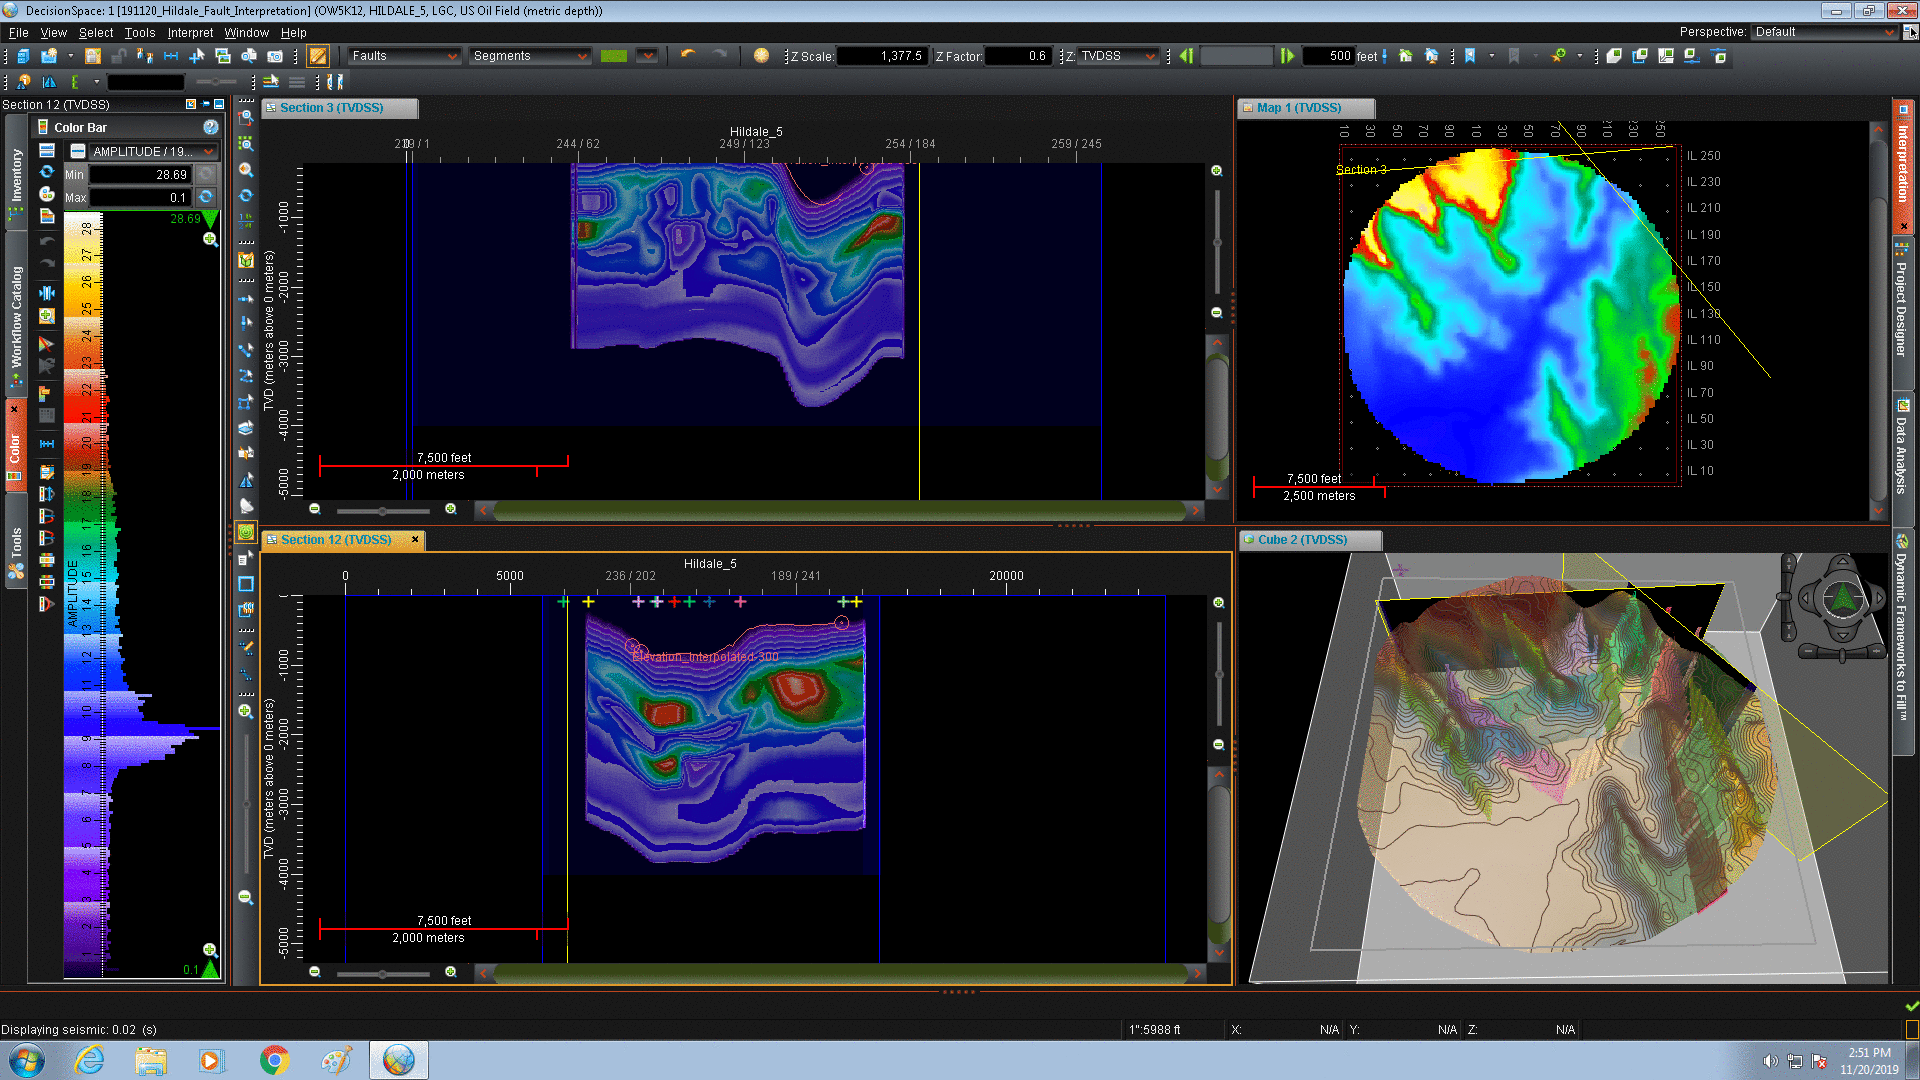
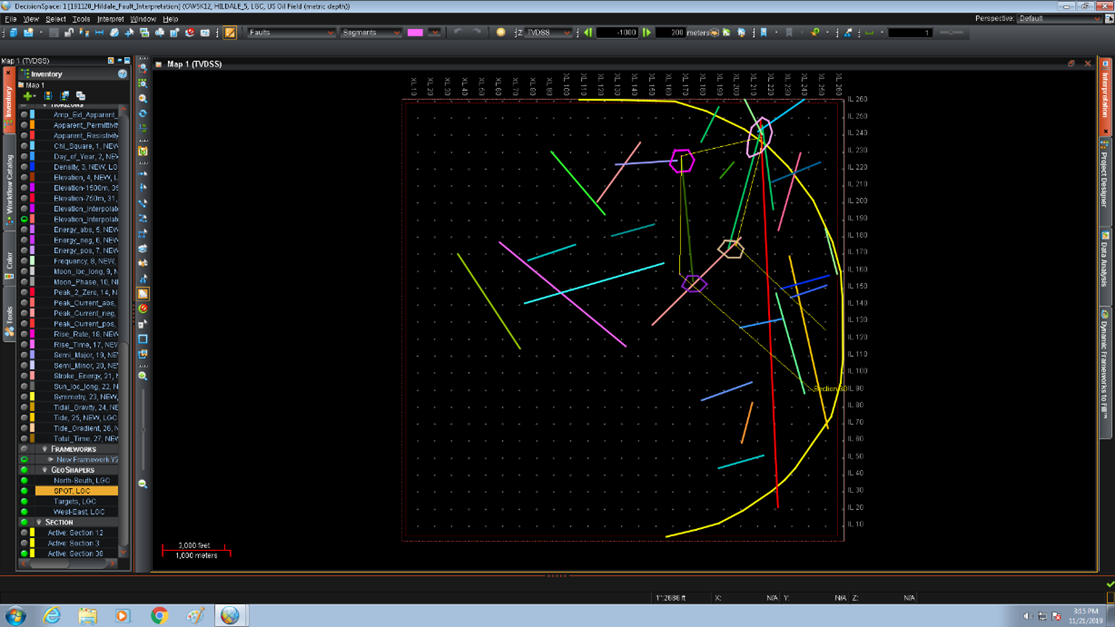
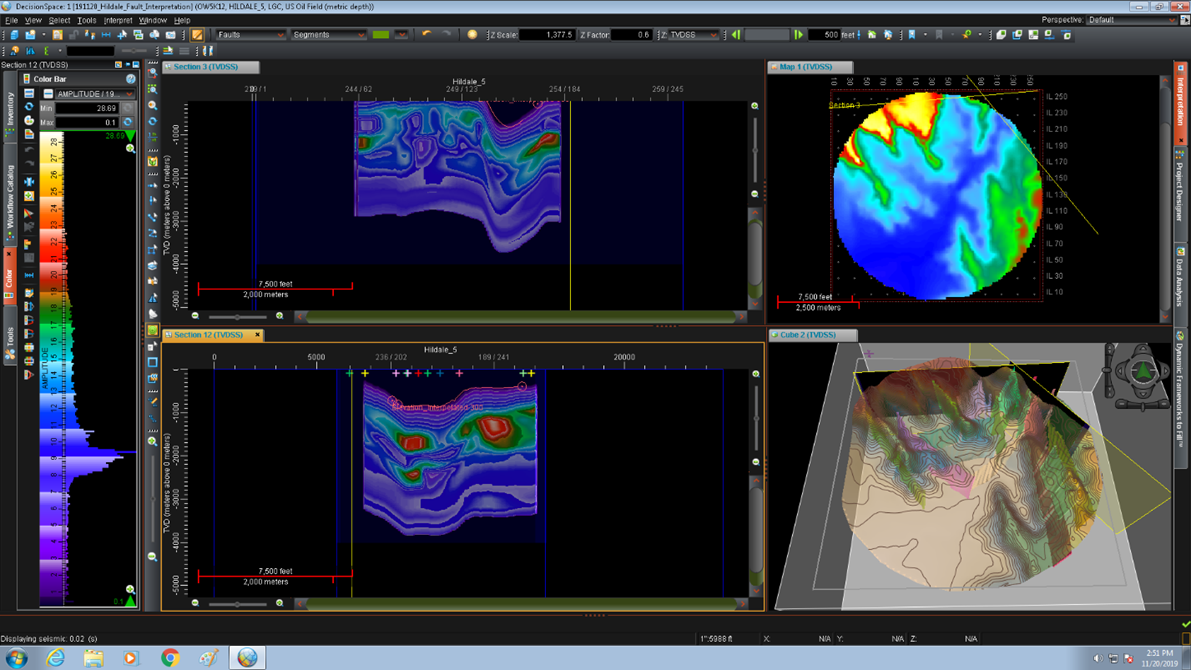
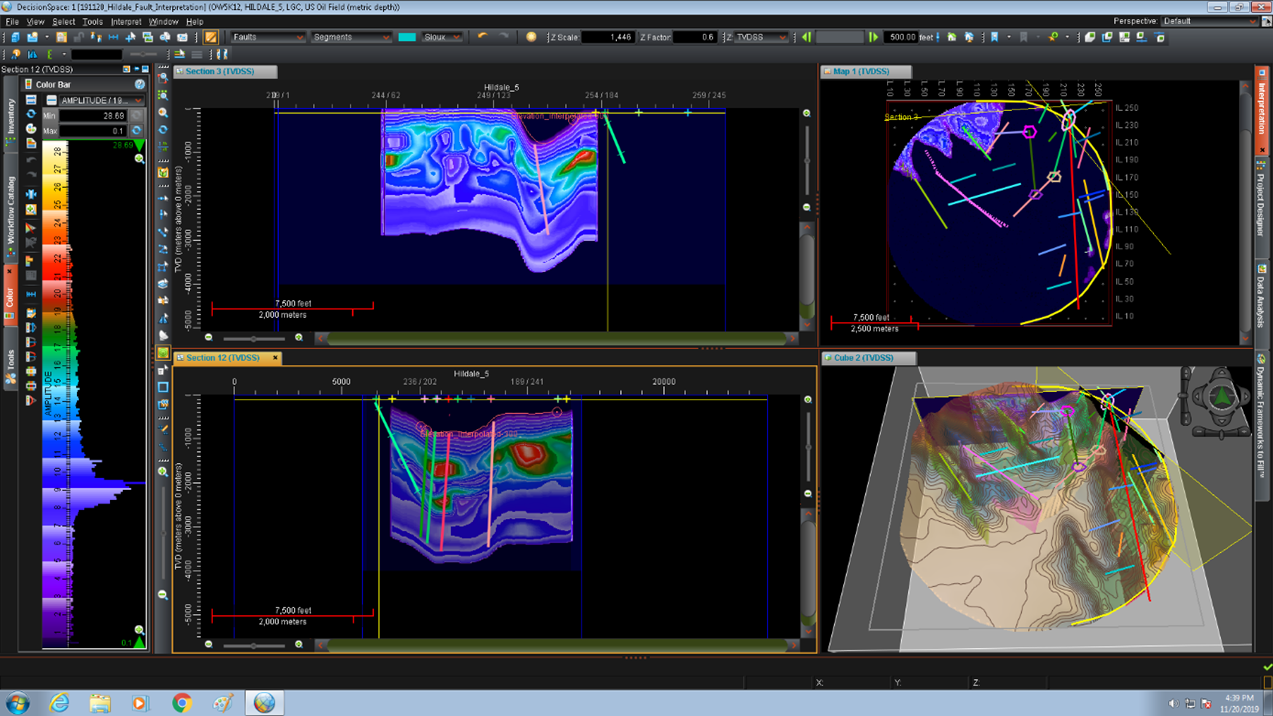
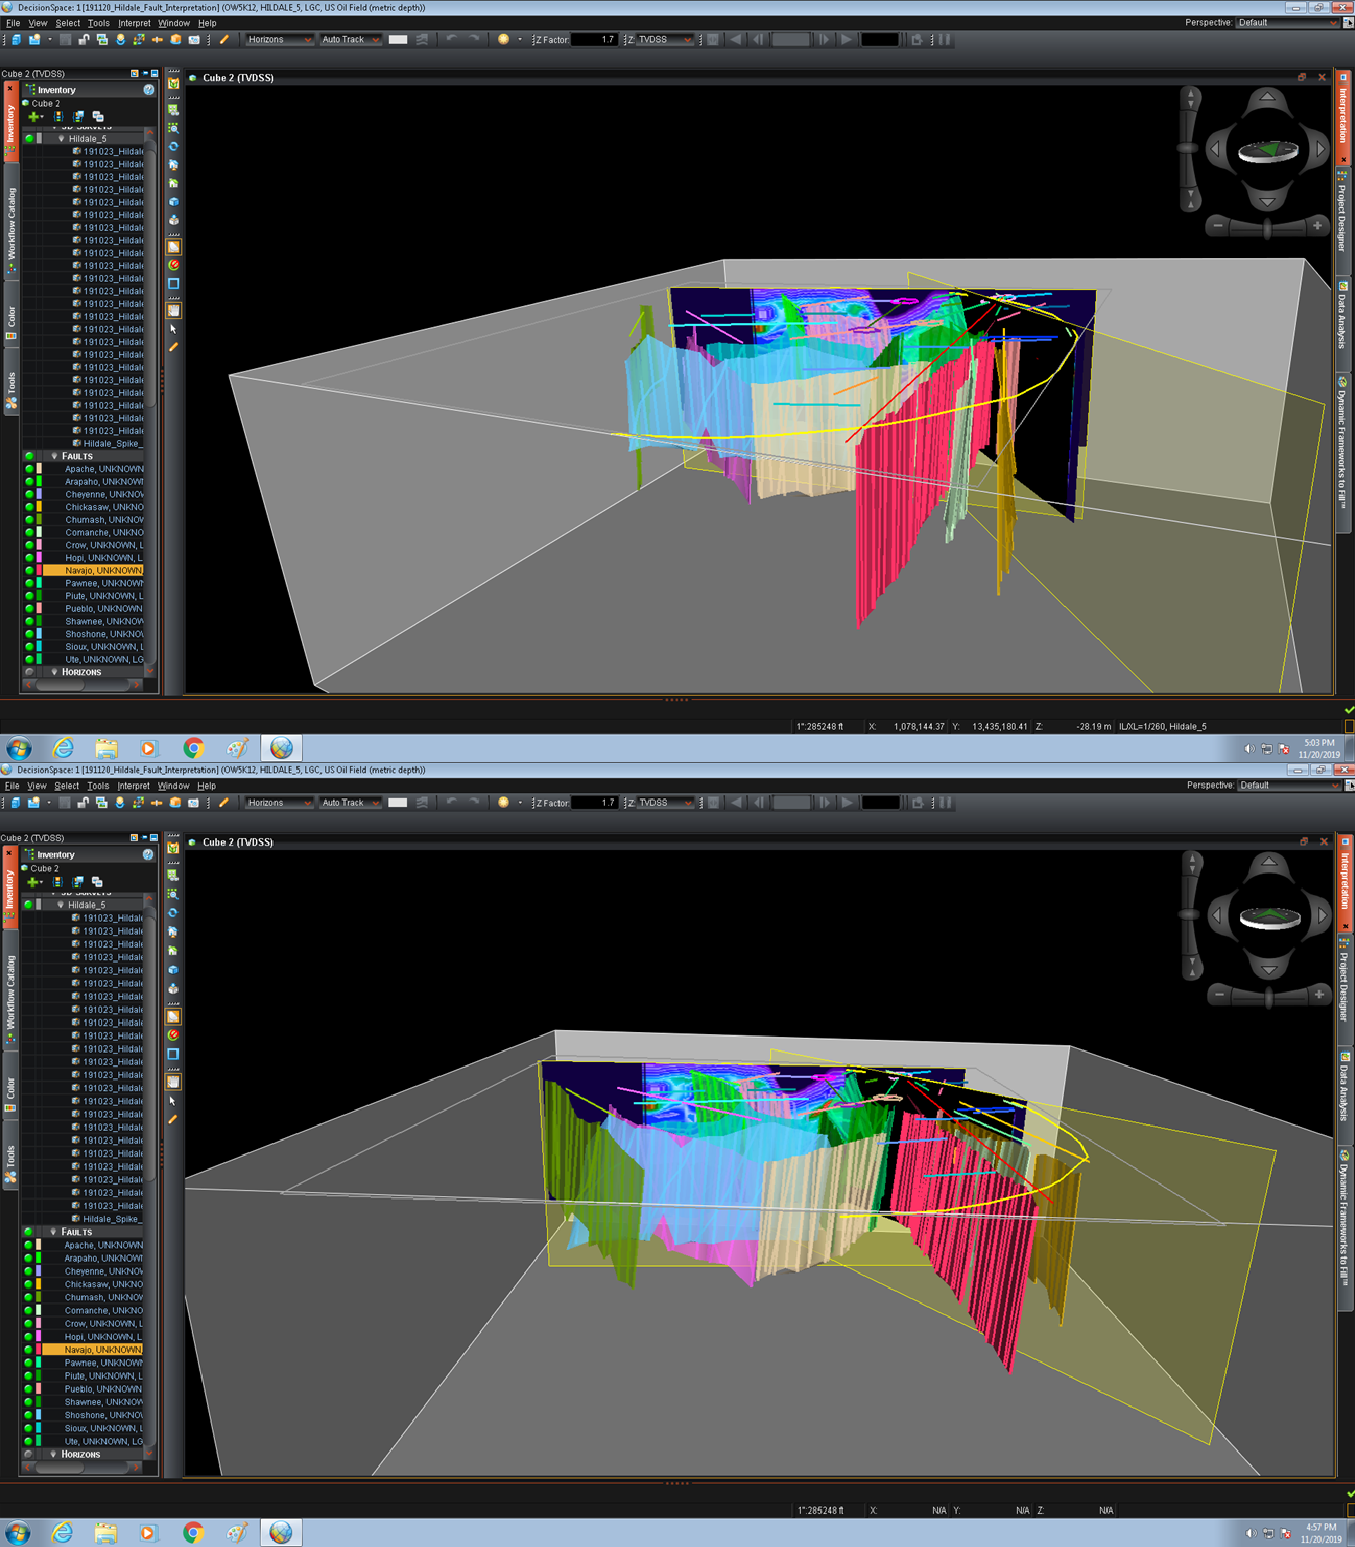
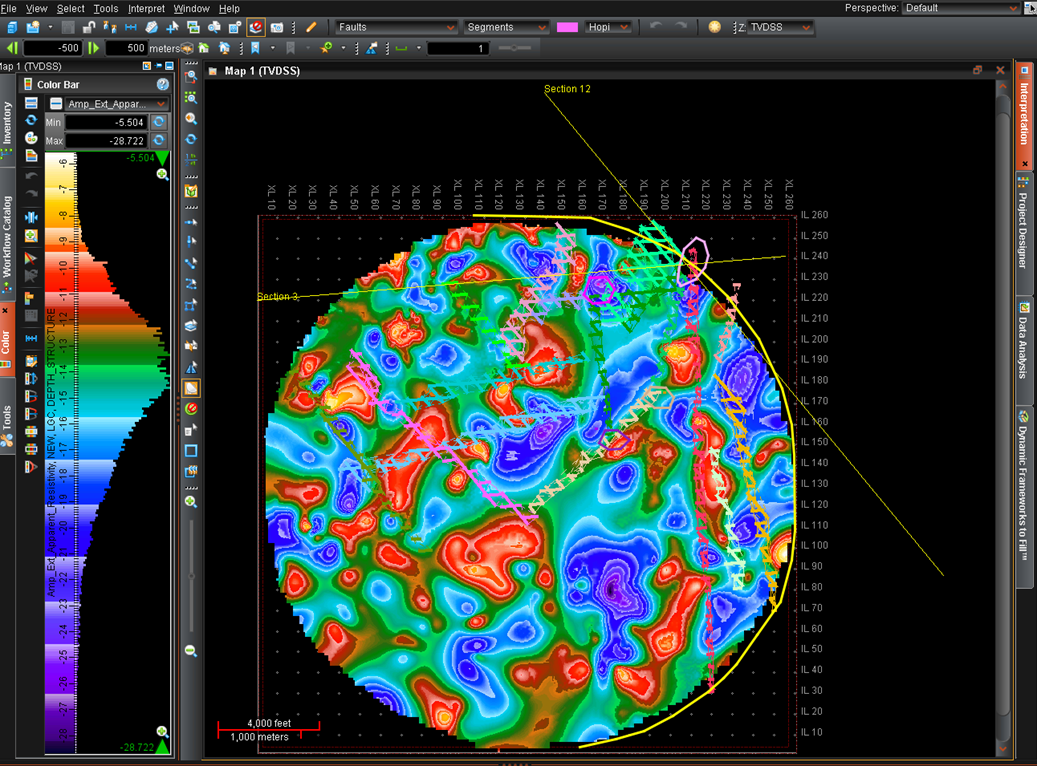
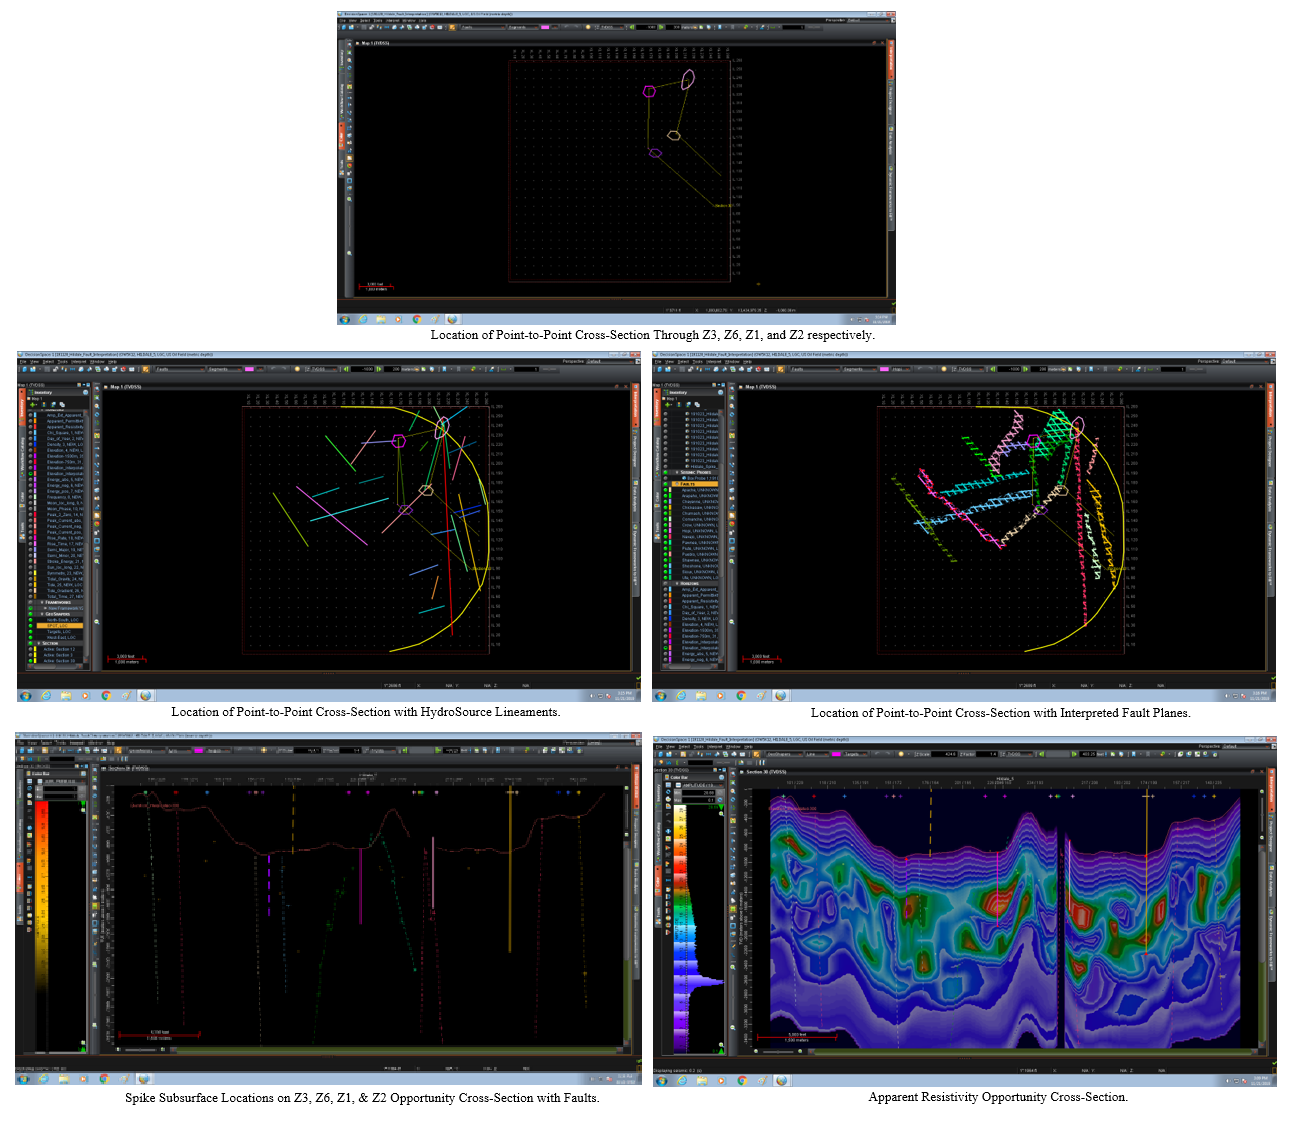
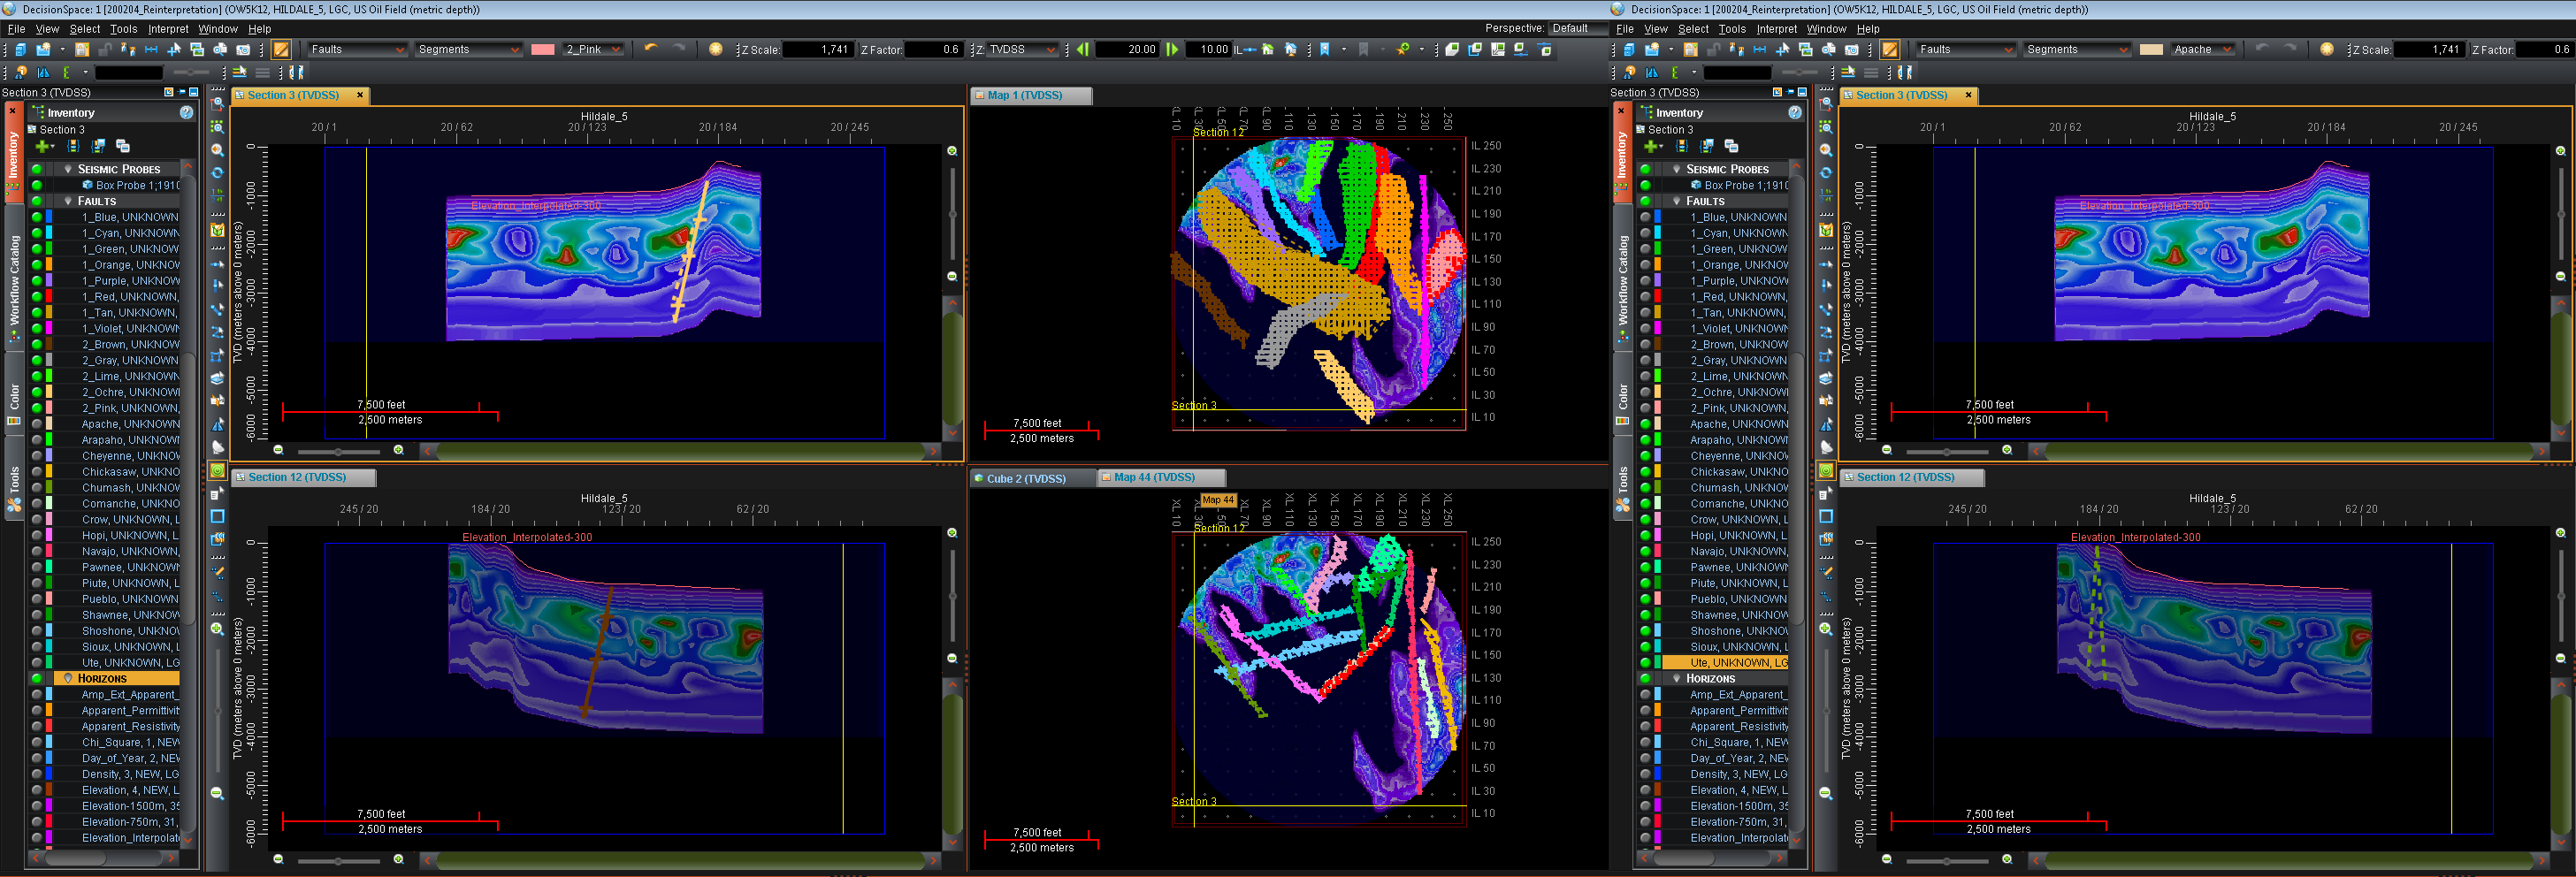
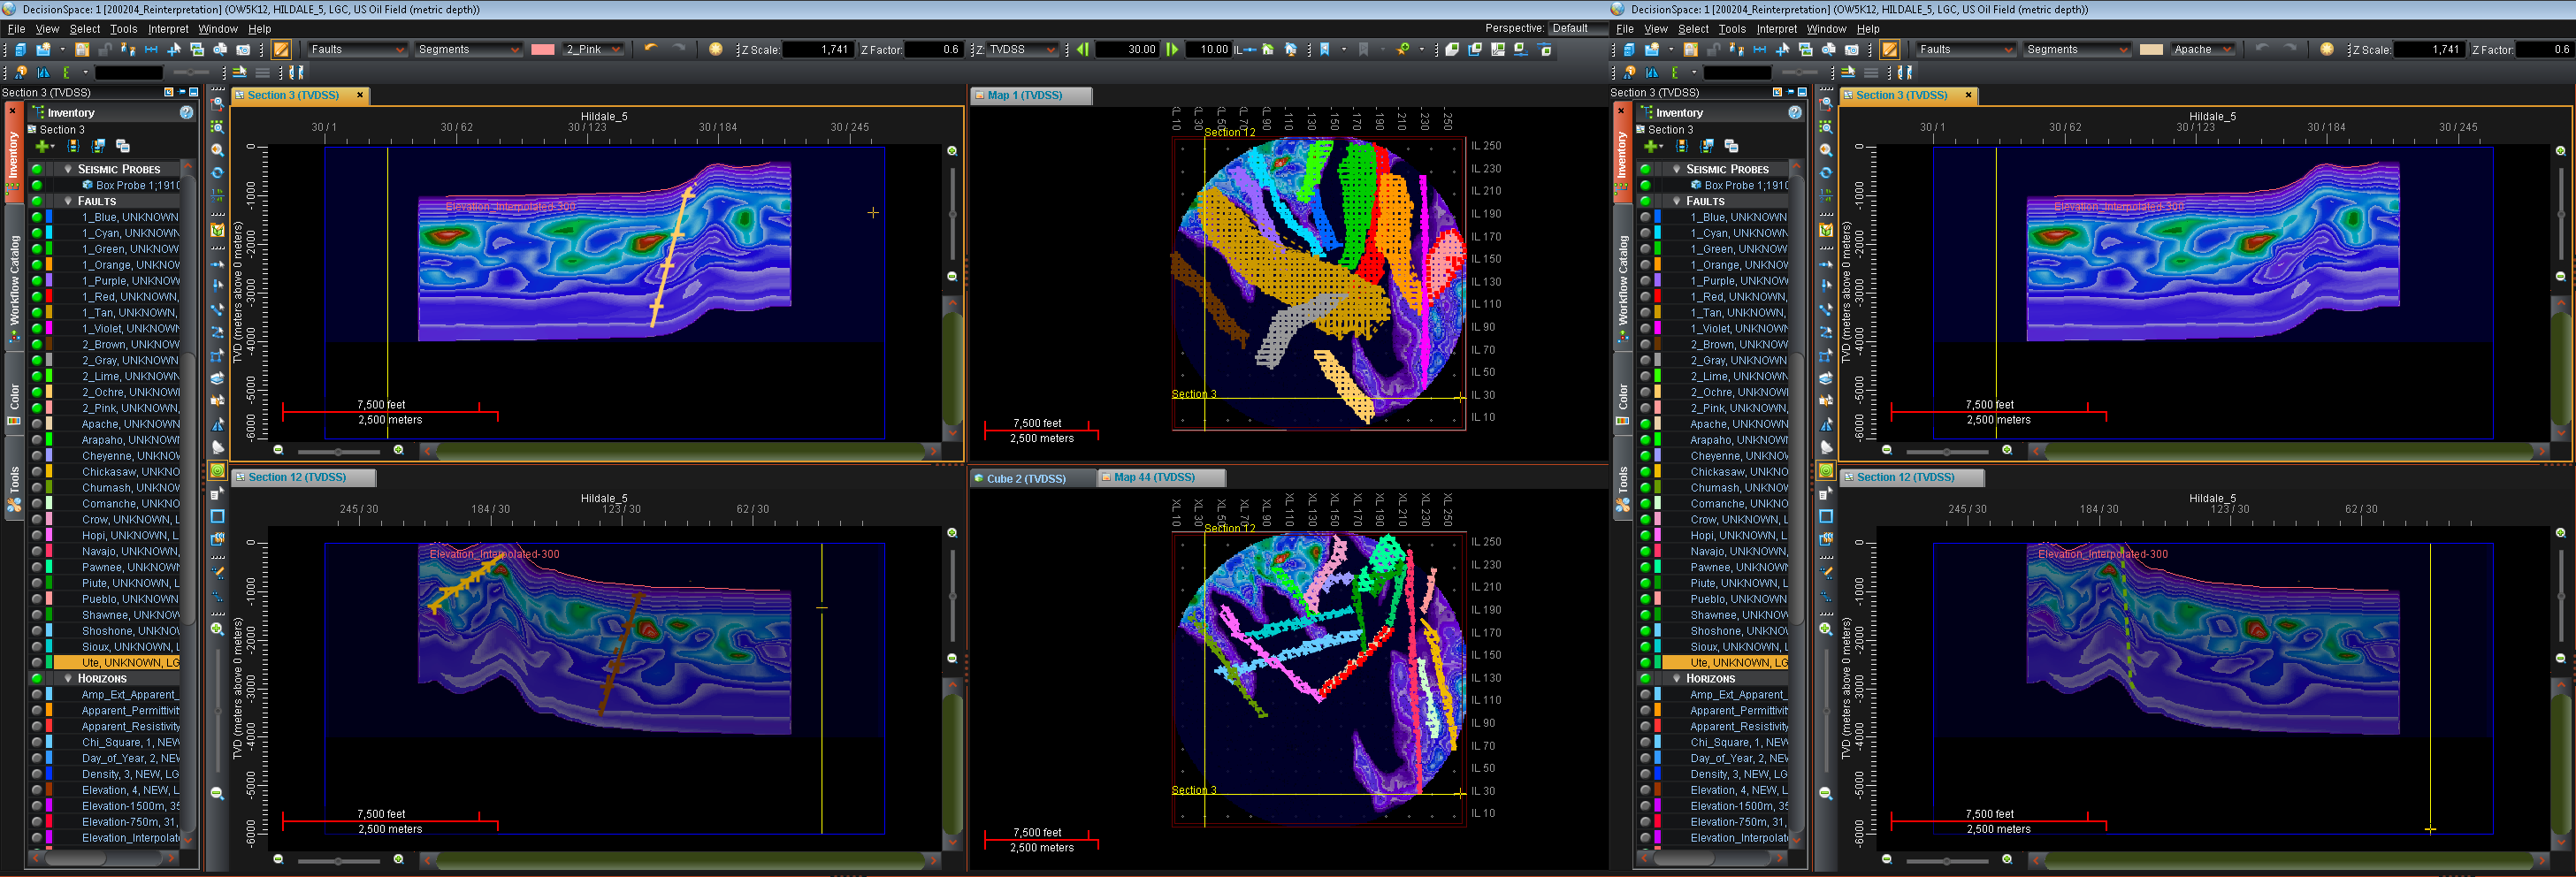
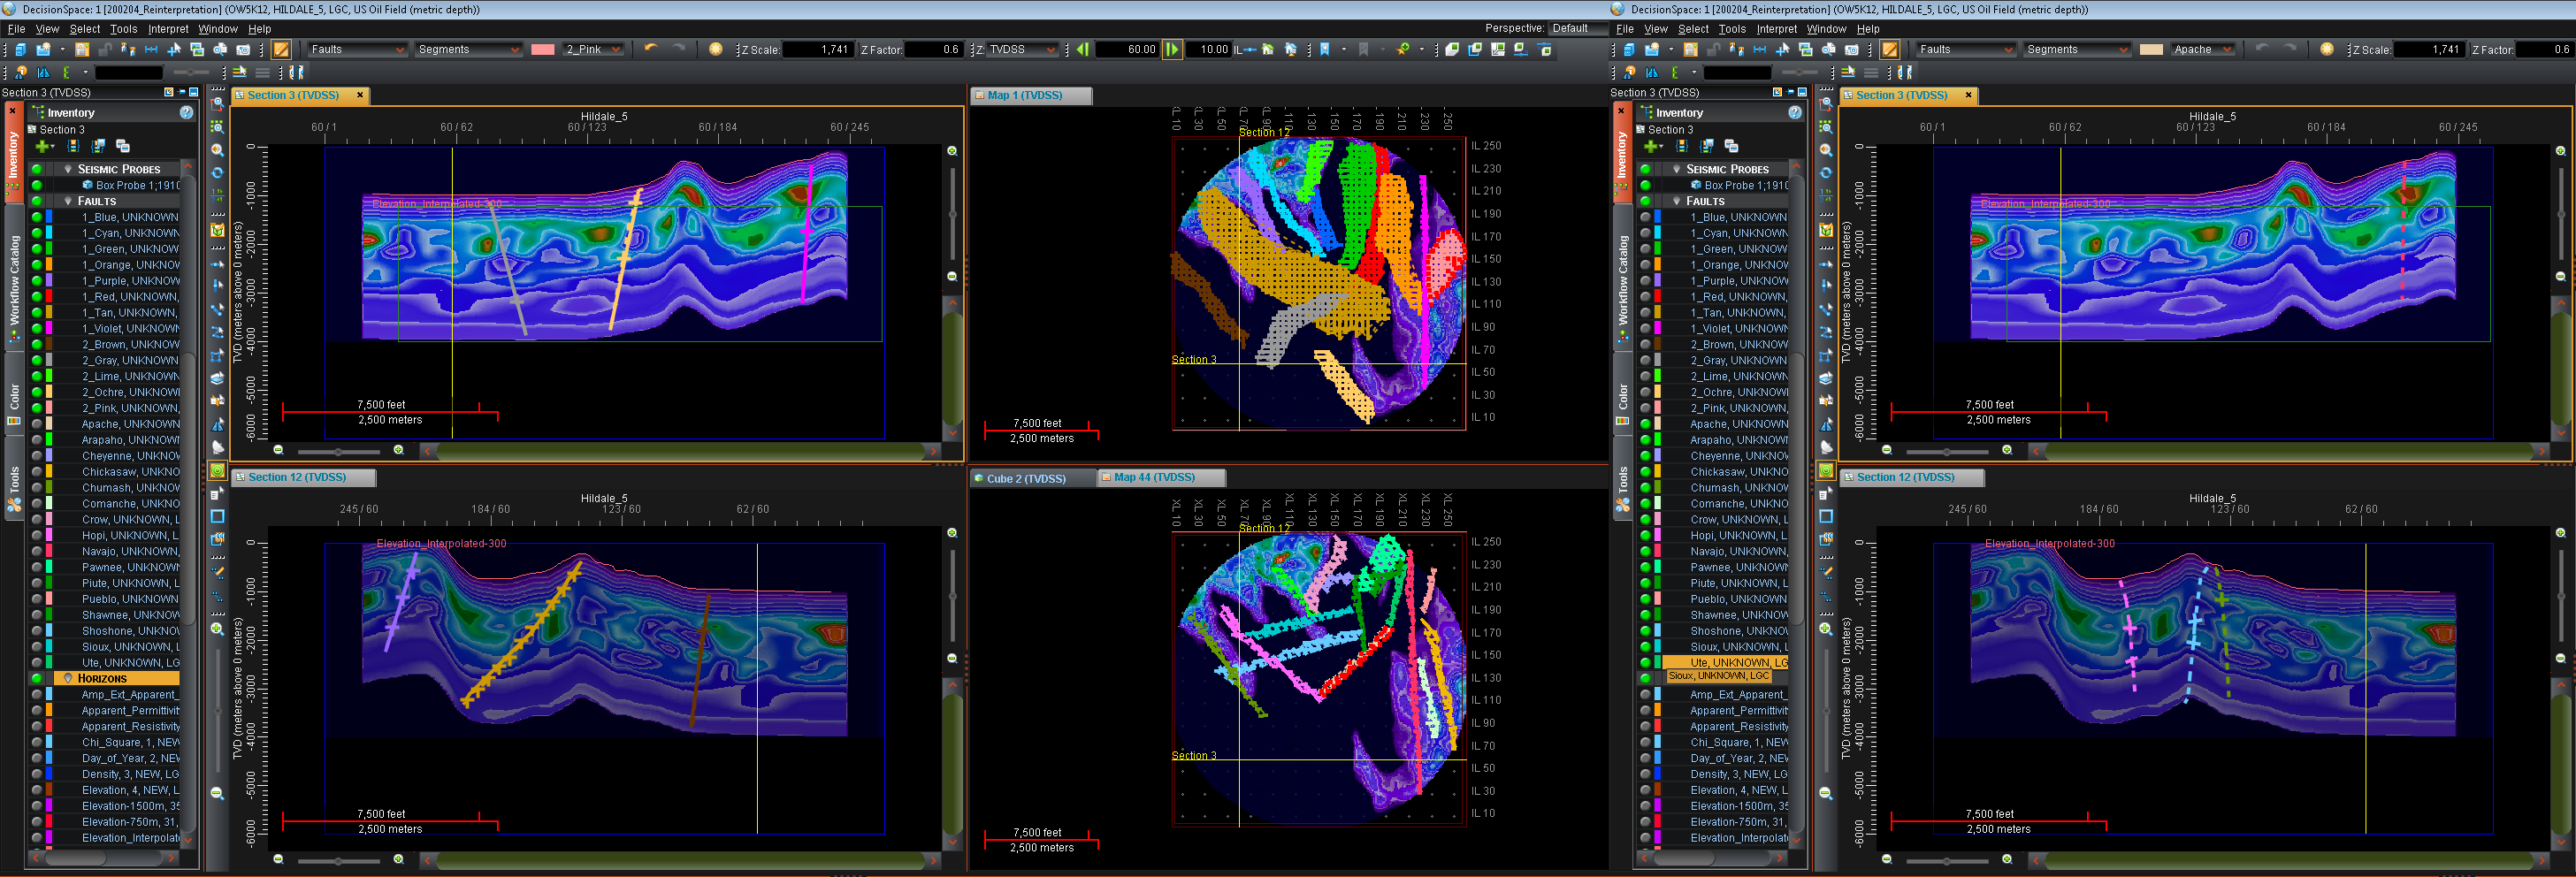
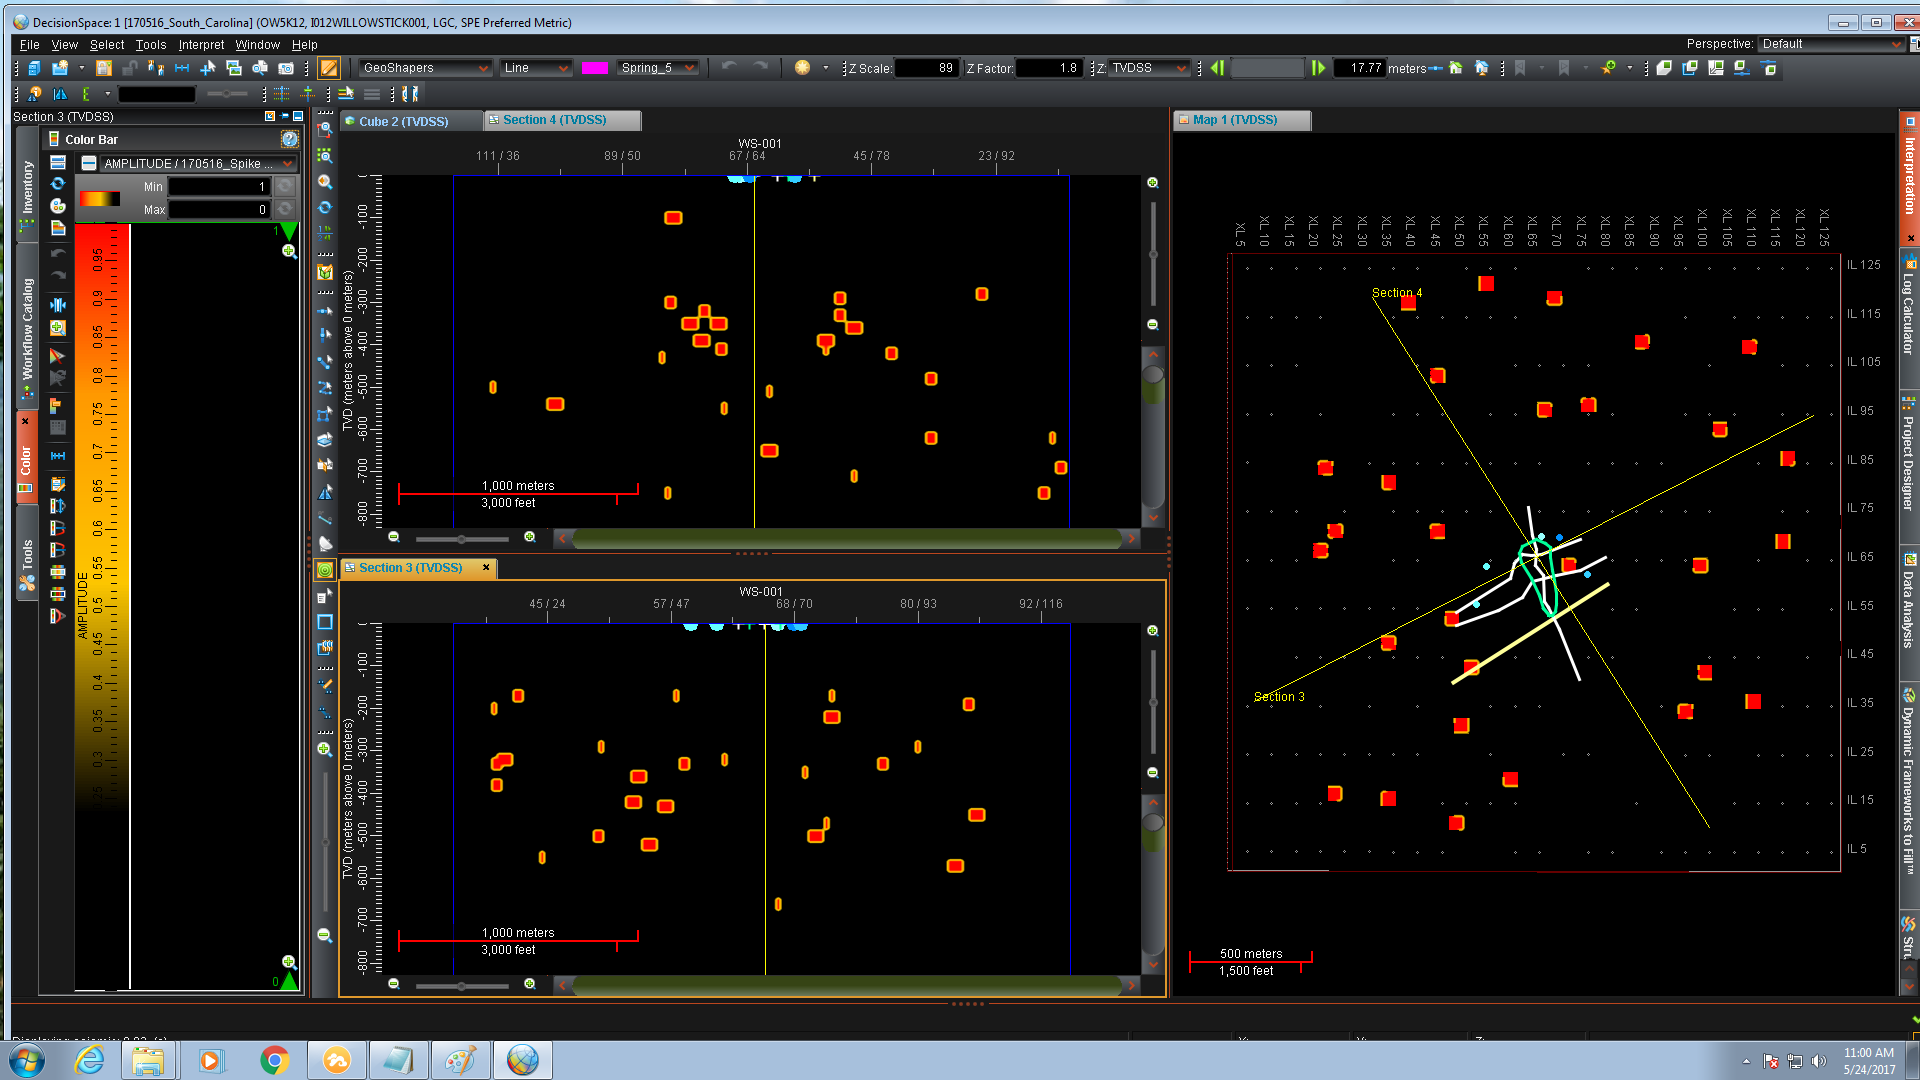
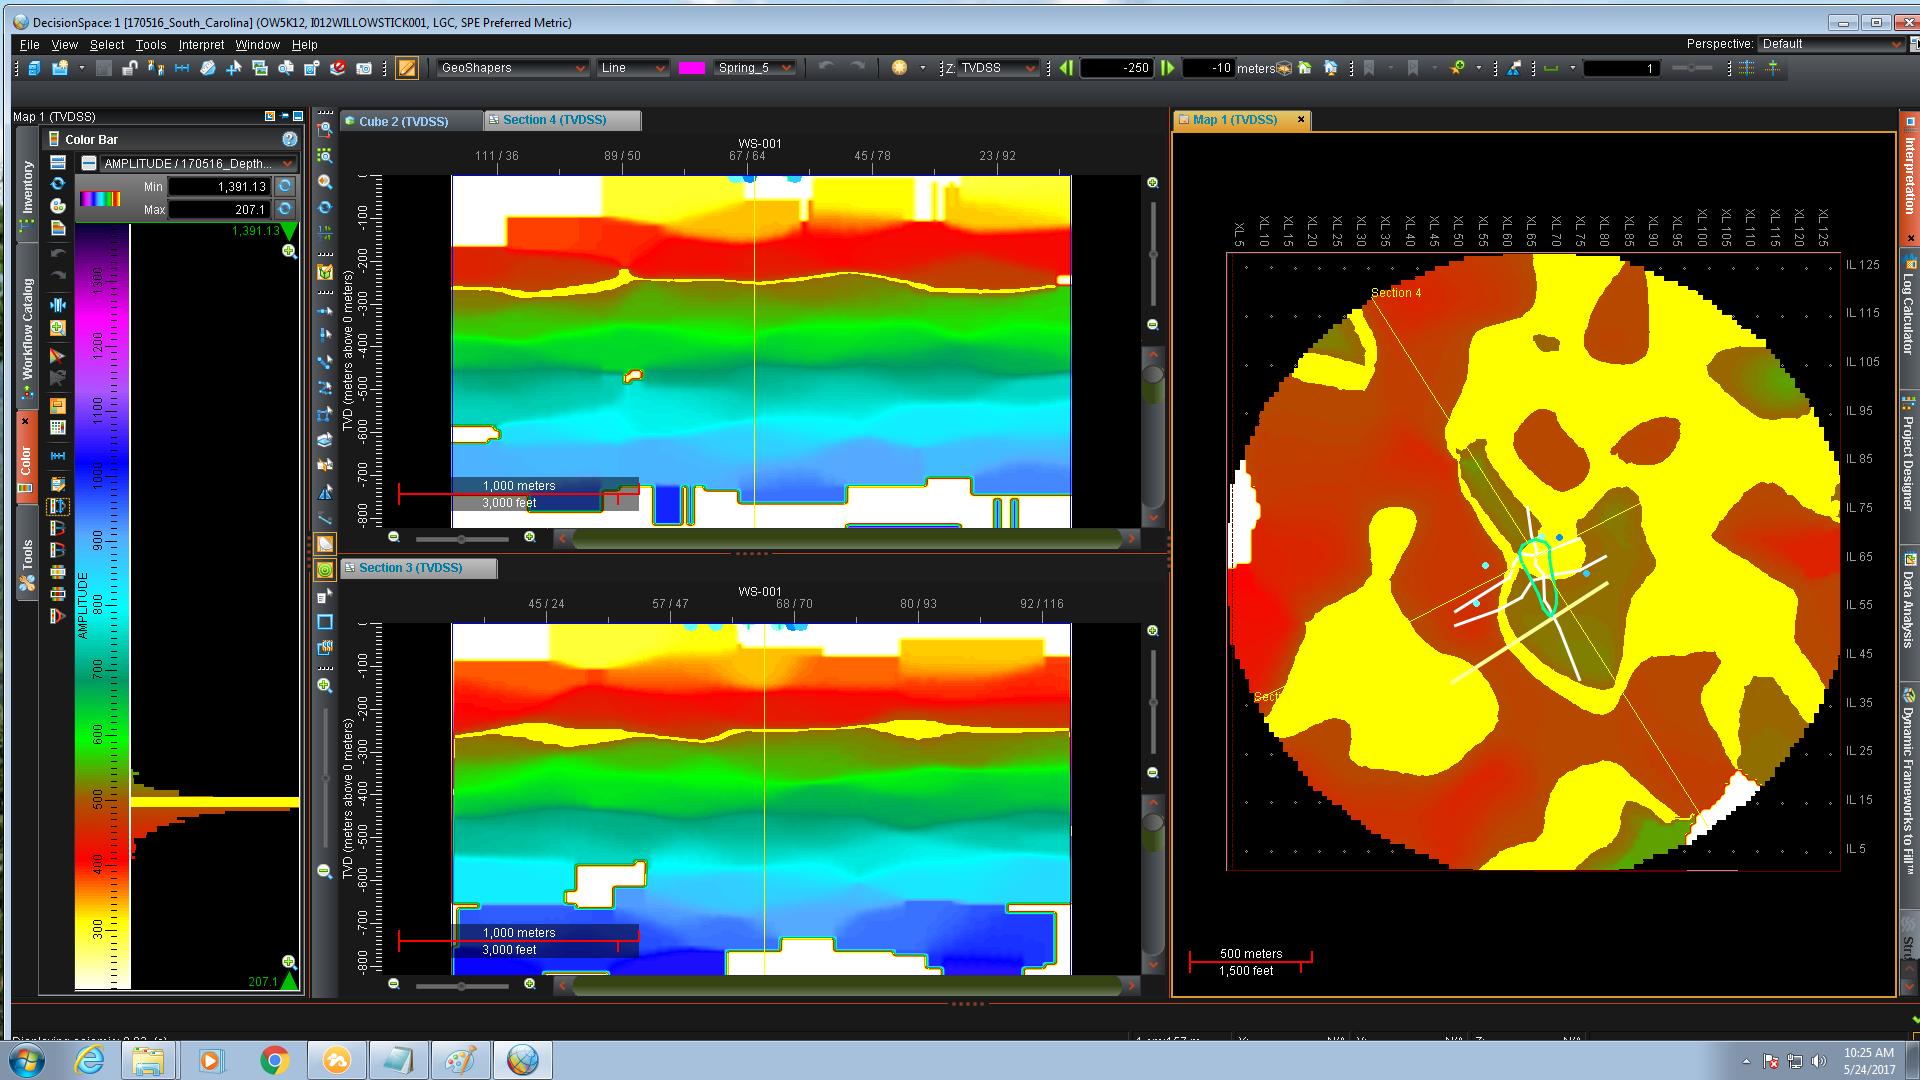
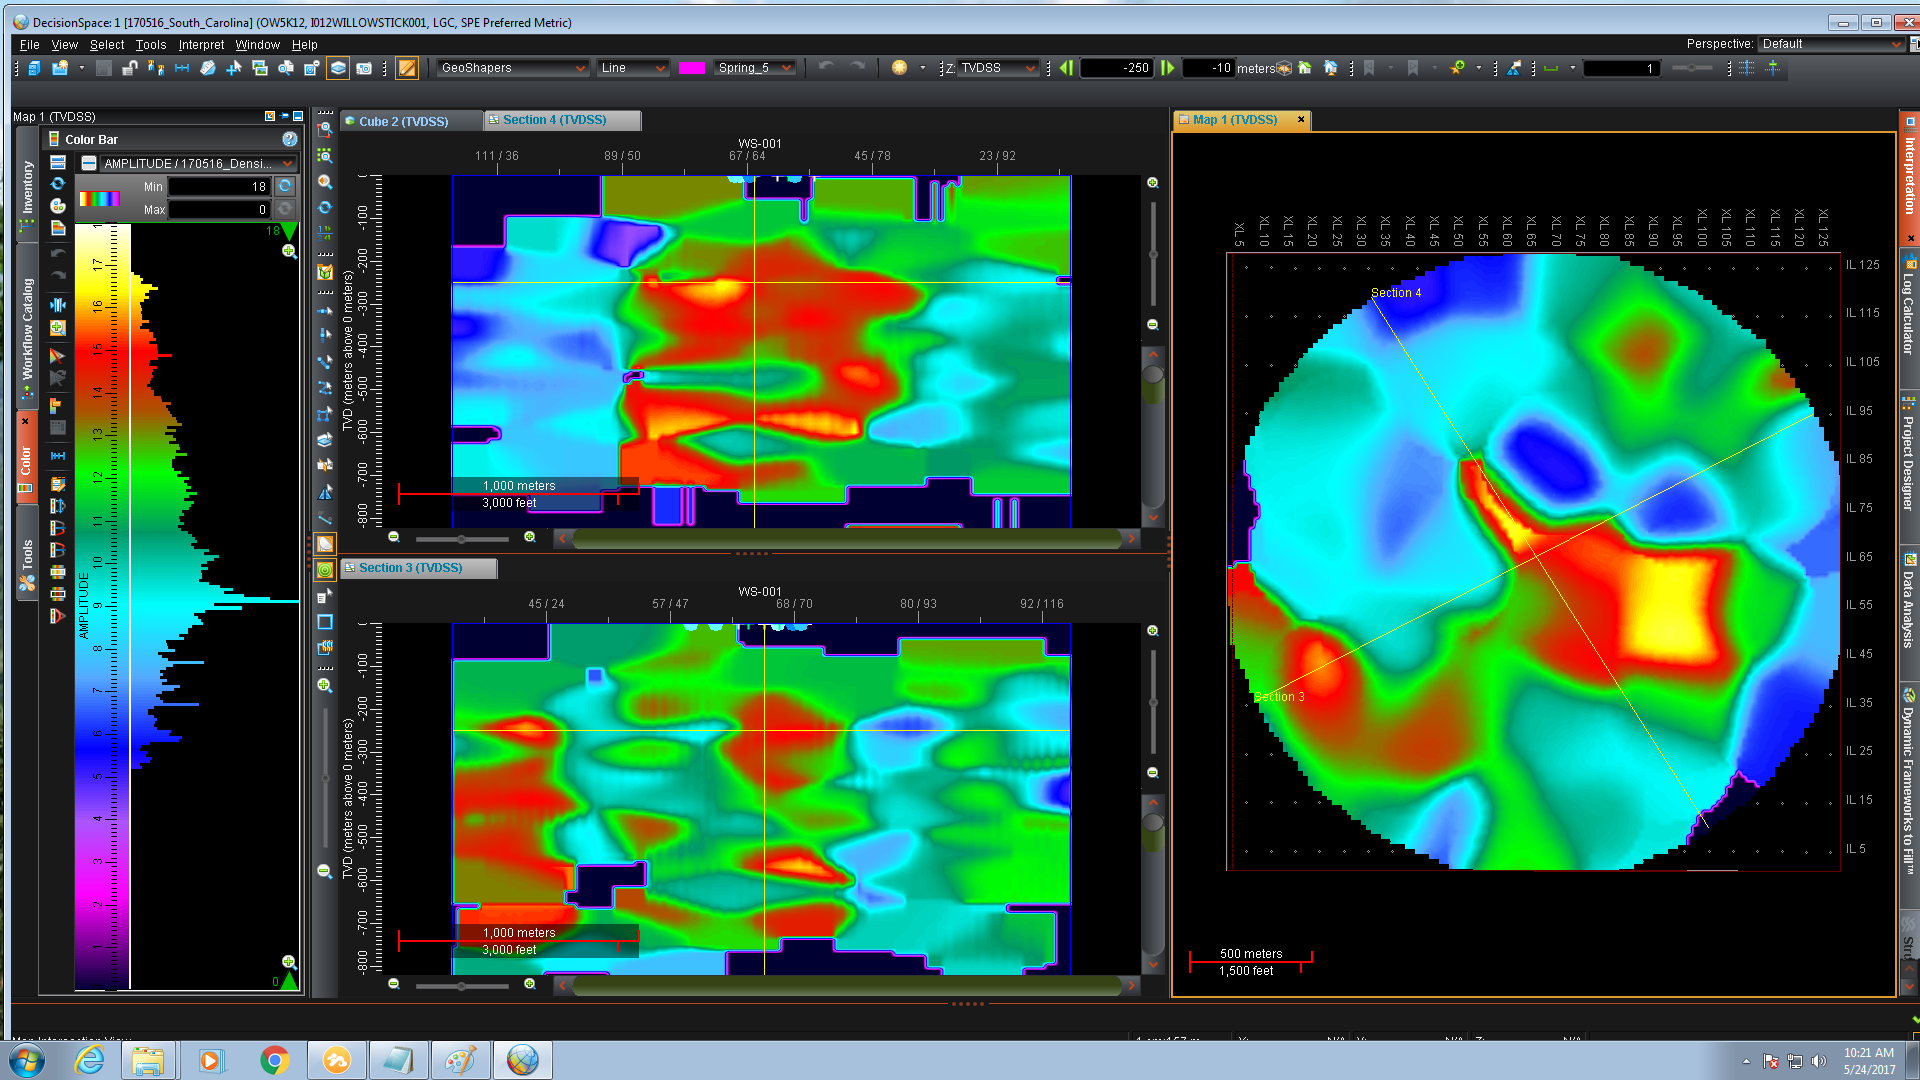
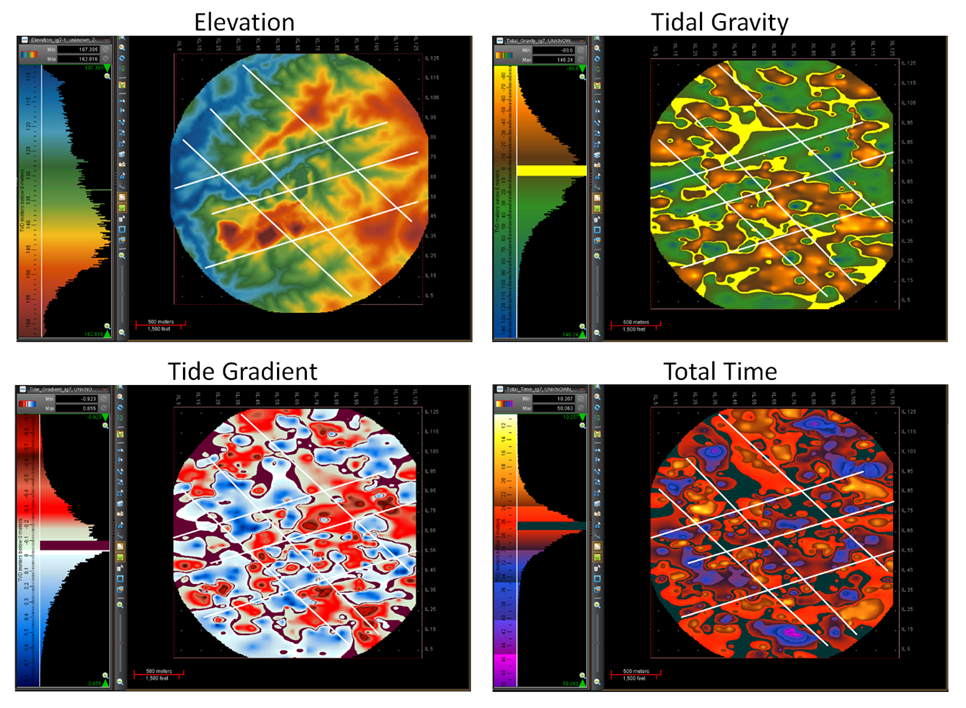
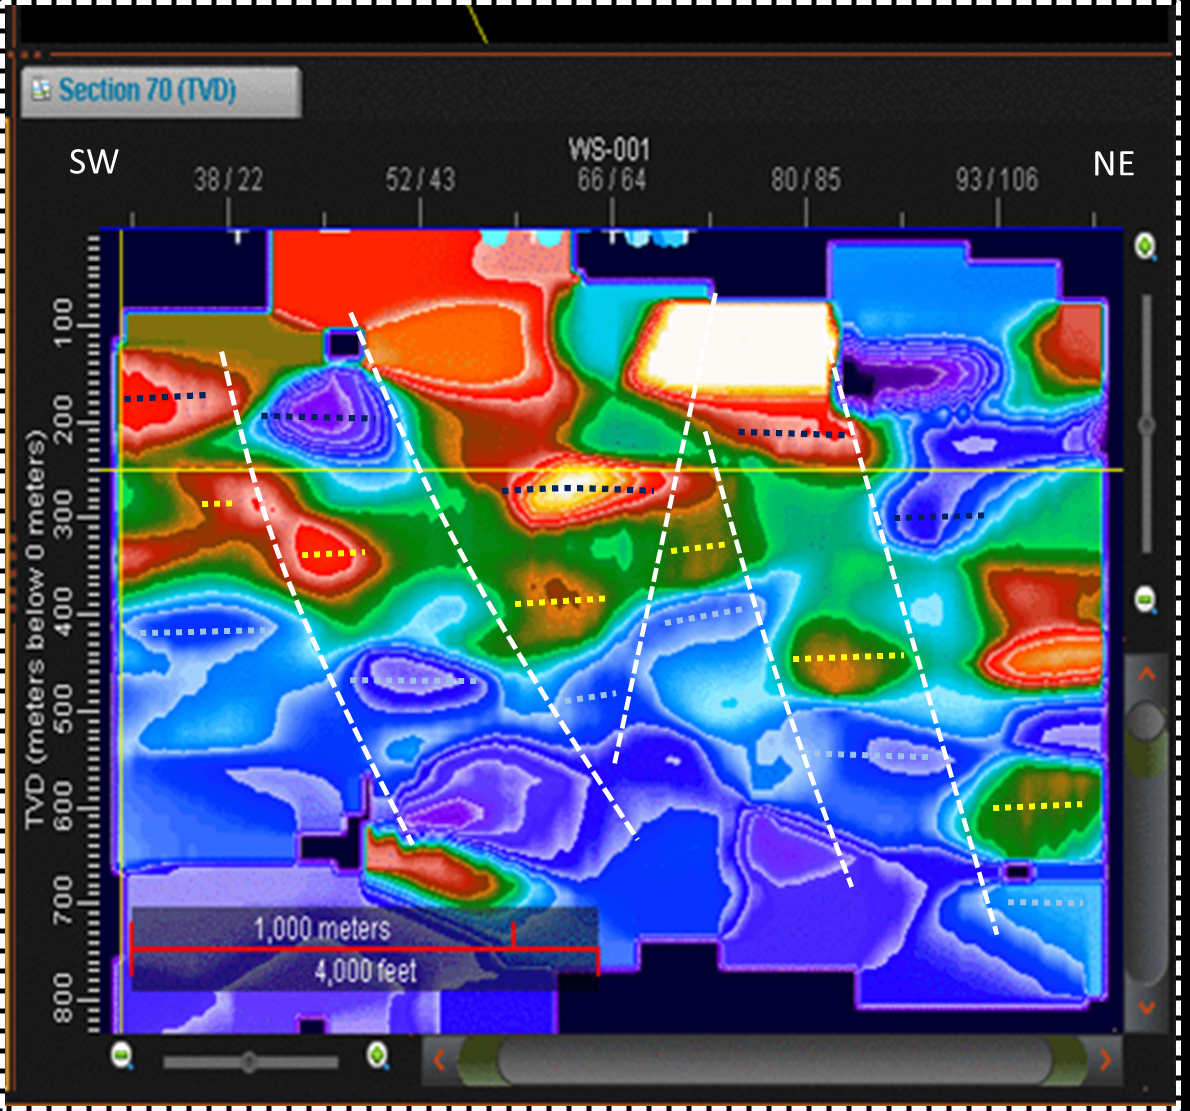
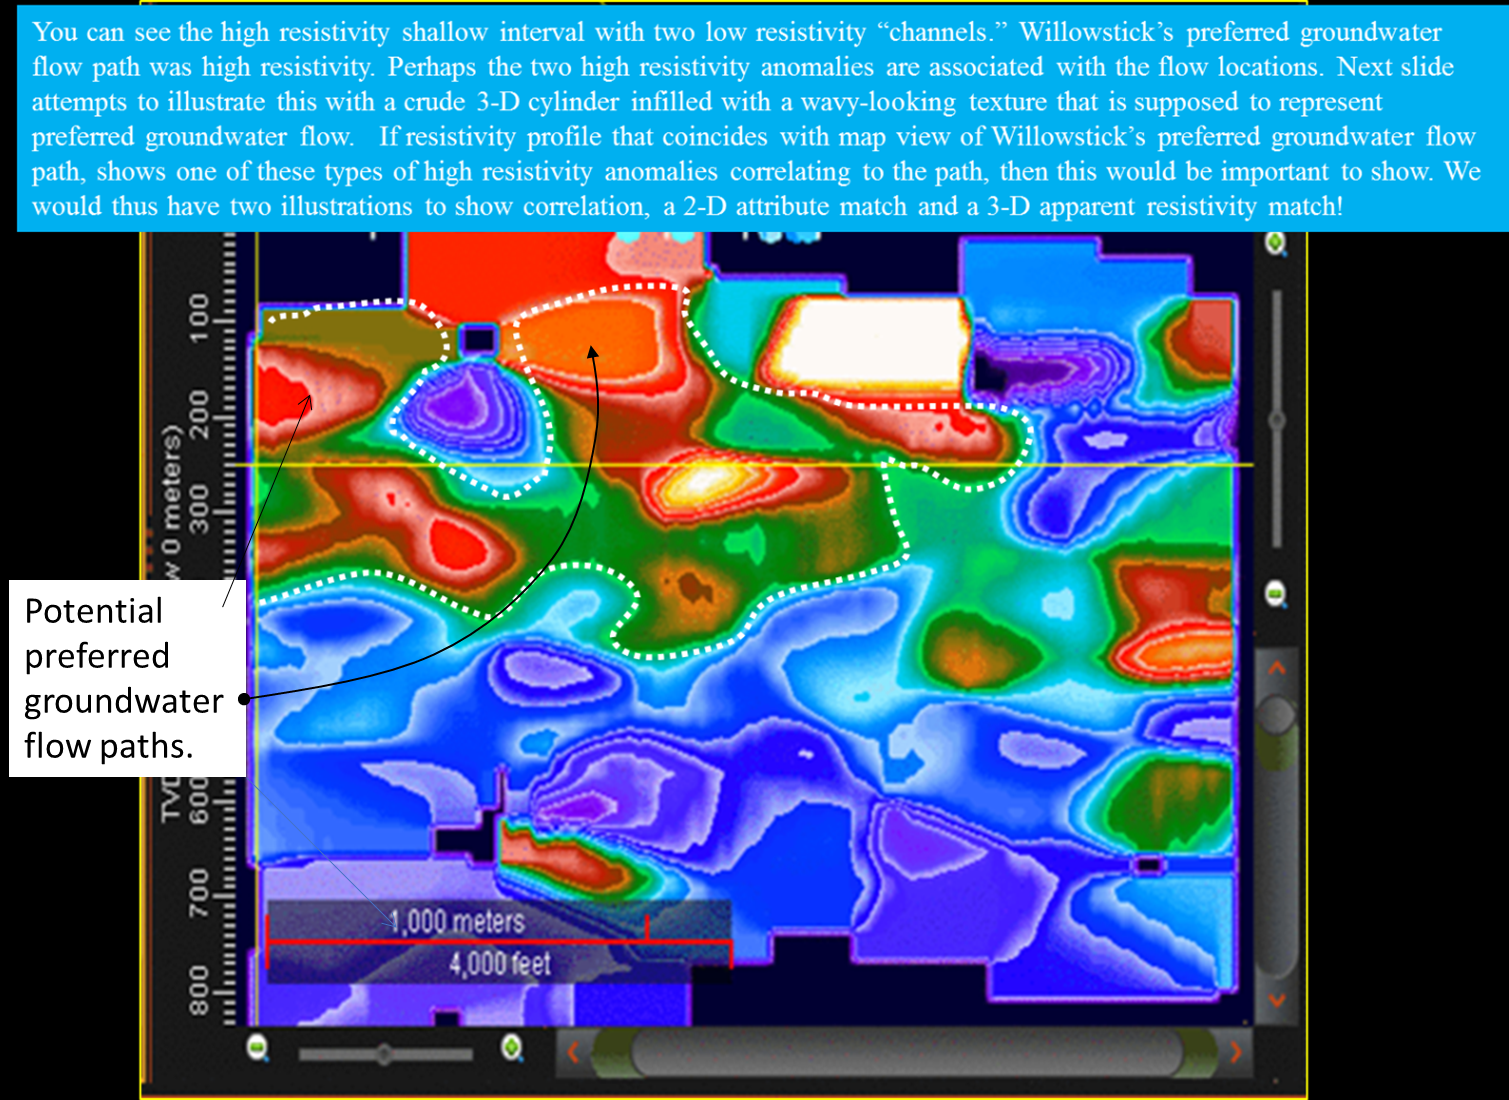
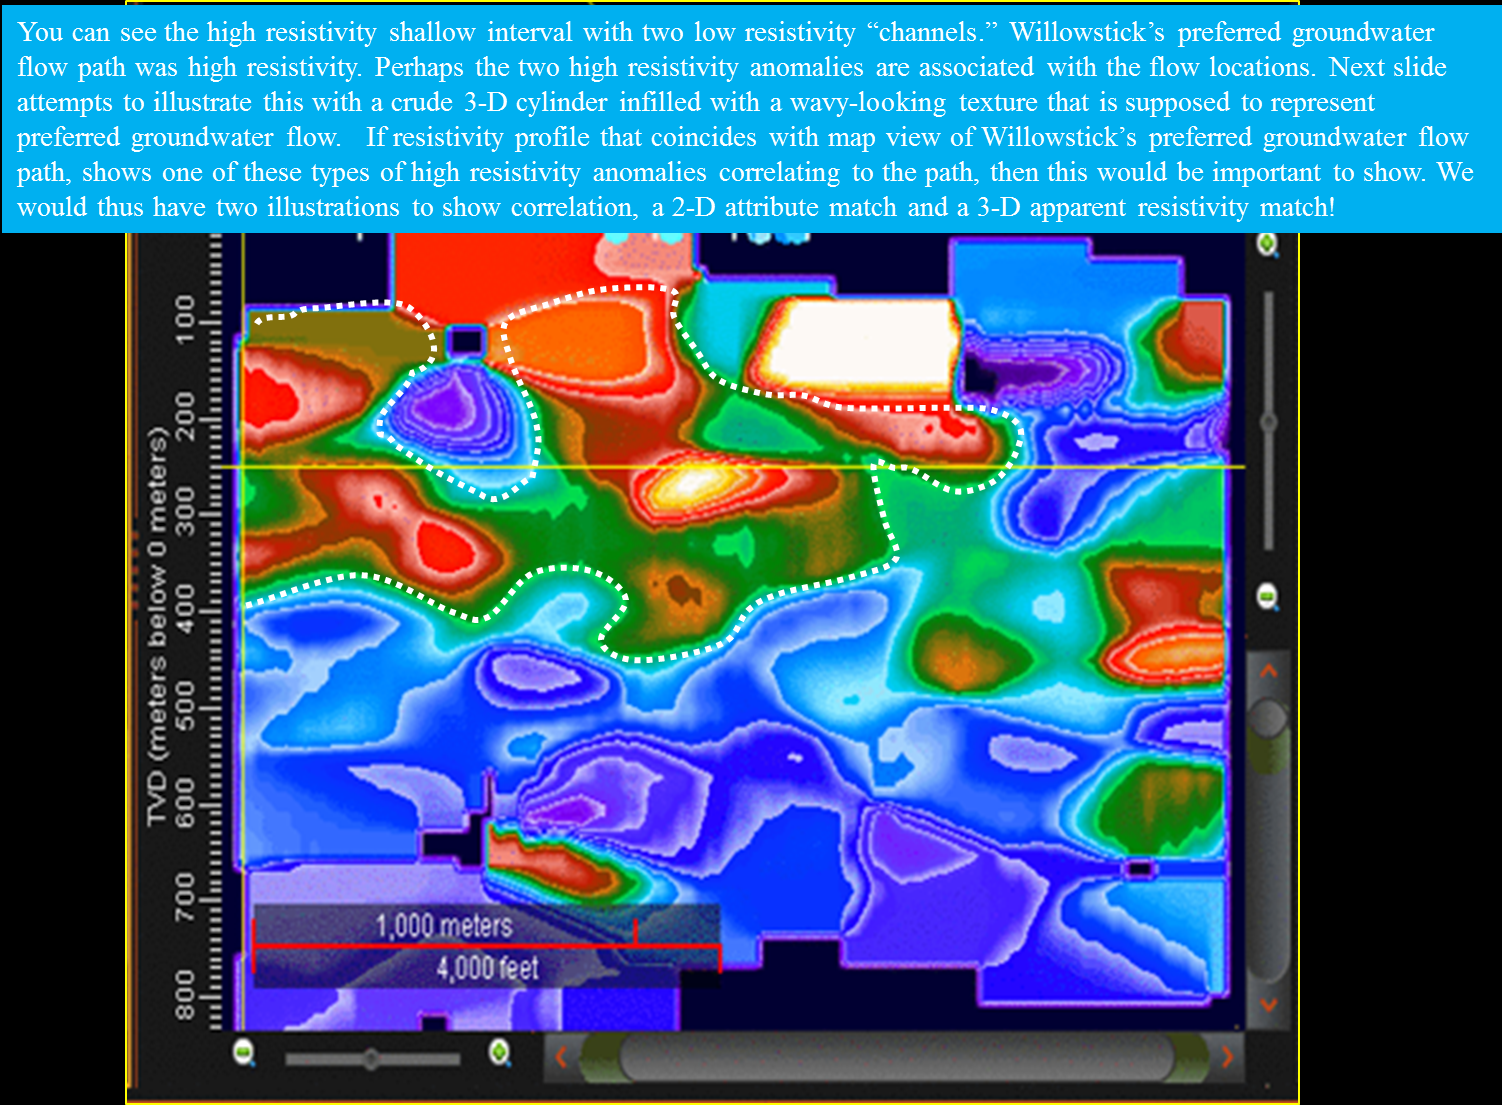
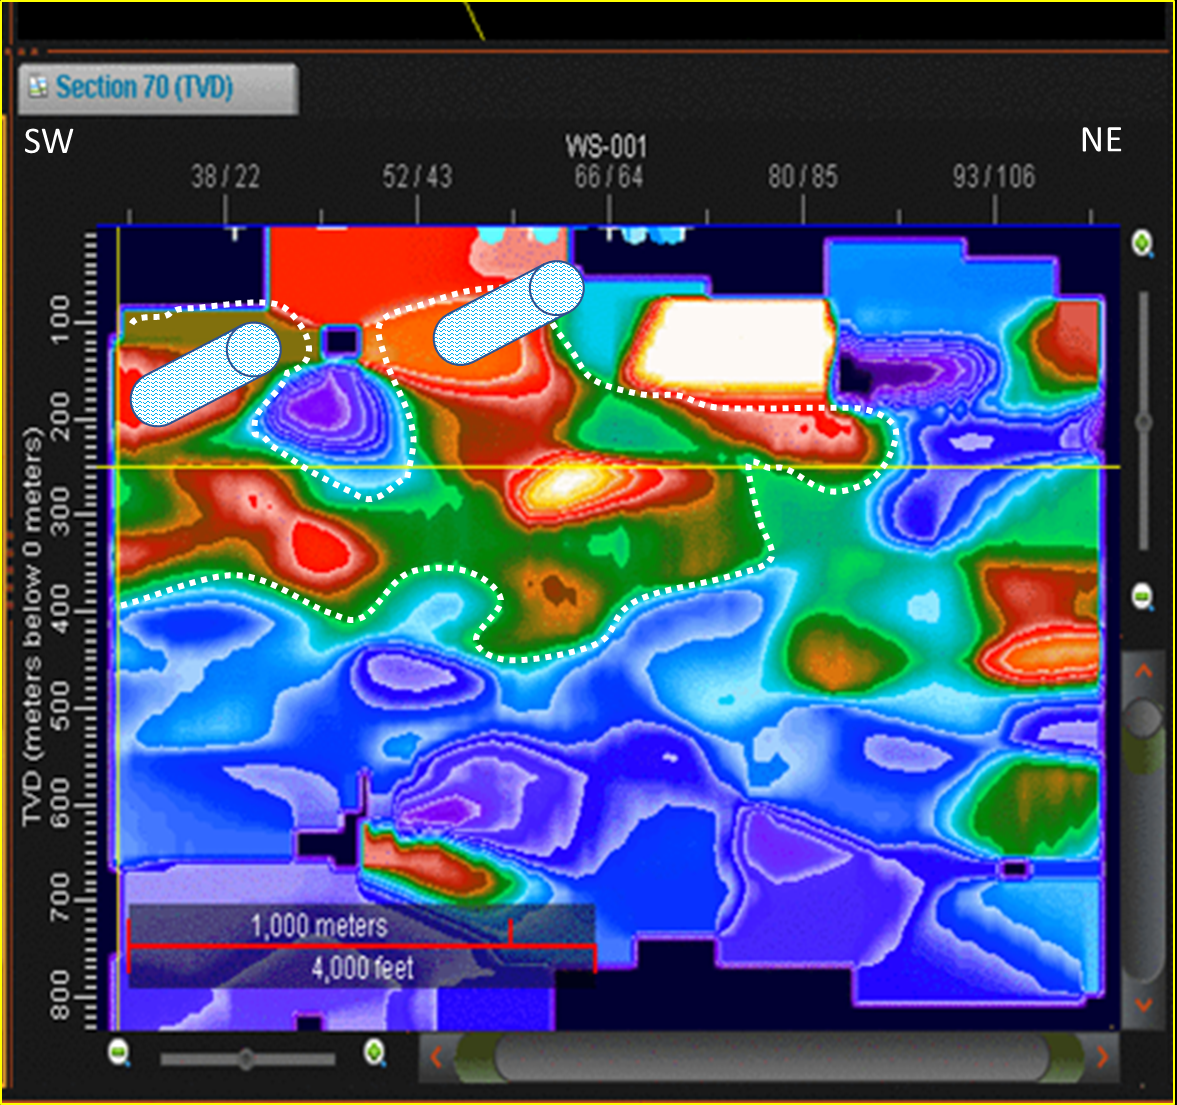
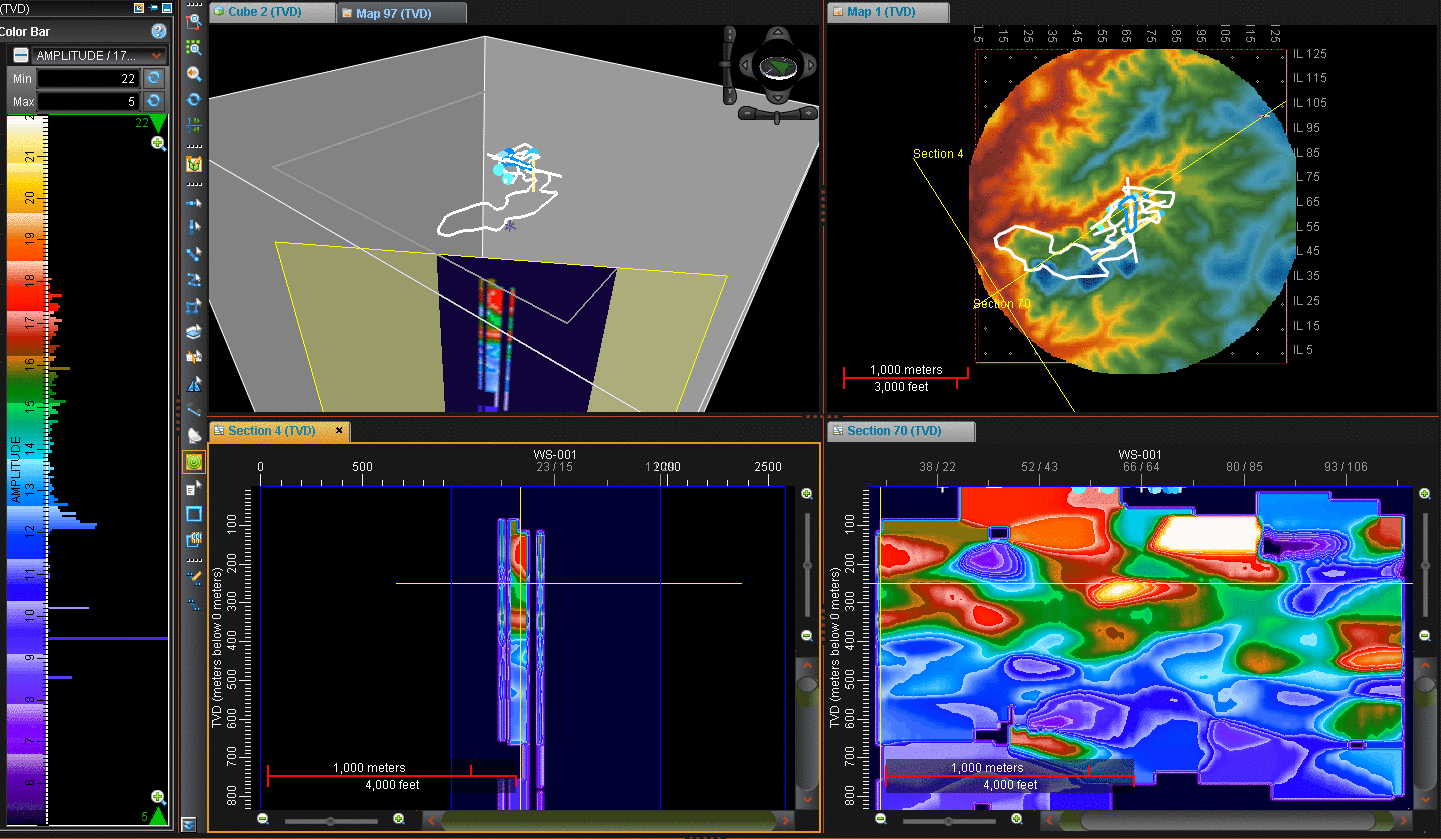
T Grav, Tide, T Grad, RRT, TT, MP Maps | Passive Seismic Profile Locations |
Resistivity Cross-Sections along Passive Profiles | High Resistivity (possibly water) Anomaly |
SPOTsm Resistivity Movie -/+ Faults | HyroSource Lineaments in DecisionSpacetm |
Data Resistivity Cross-Sections NE Corner | Interpretation Cross-Sections NE Corner |
Data Resistivity Cross-Sections Center | Interpretation Cross-Sections Center |
![](Hildale_21_Interpretation_Resistivity_Center2_Spot.png) | ![](Hildale_22_Resistivity_Center2_Spot.png) |
![](Hildale_23_Fault_Interpretation_2-Rotations.png) | ![](Hildale_24_Fault_Interpretation_Rotation-Animation_Cover.png) |
![](Hildale_25_Resistivity_Amplitude_Extraction_with_Faults.png) | ![](Hildale_26_Resistivity_Horizontal-Slices.png) |
![](Hildale_27_Resistivity_Probes_Through_HydroSource_Anomalies.png) | ![](Hildale_28_Location-through-Proposed-Wells_Spike_&_Resistivity_Cross-Sections.png) |
![](Hildale_29_Permittivity_Resistivity_Day-of_Year_Absolute-Energy_Cross-Sections.png) | ![](Hildale_30_Negative-Energy_Positive-Energy_Frequency_Moon-Local-Longitude_Cross-Sections.png) |
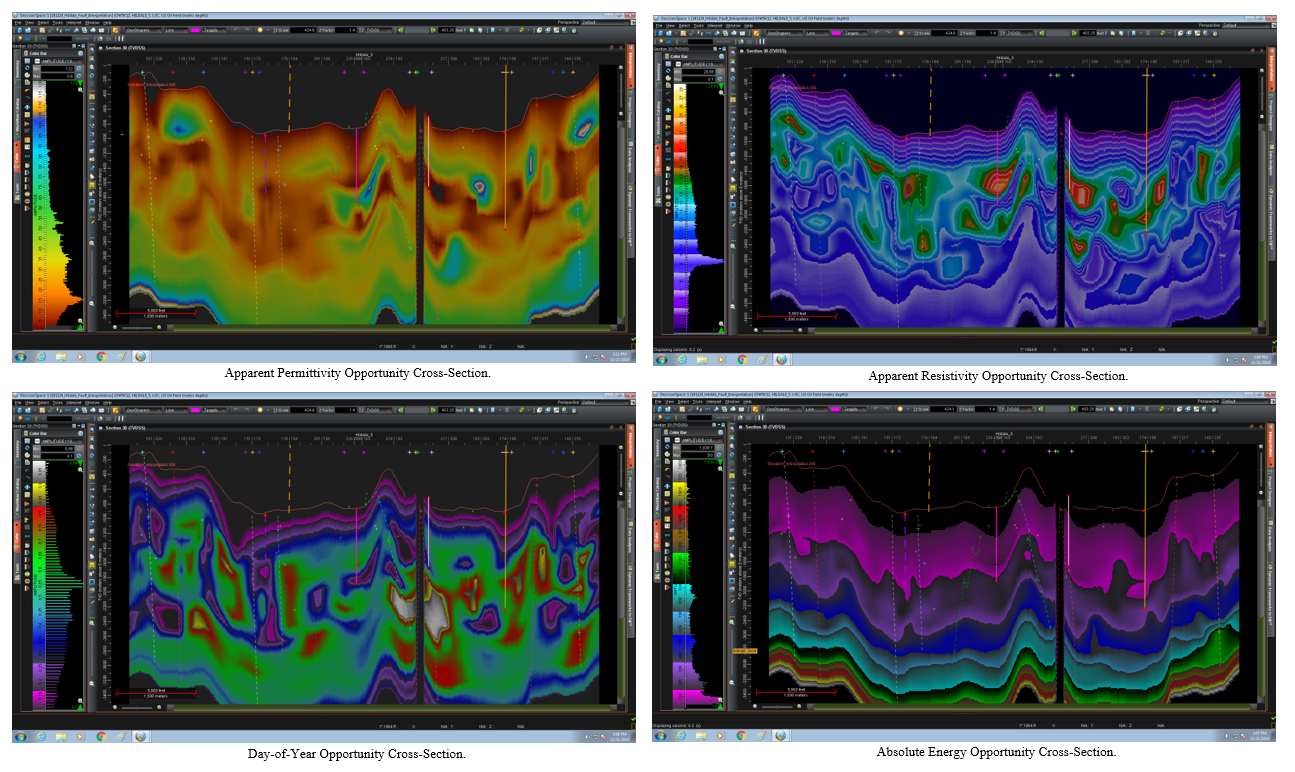
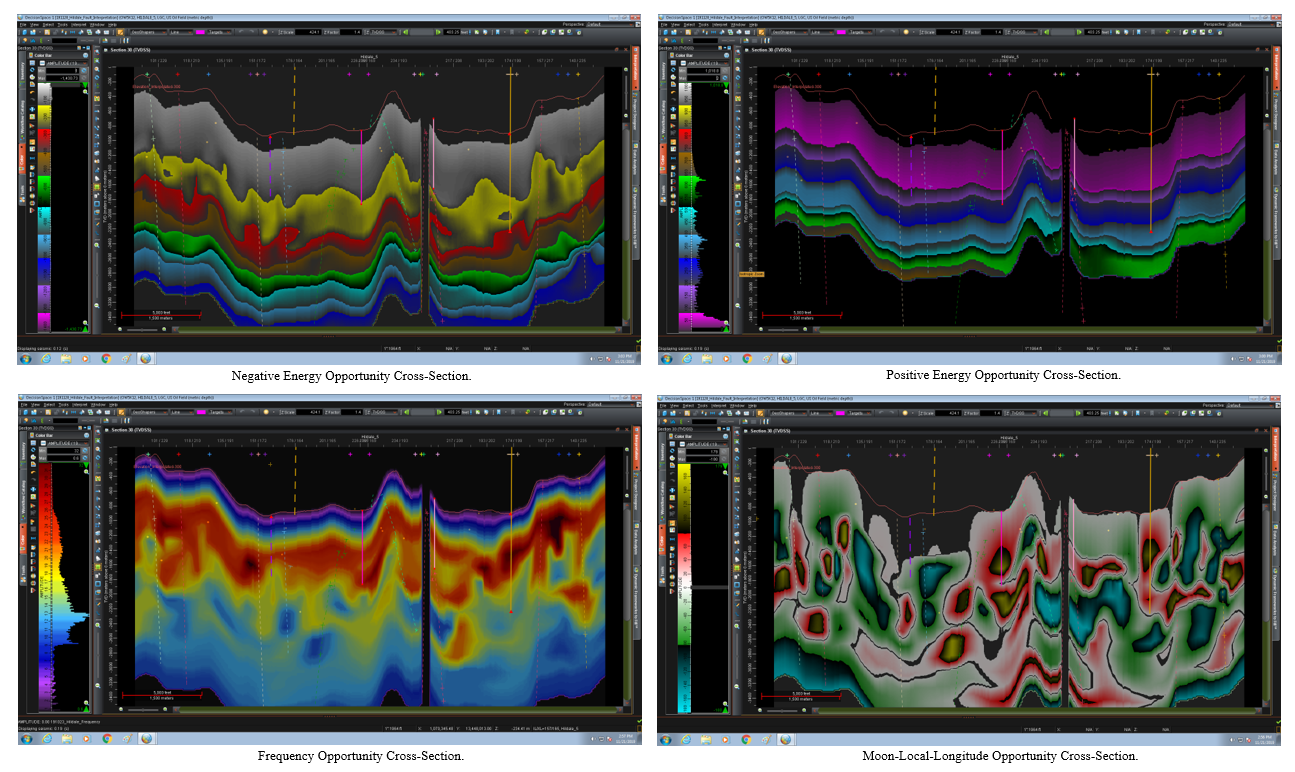
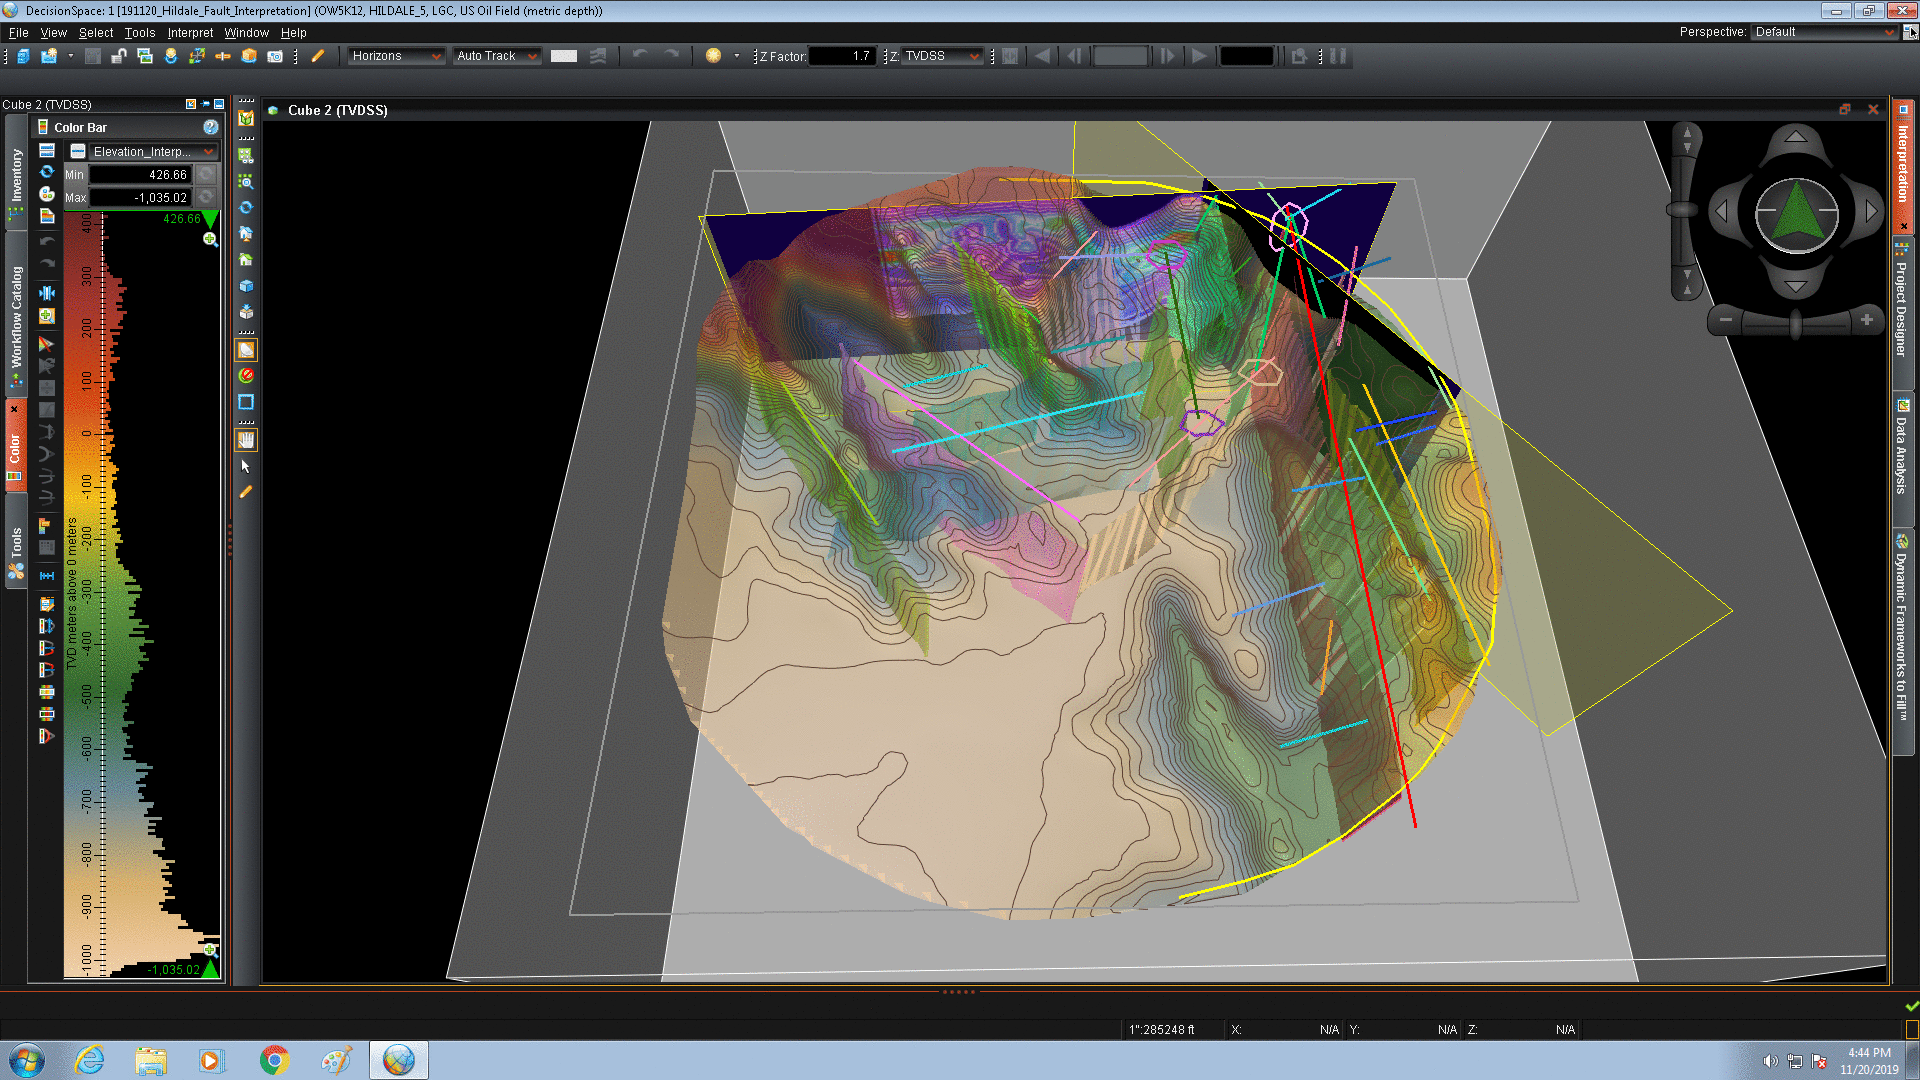
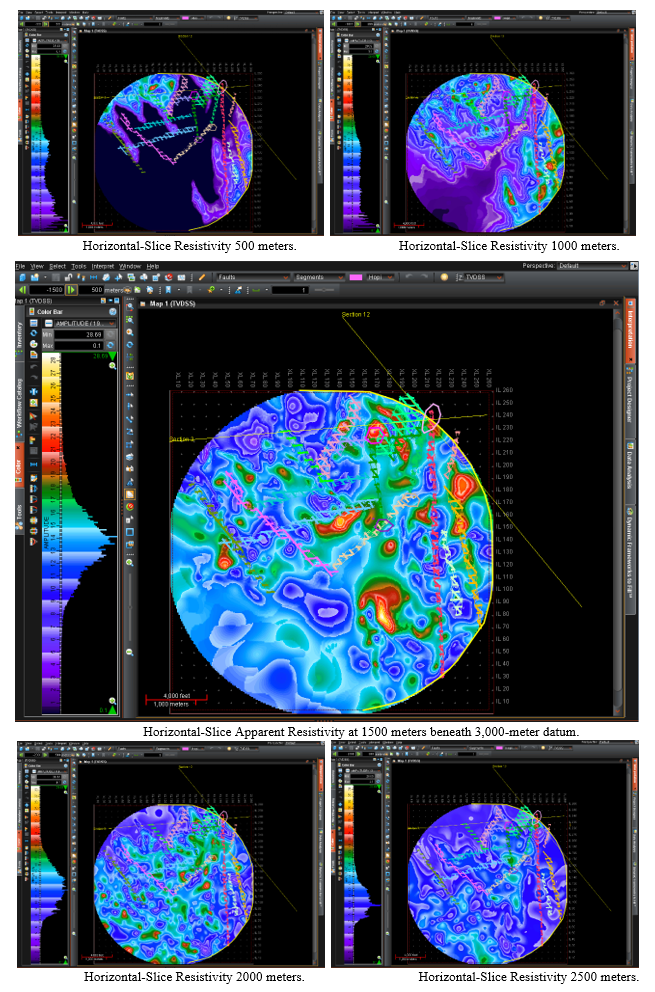
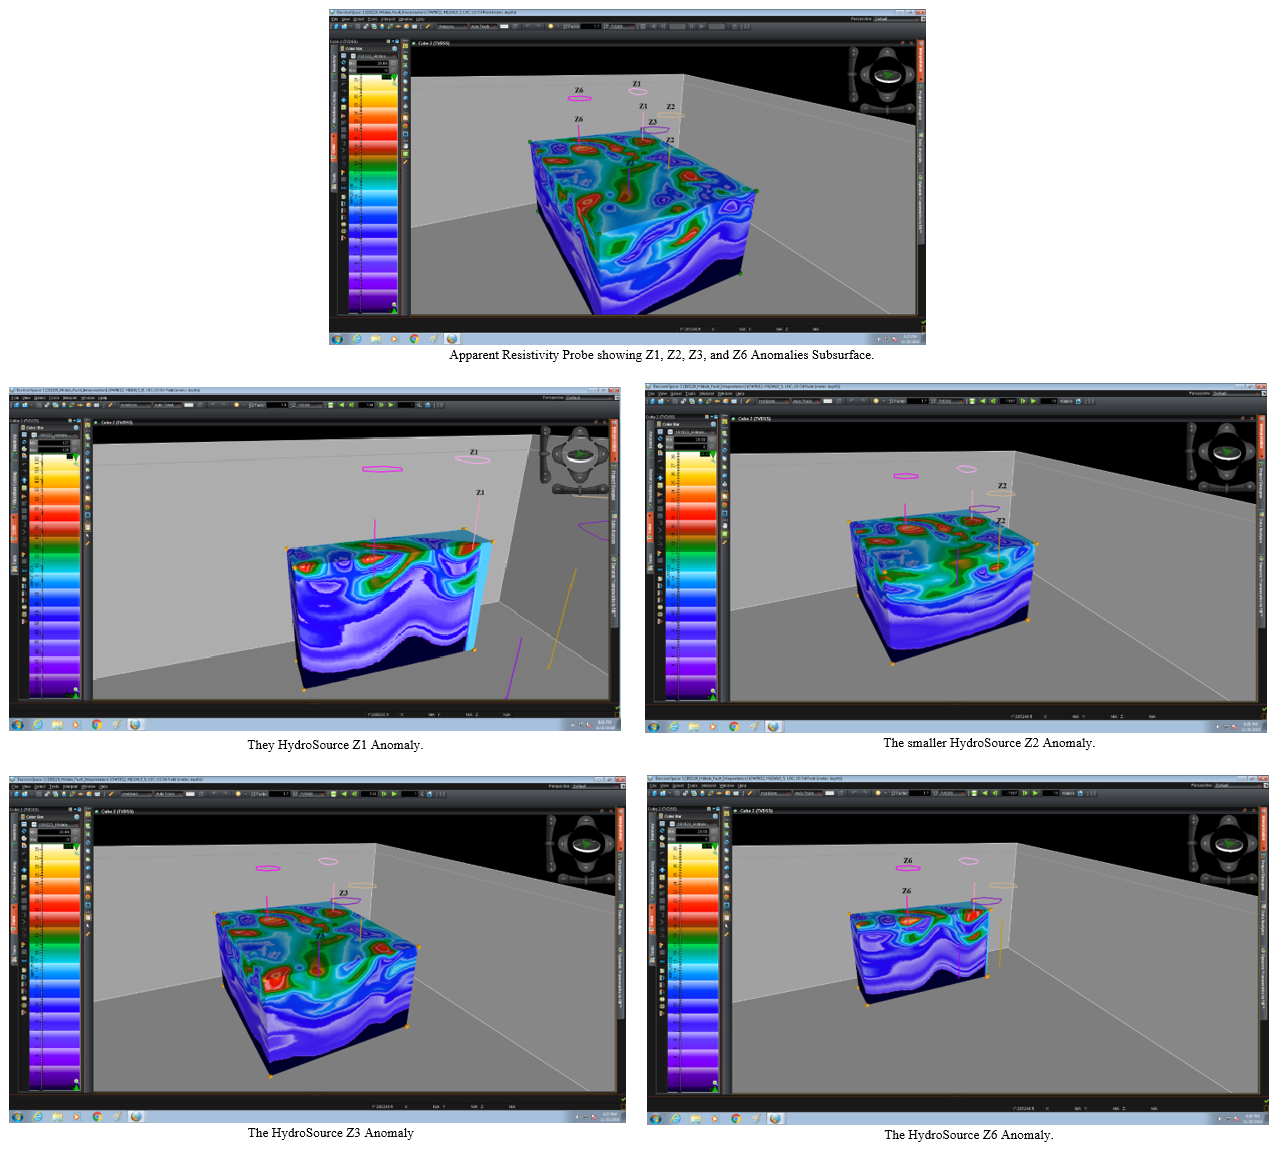
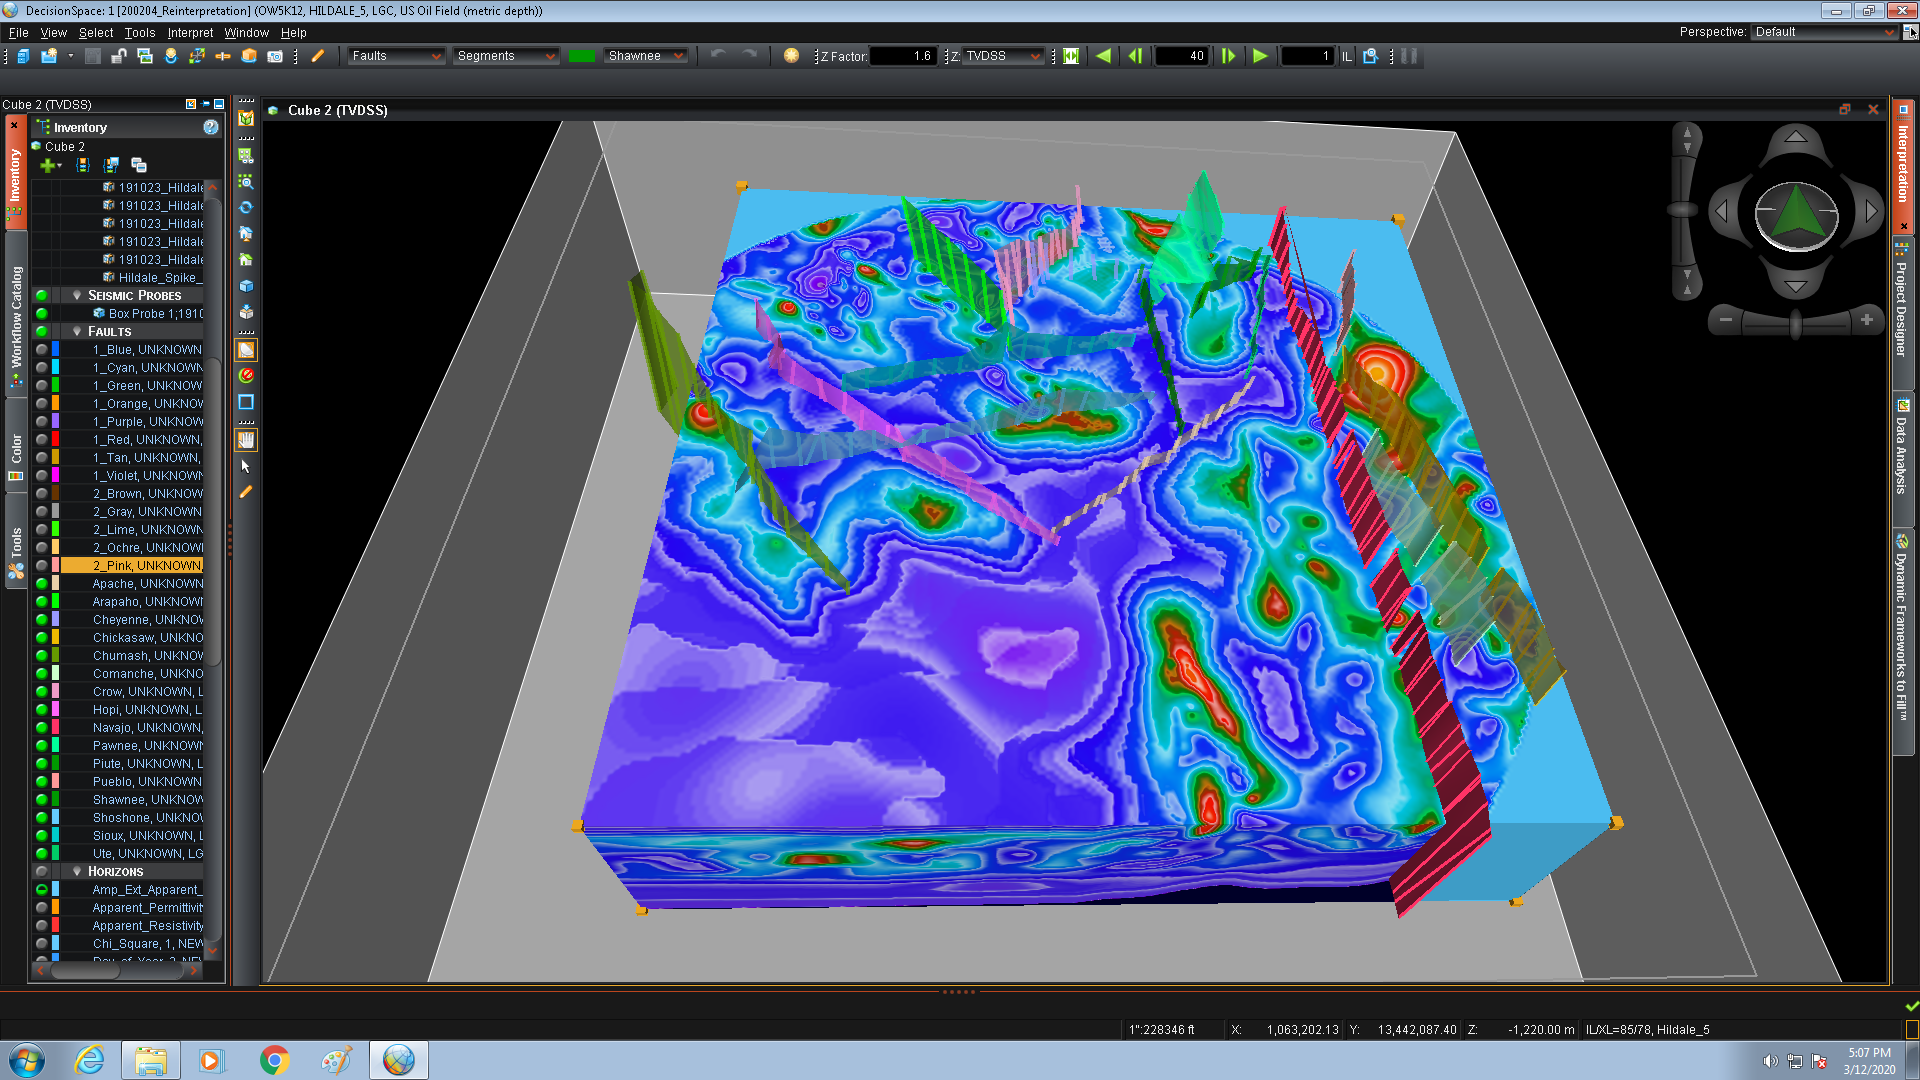
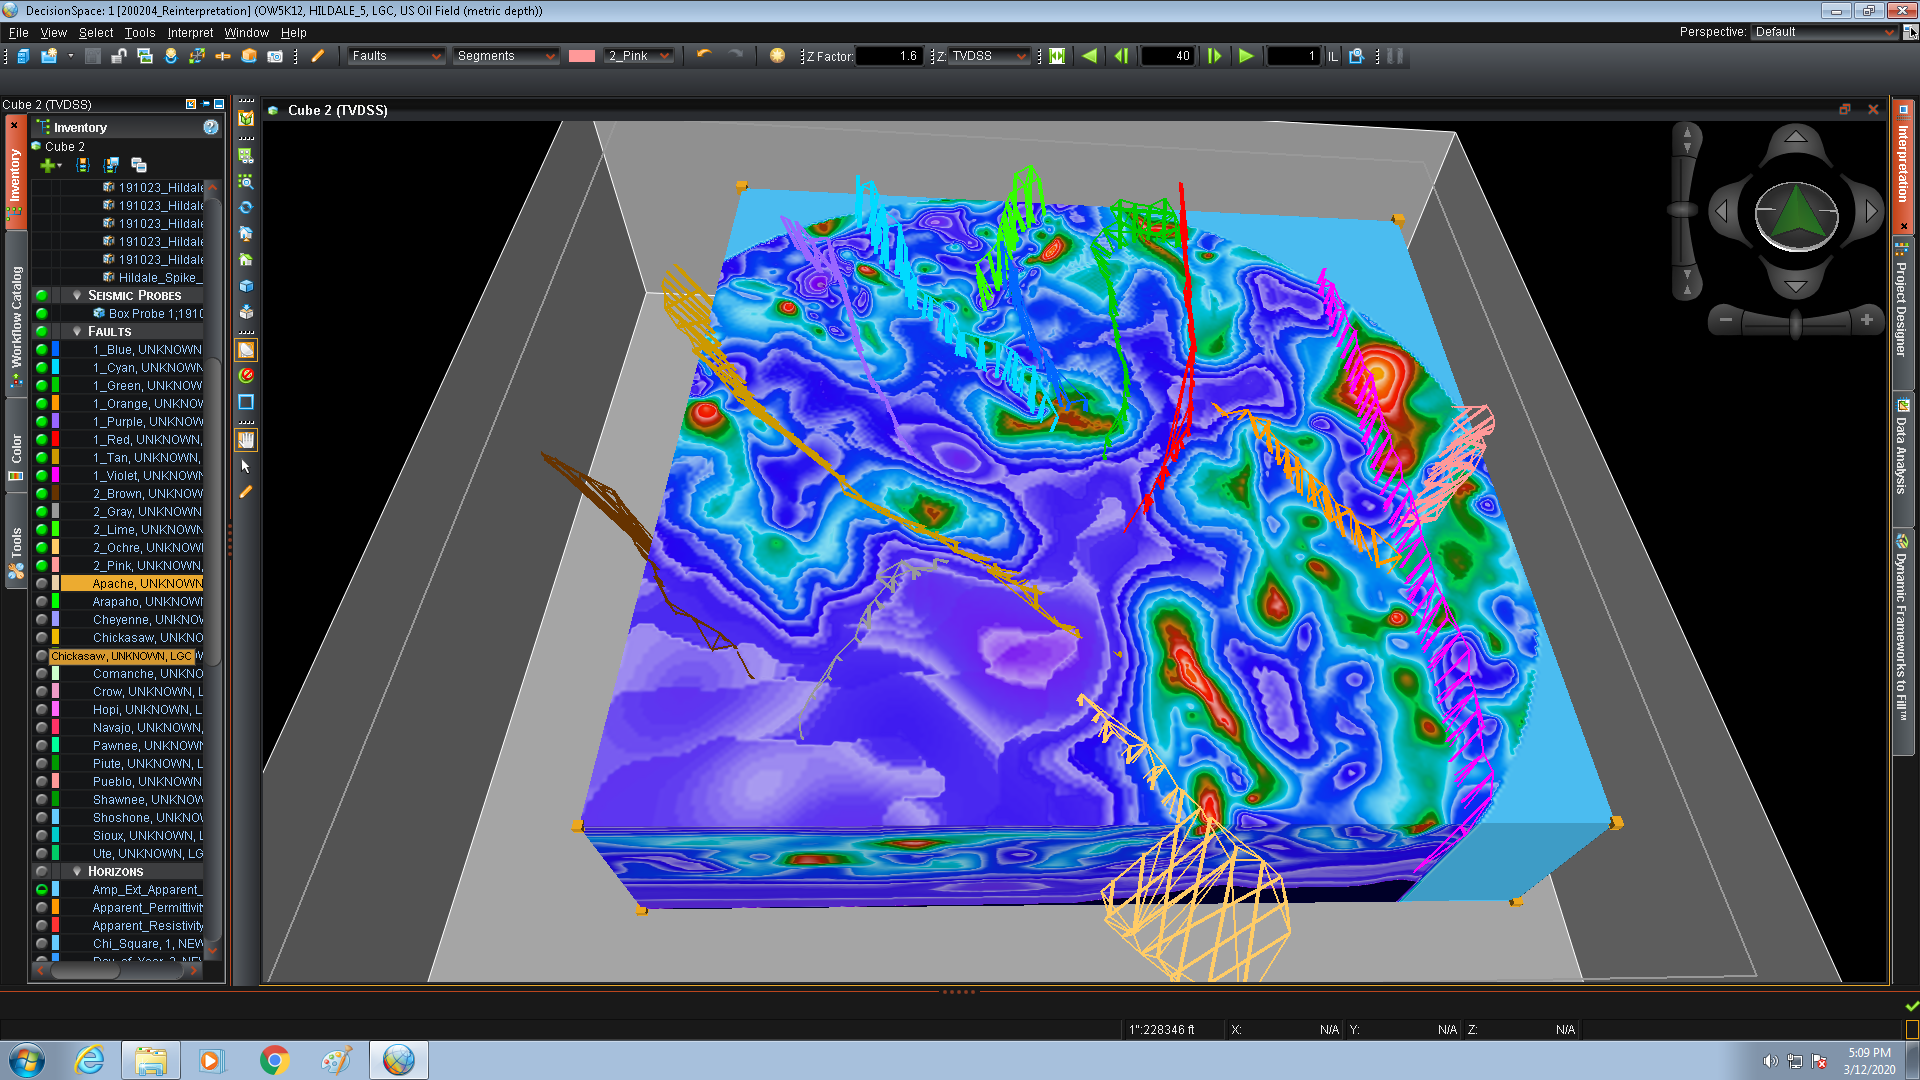
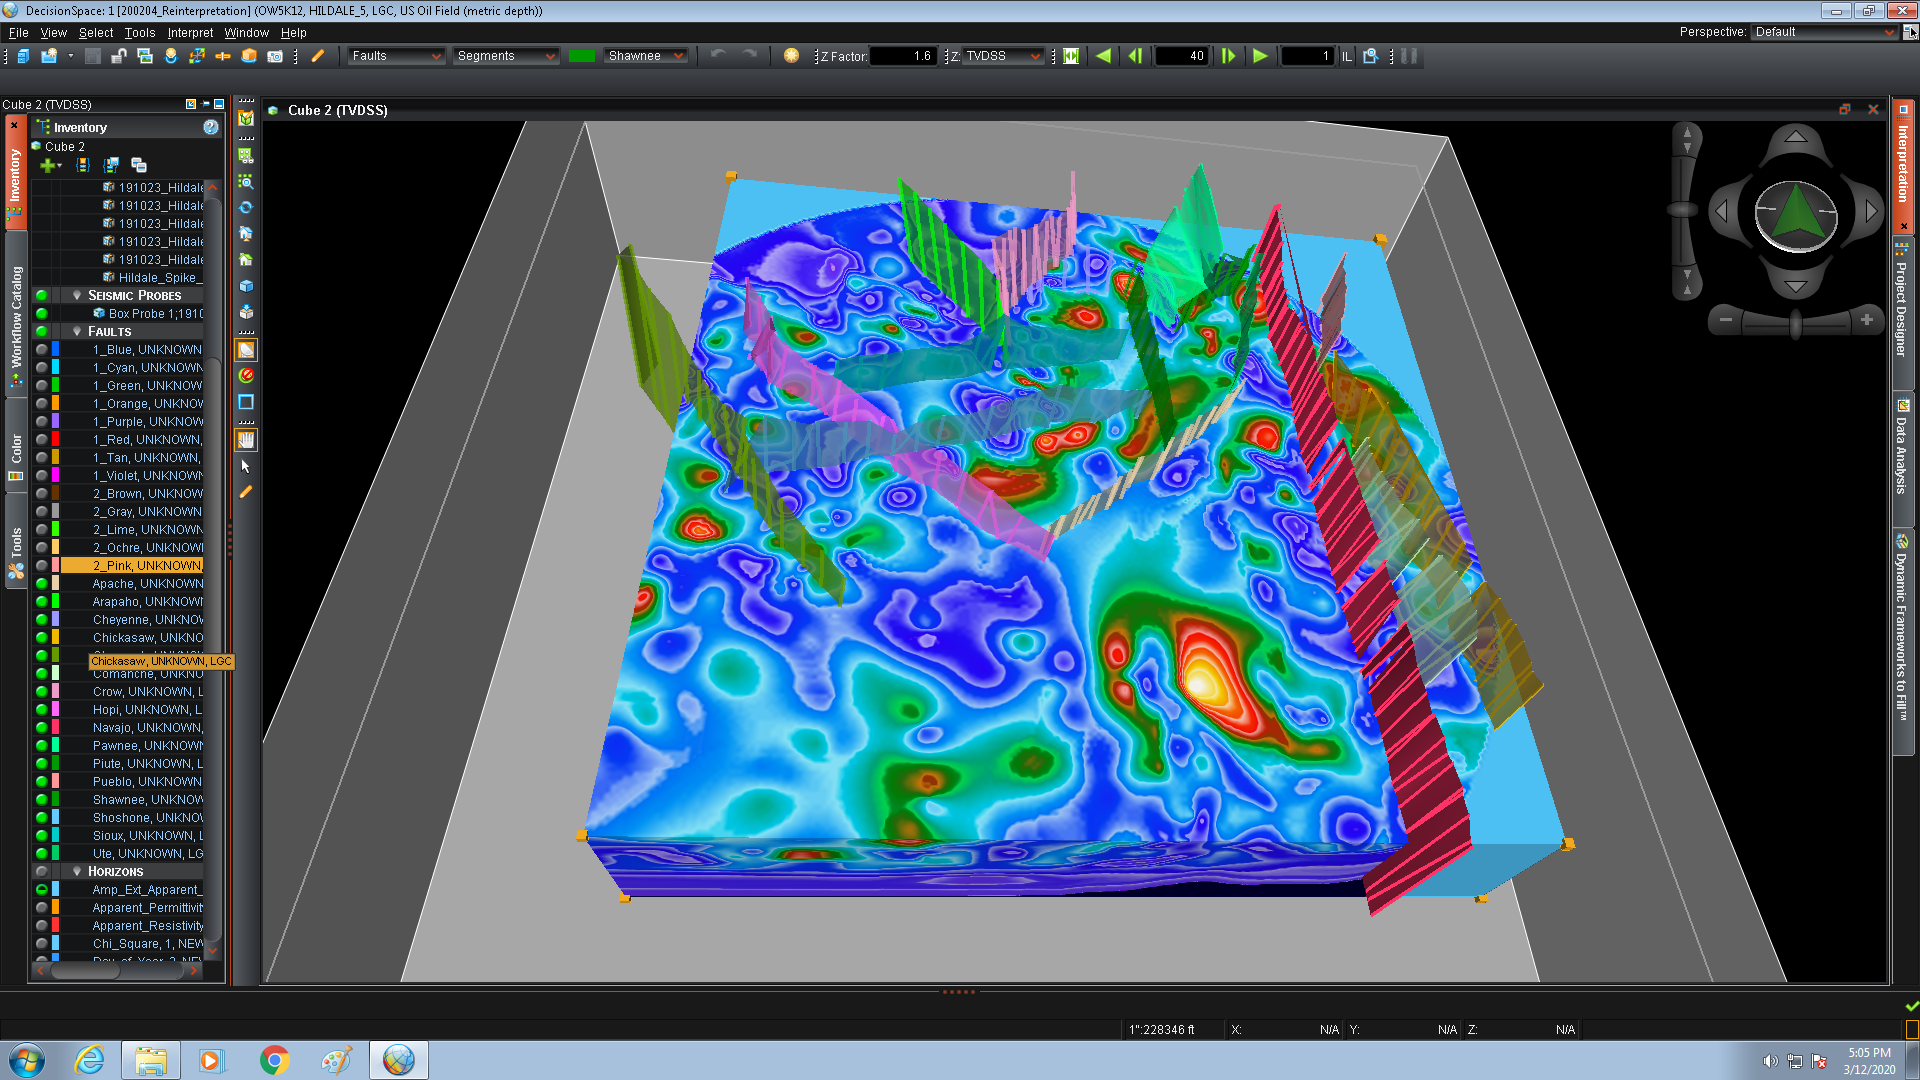
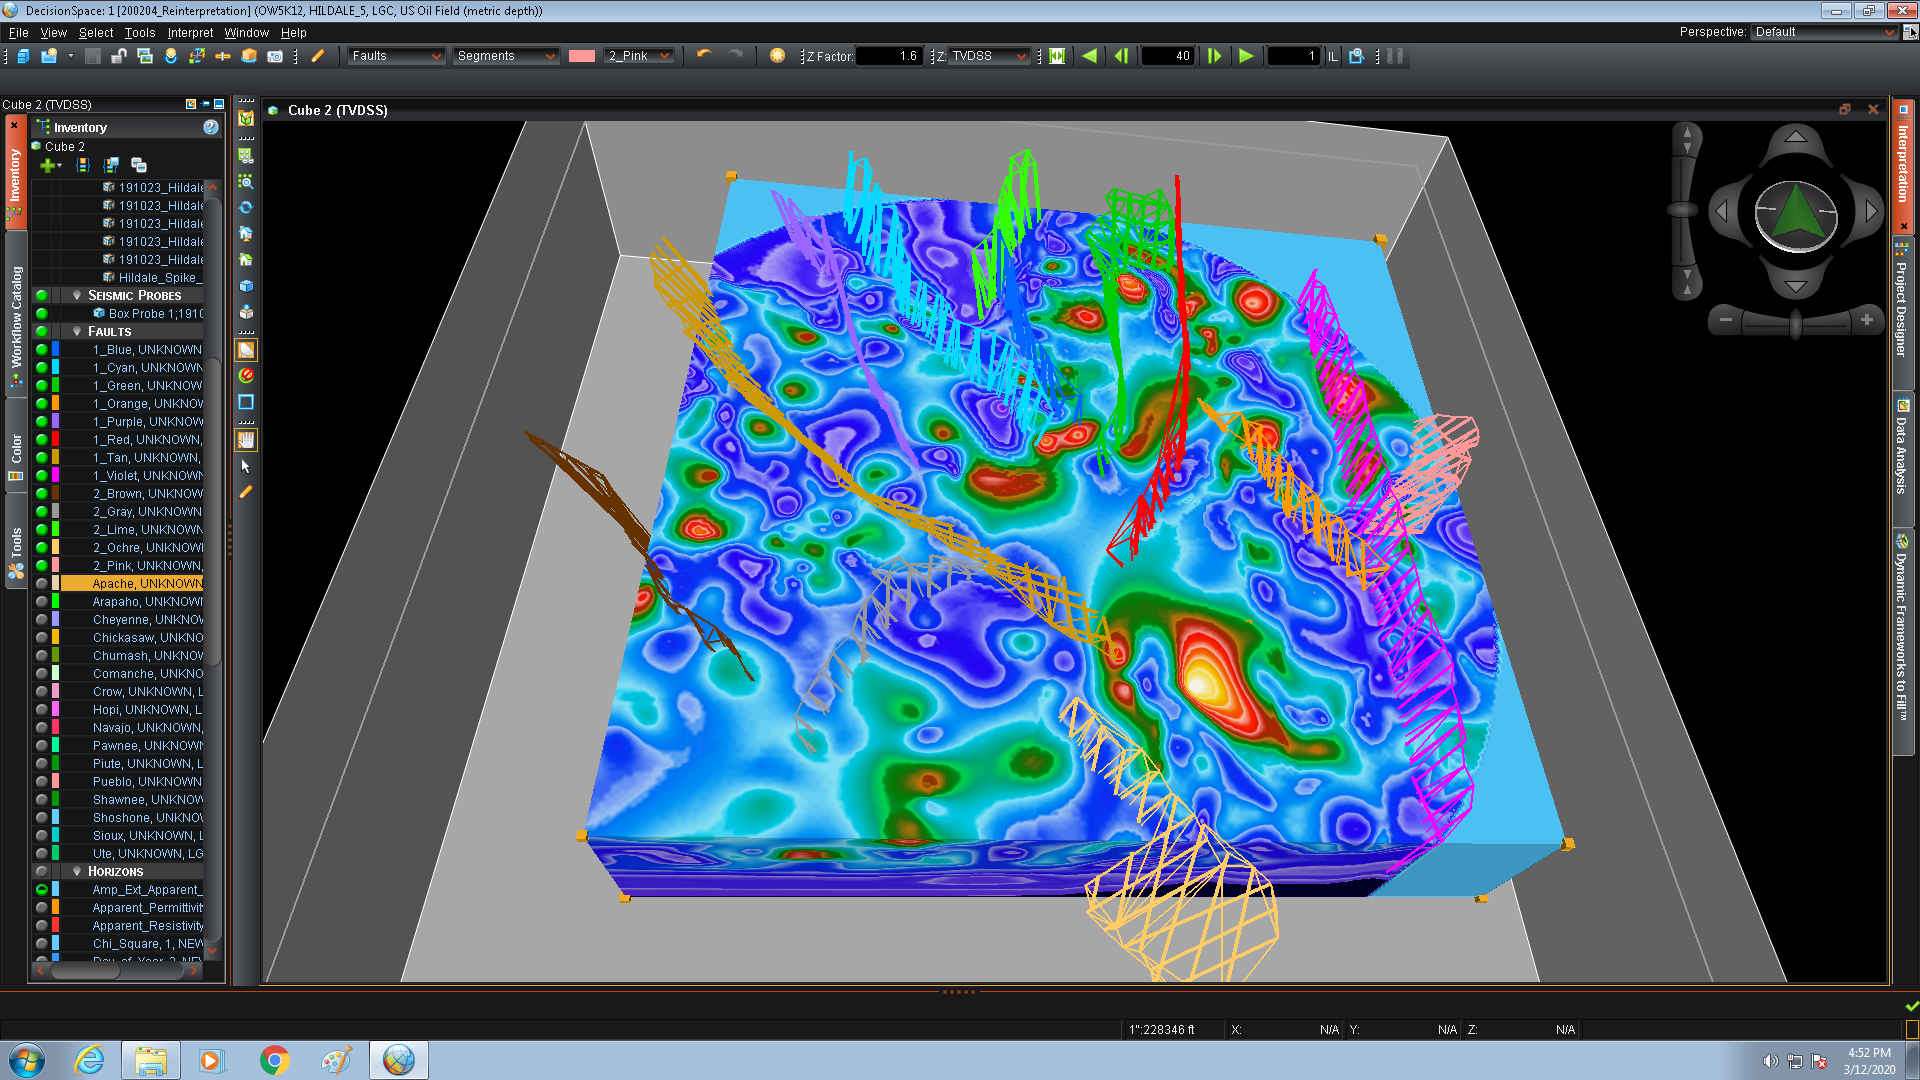
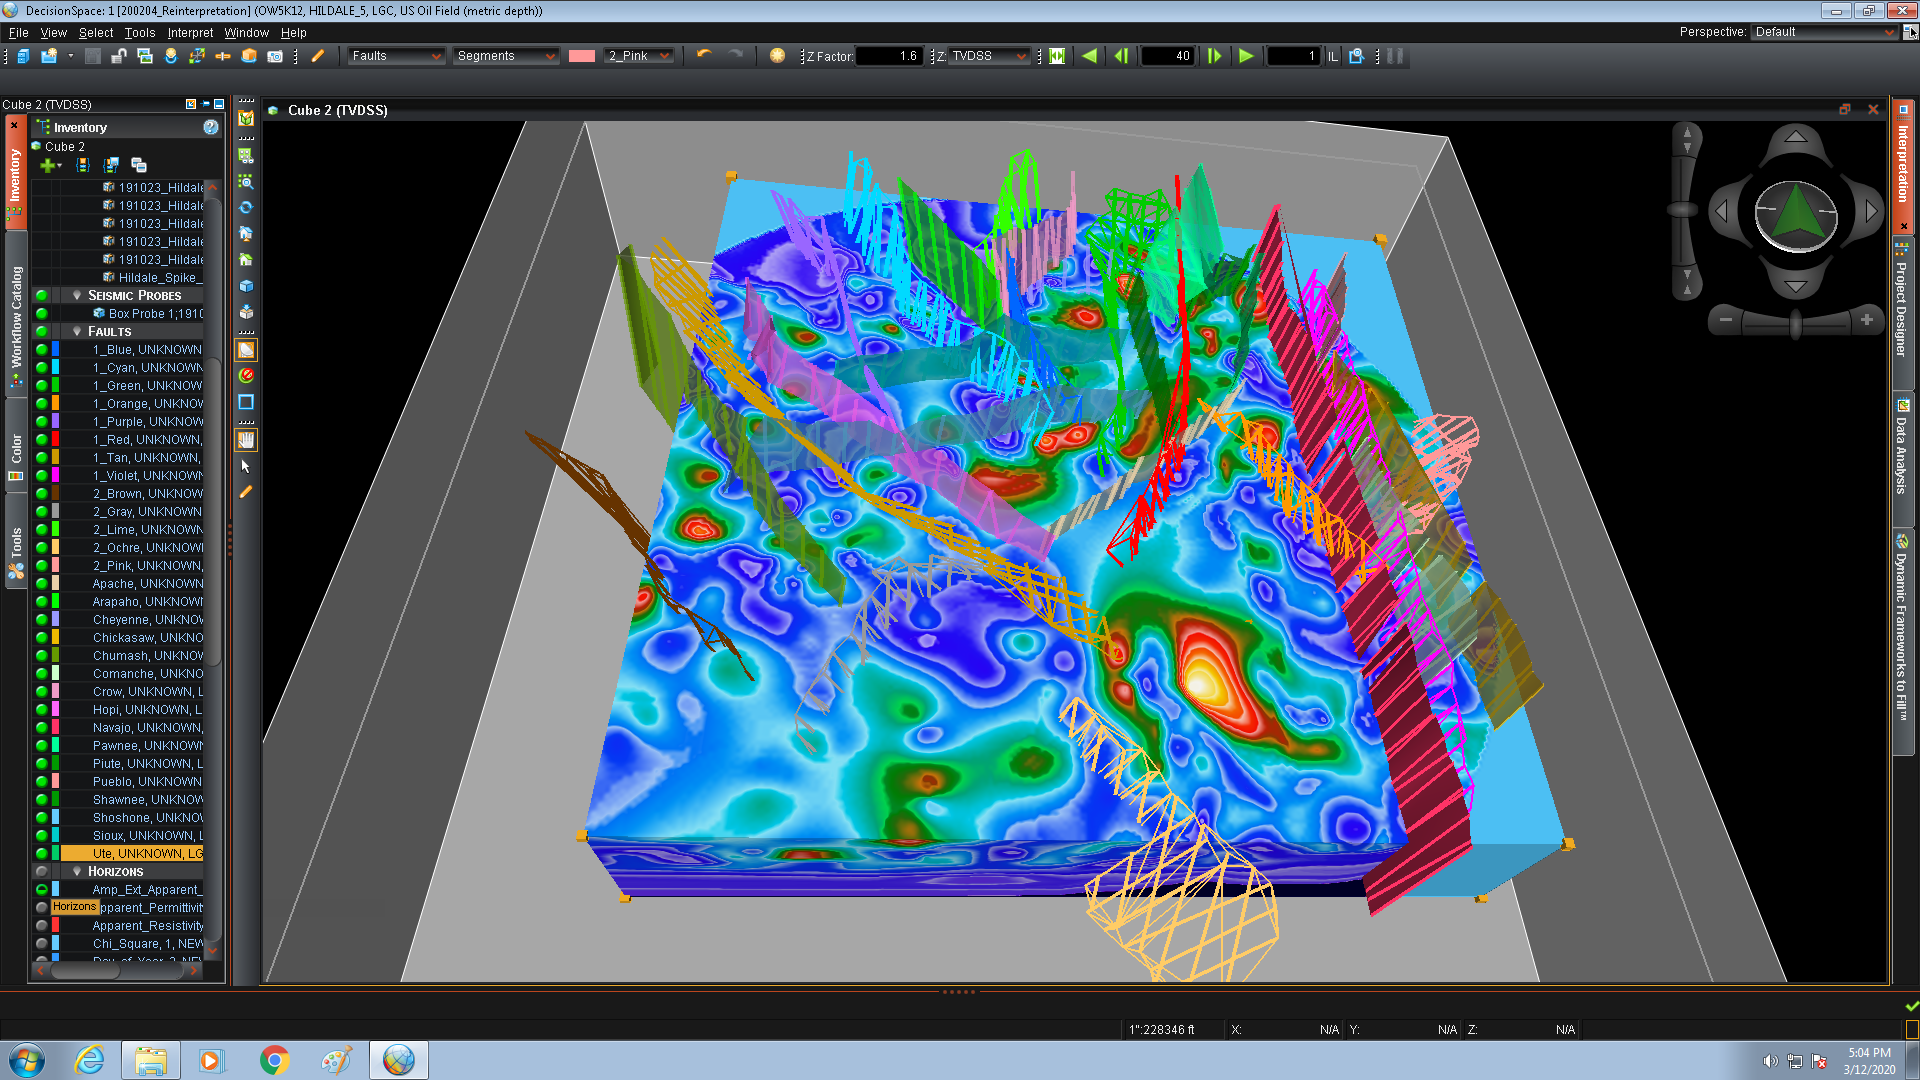
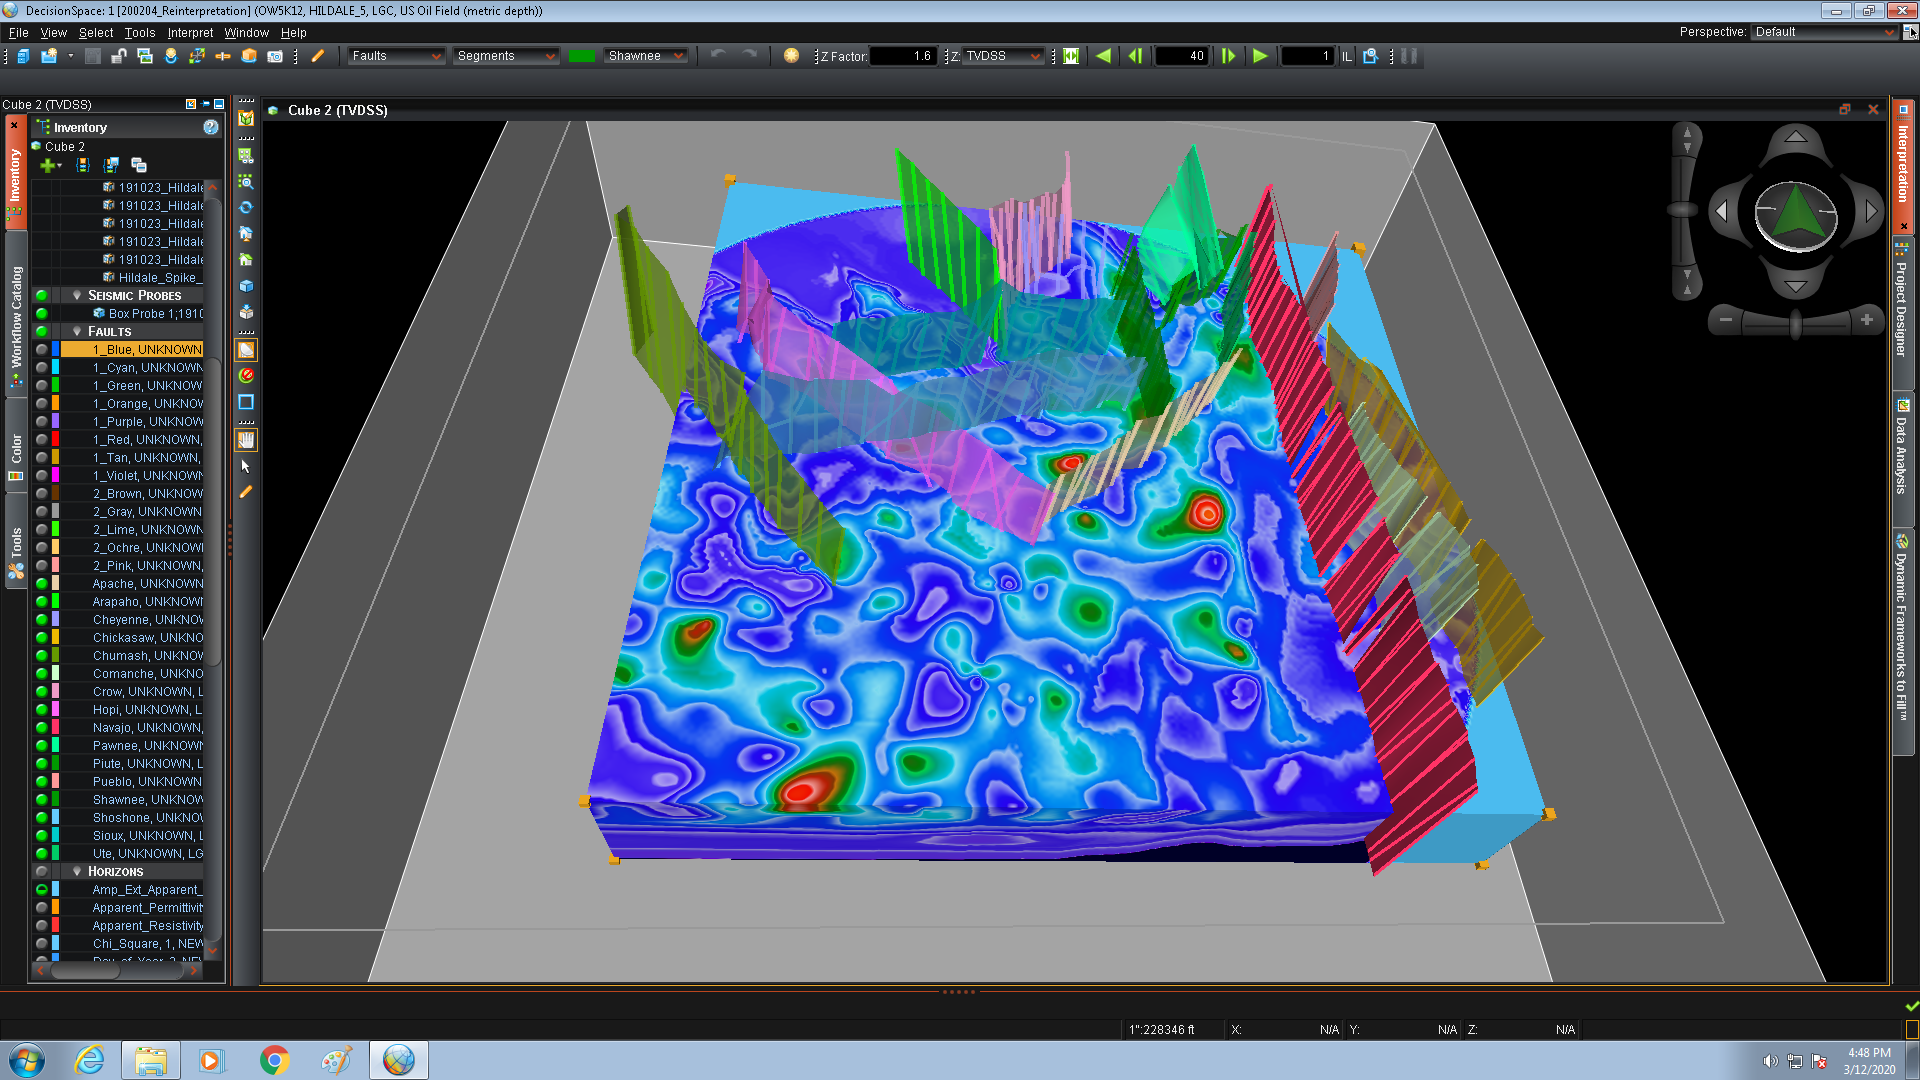
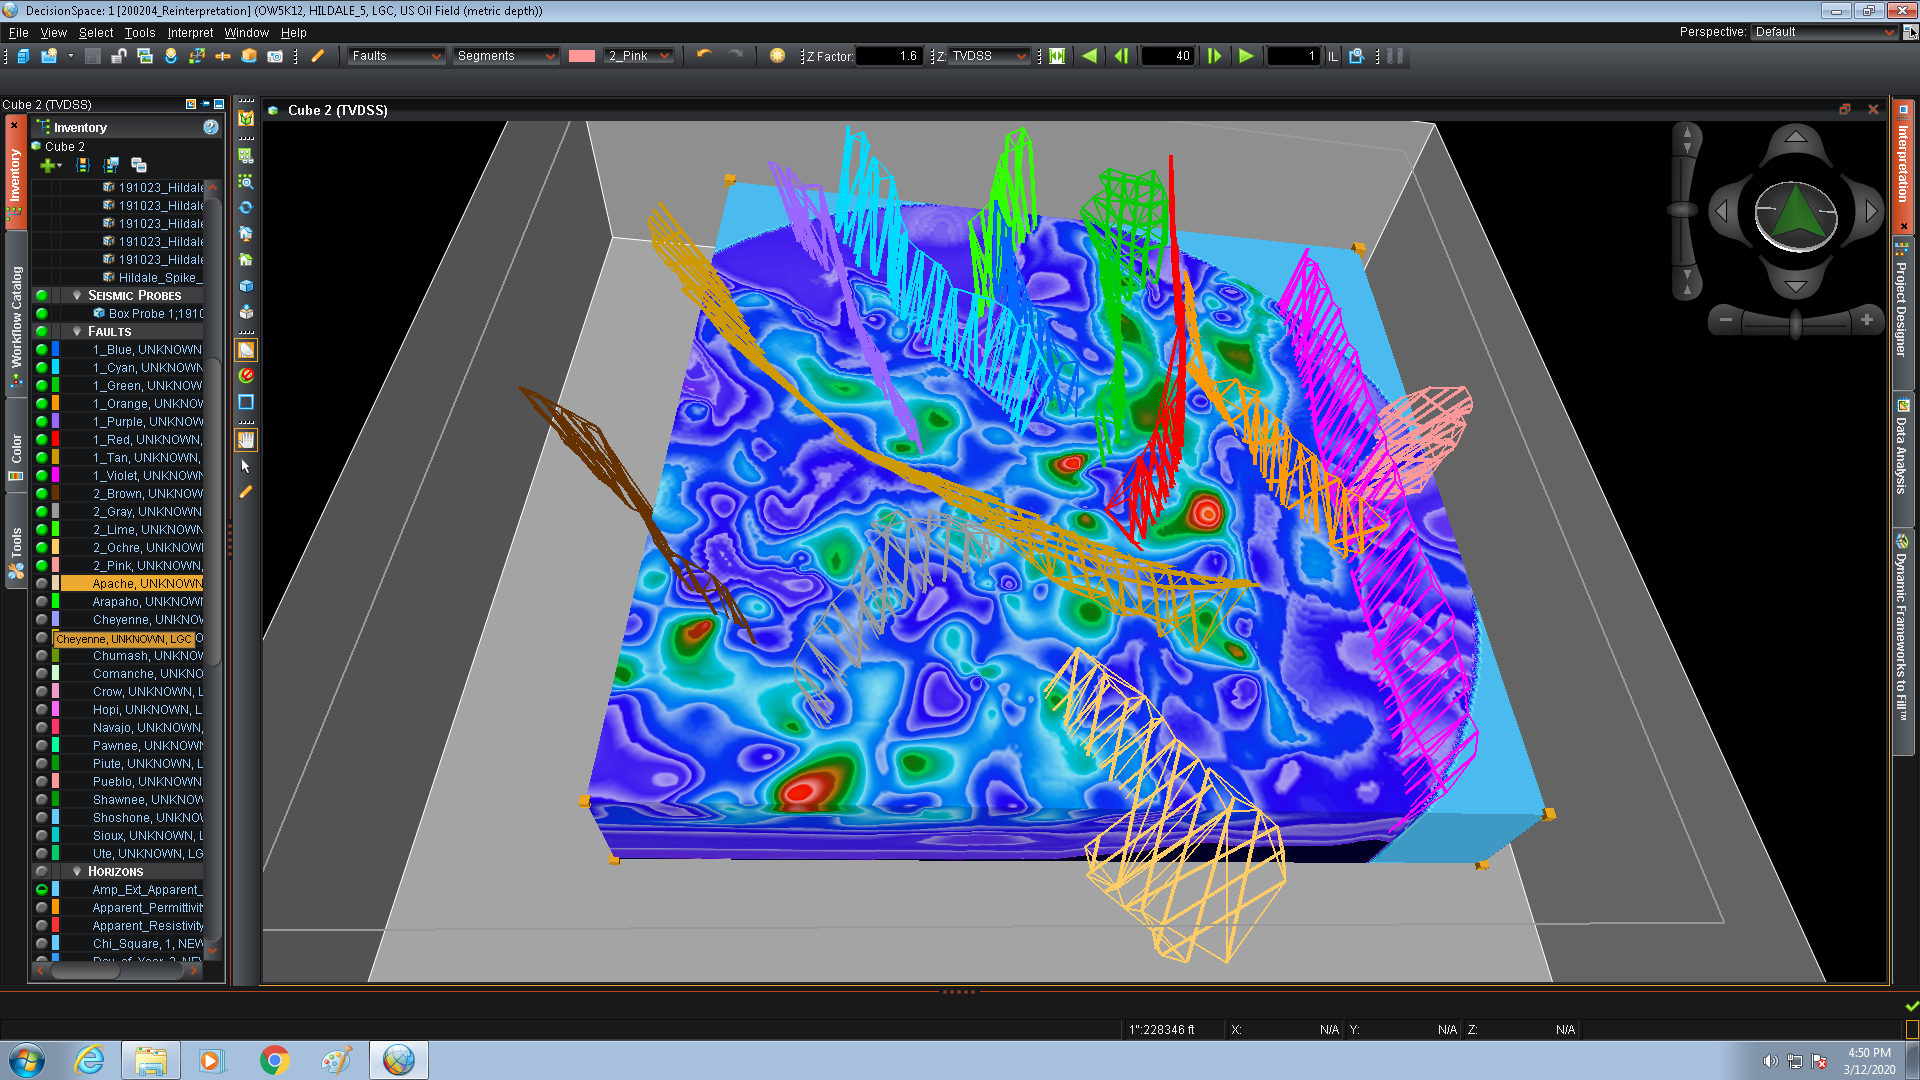
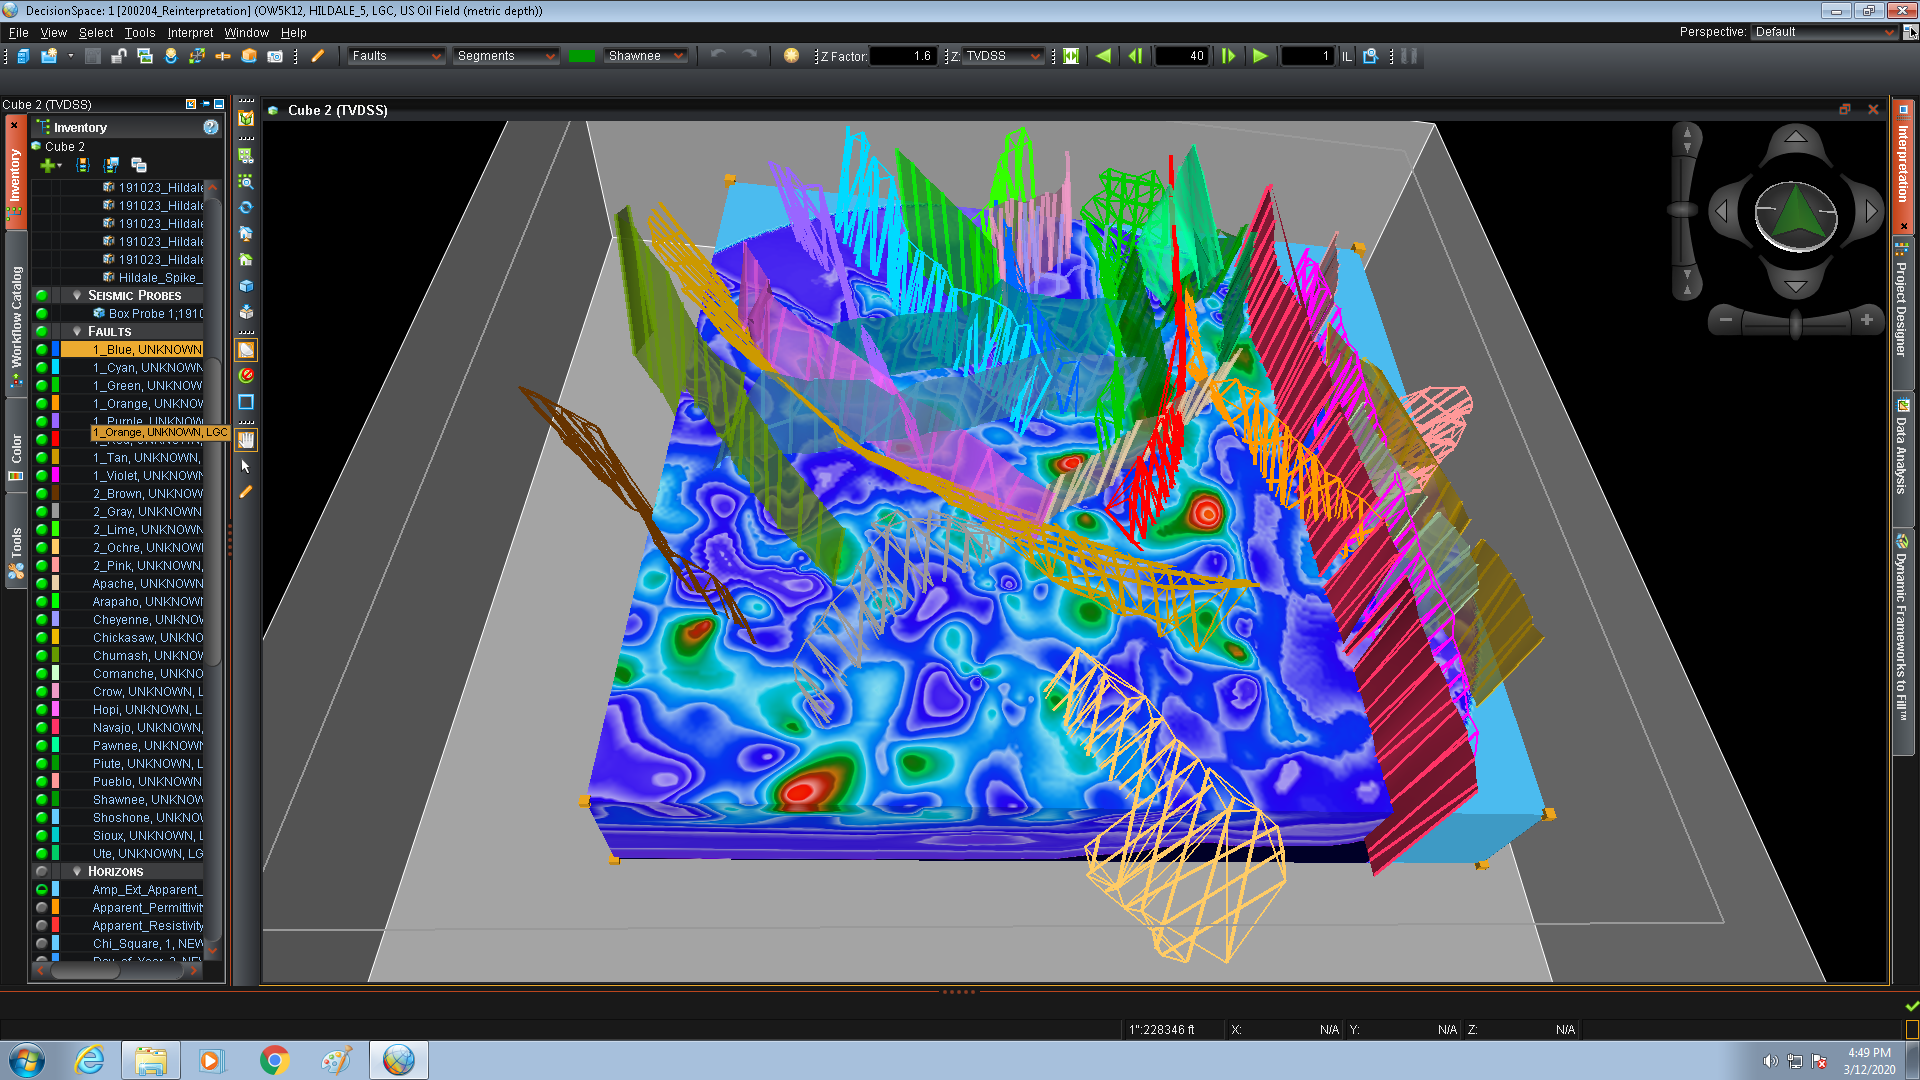
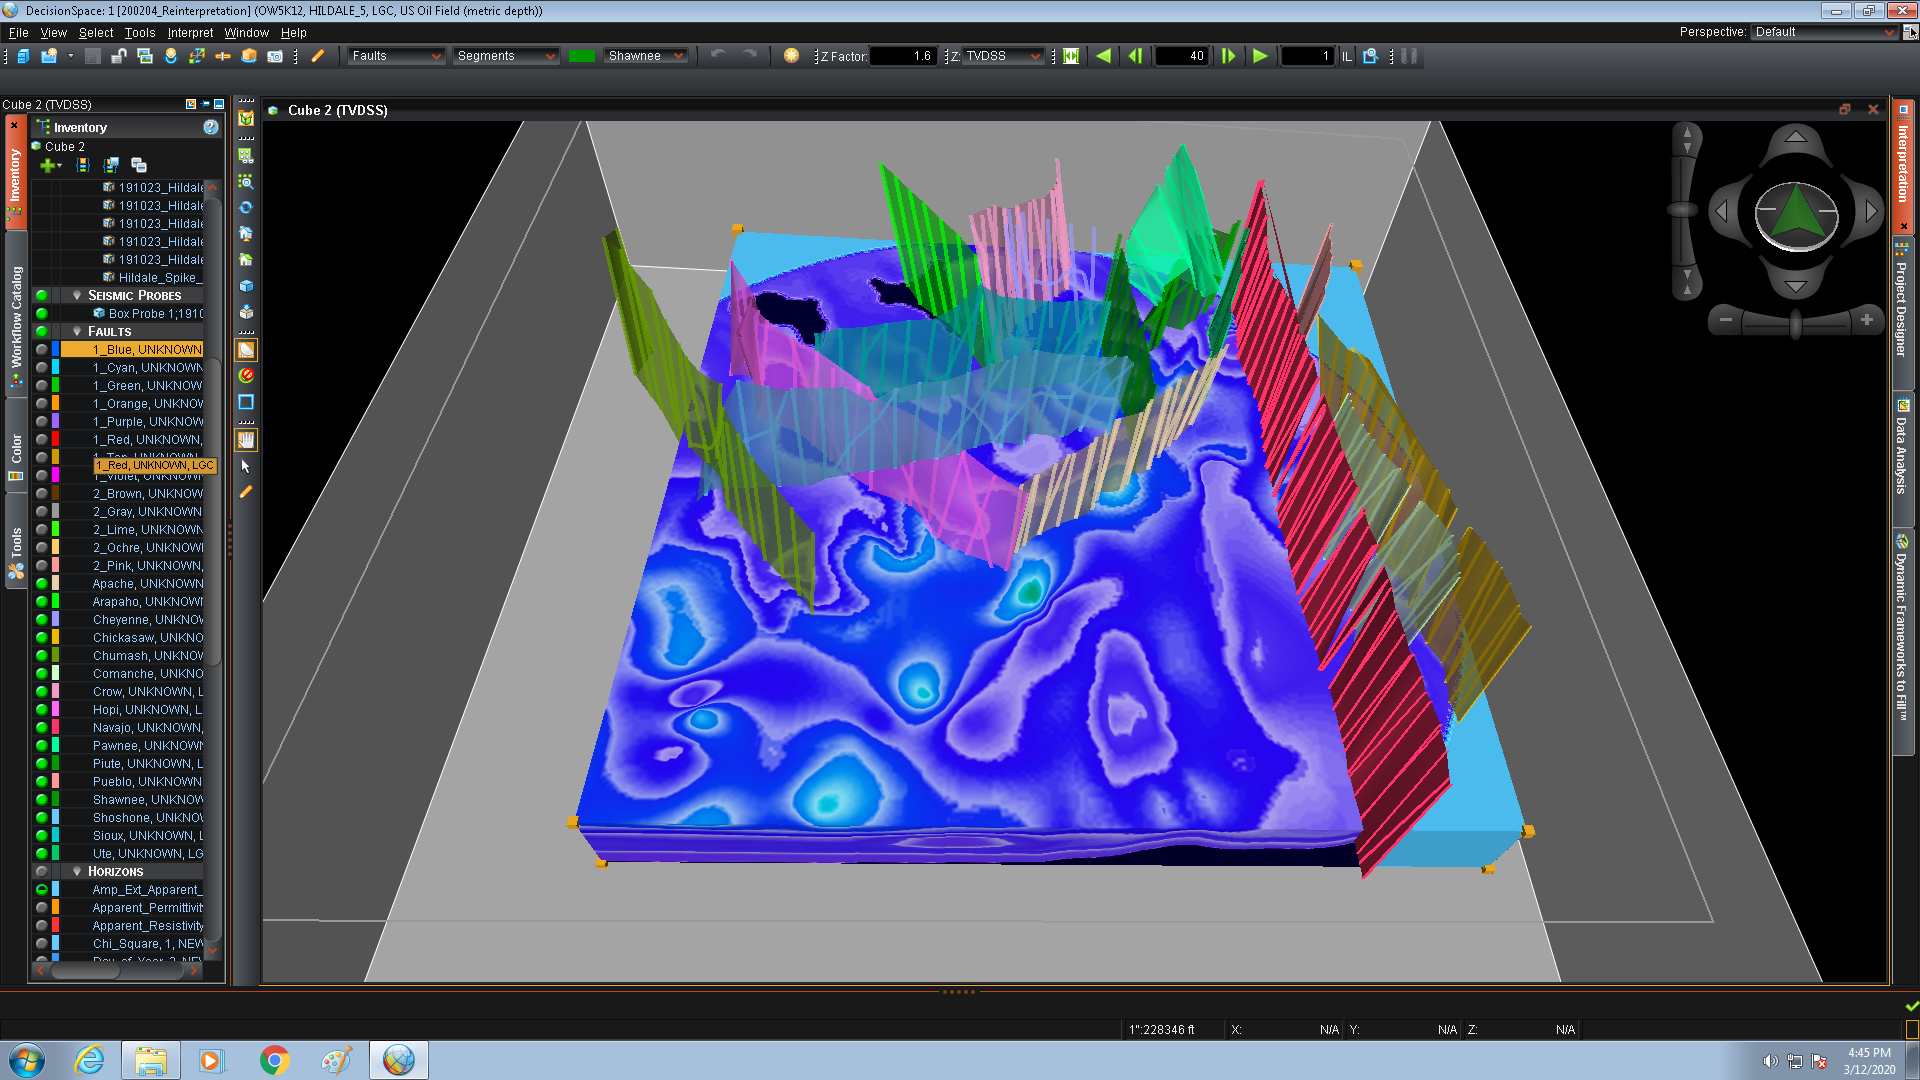
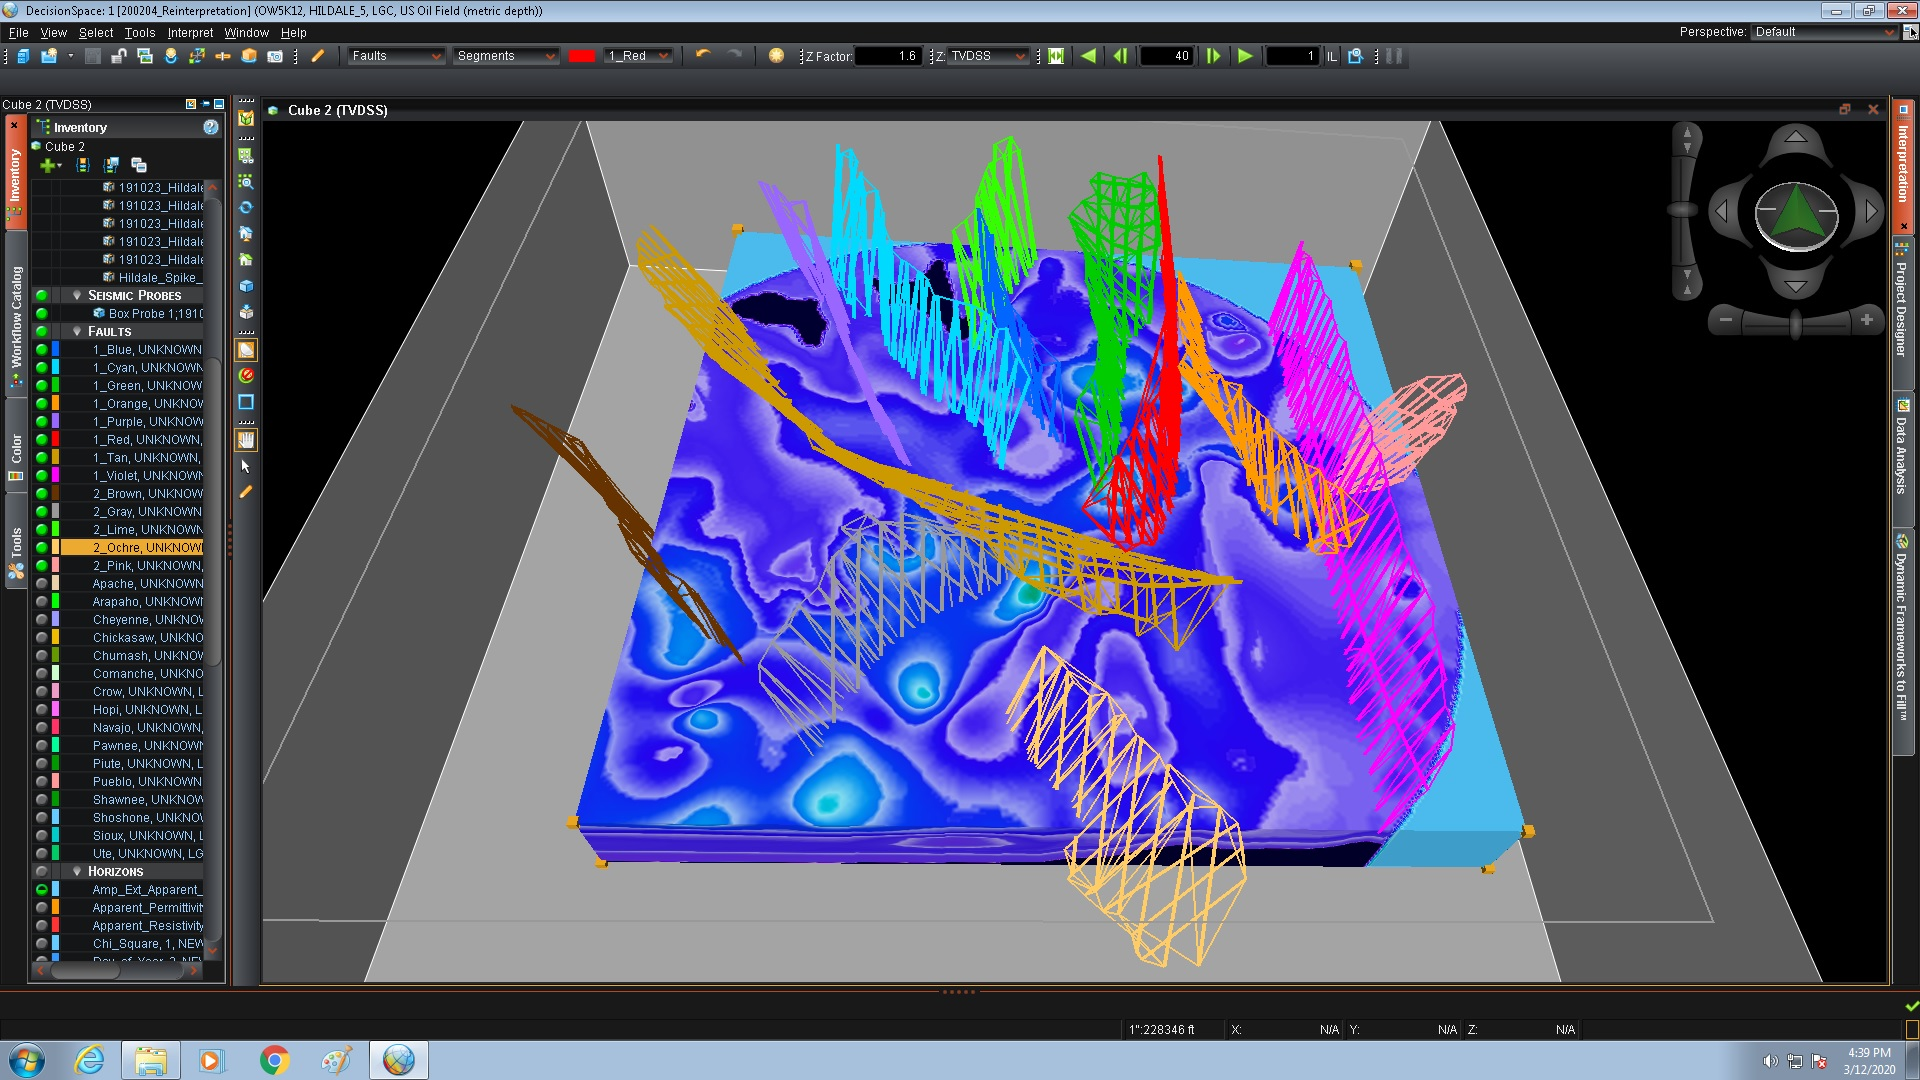
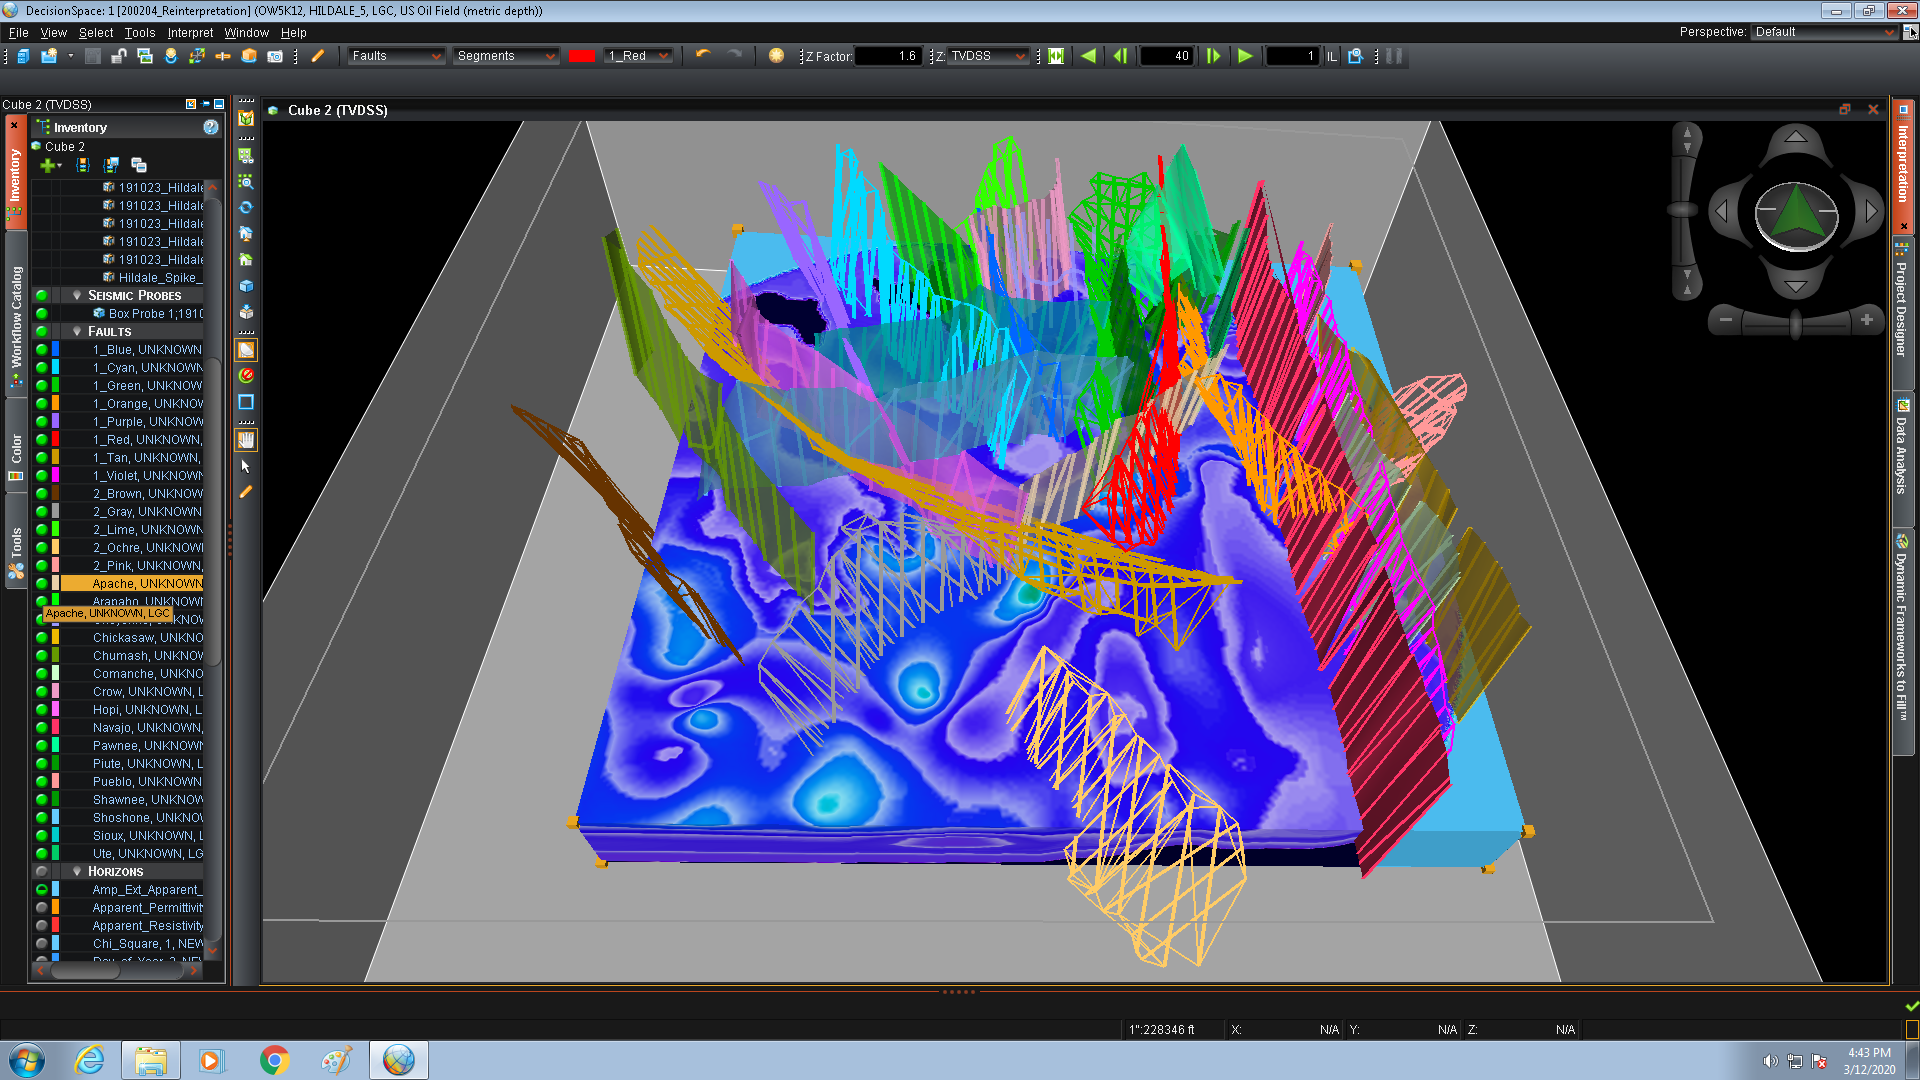
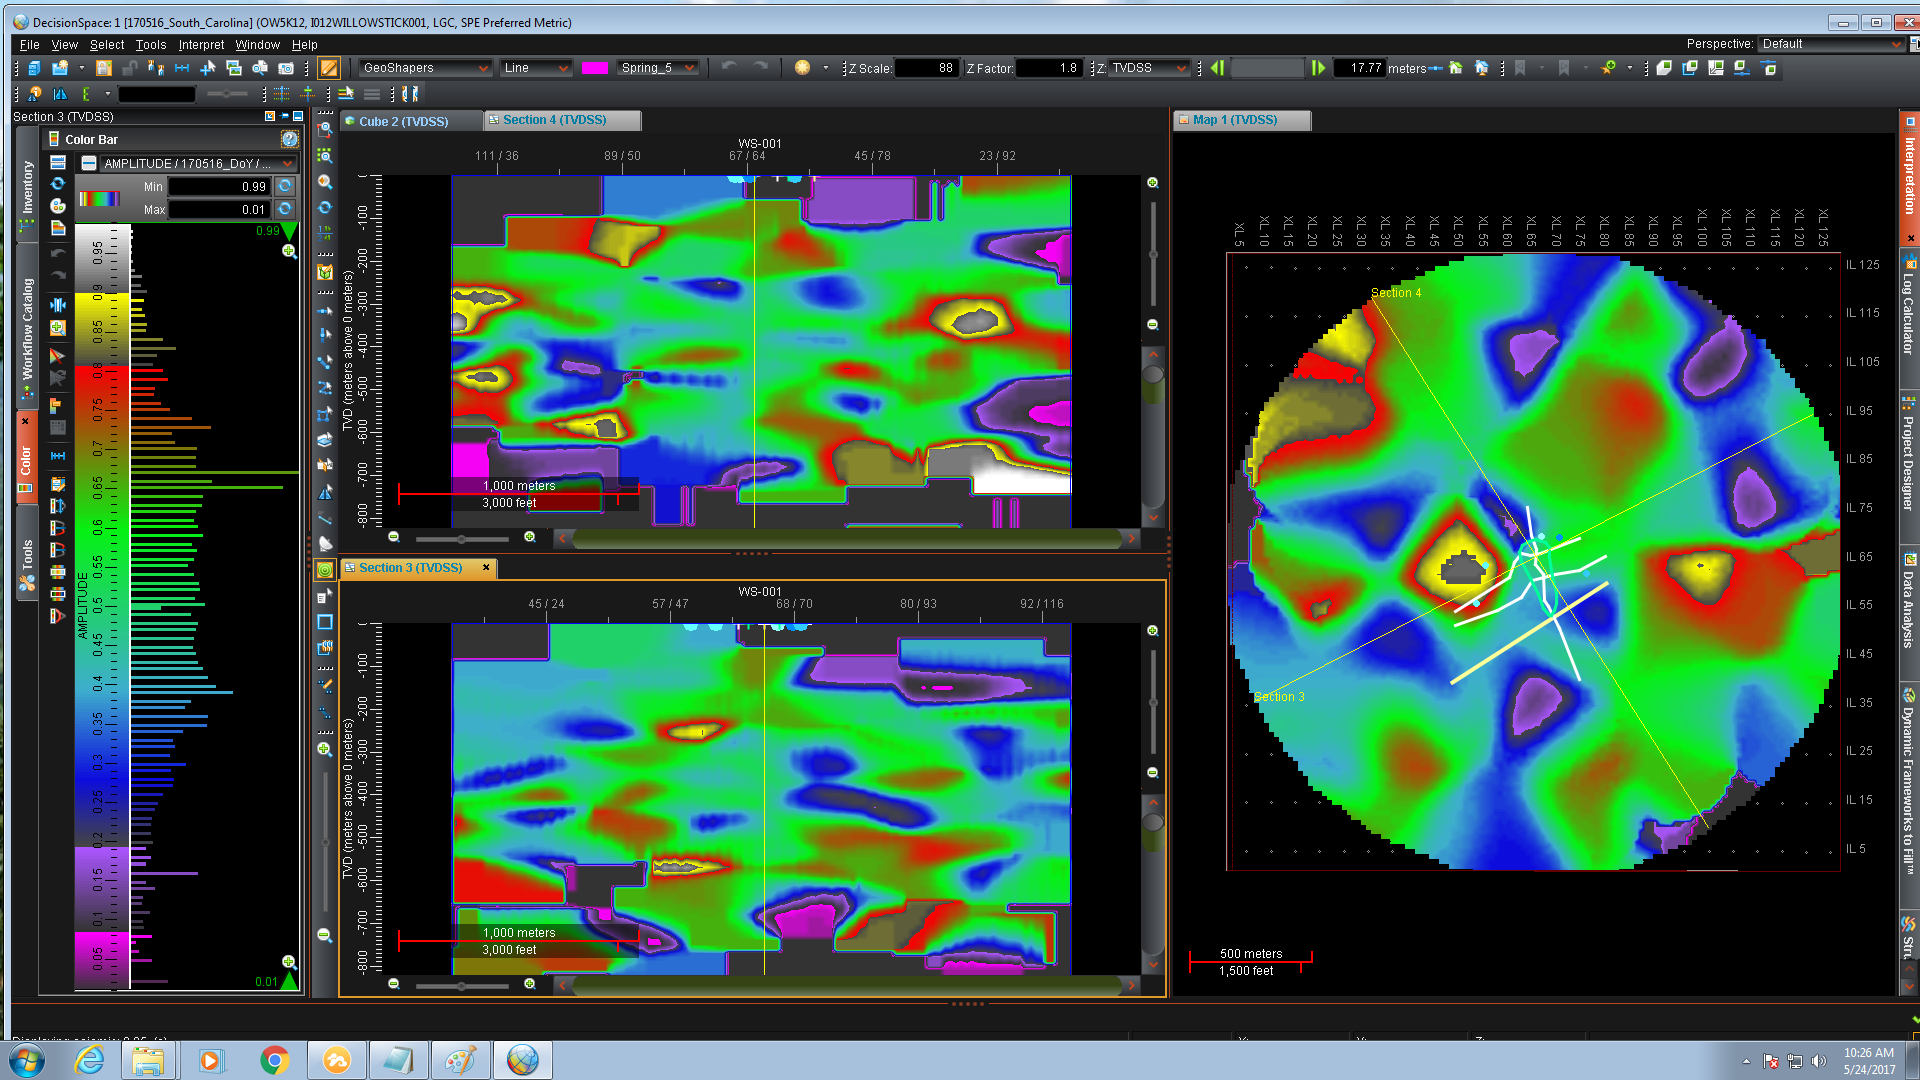
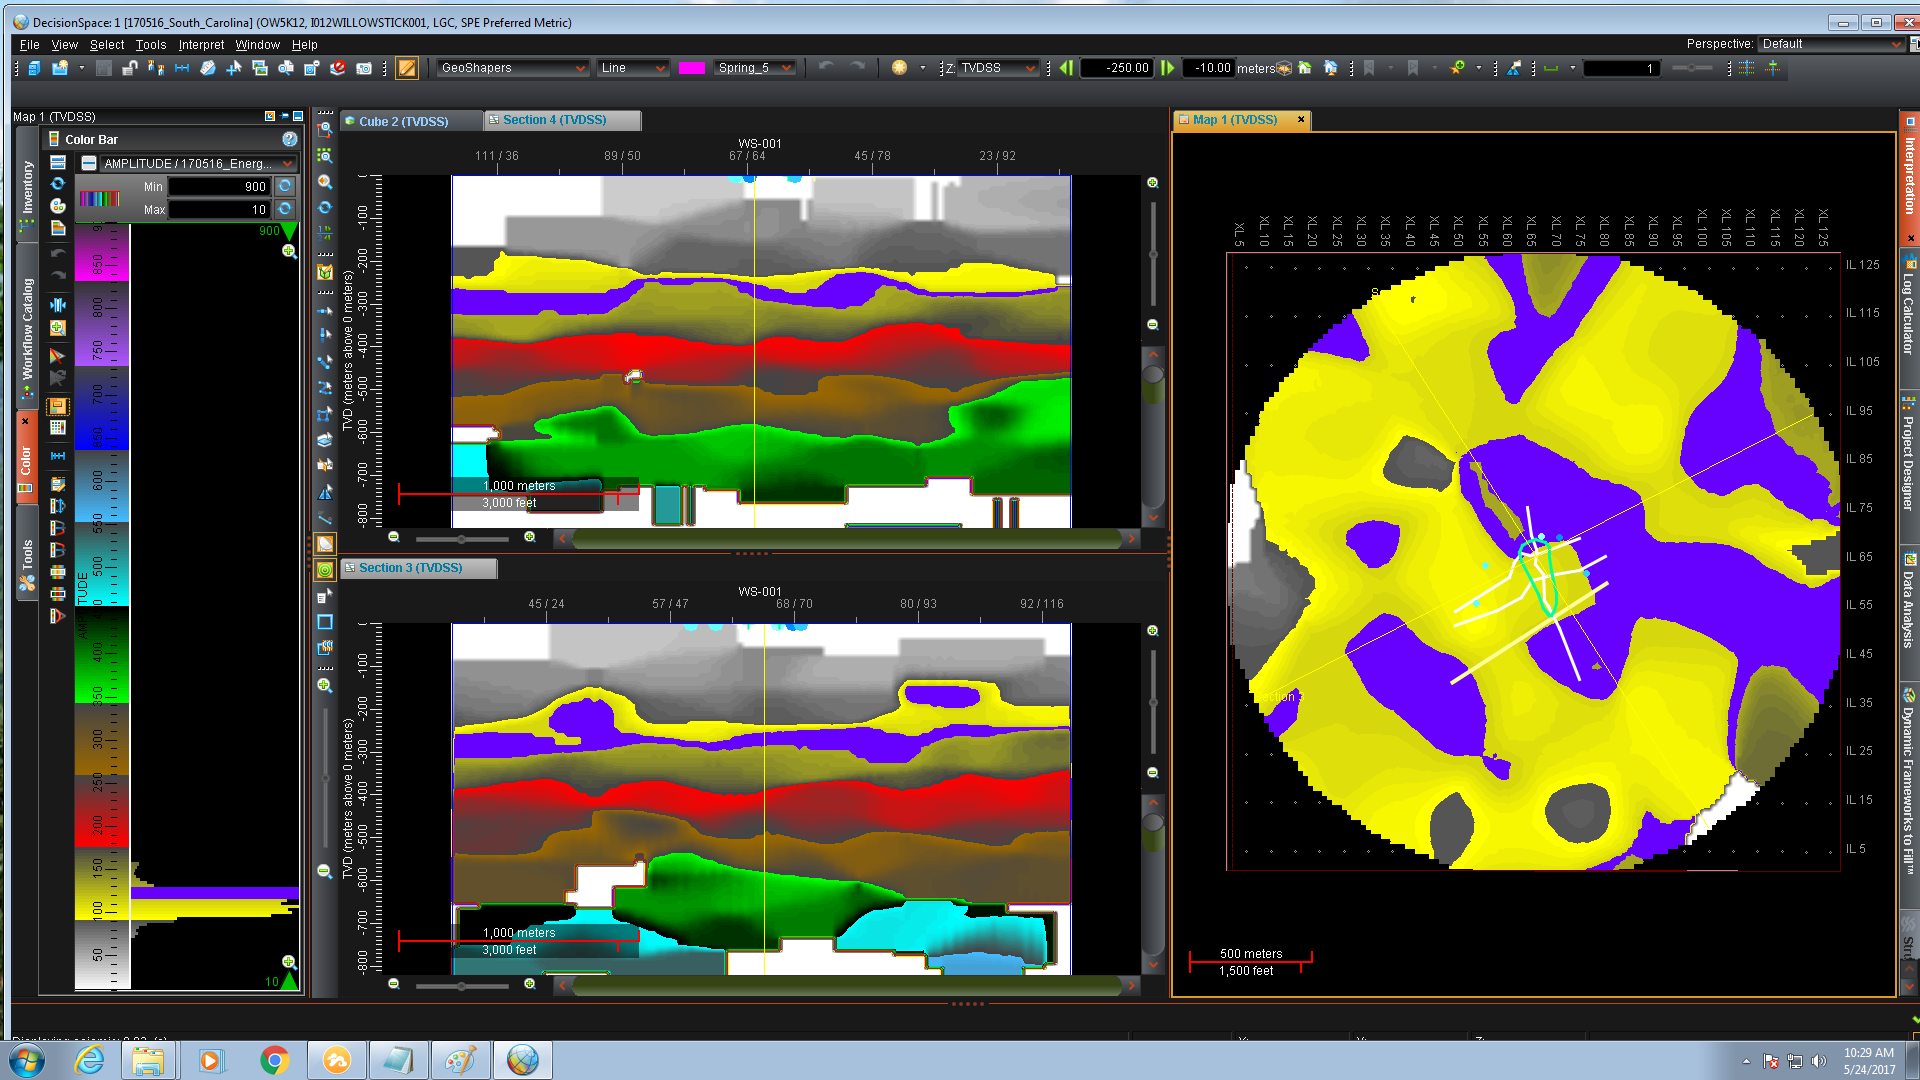
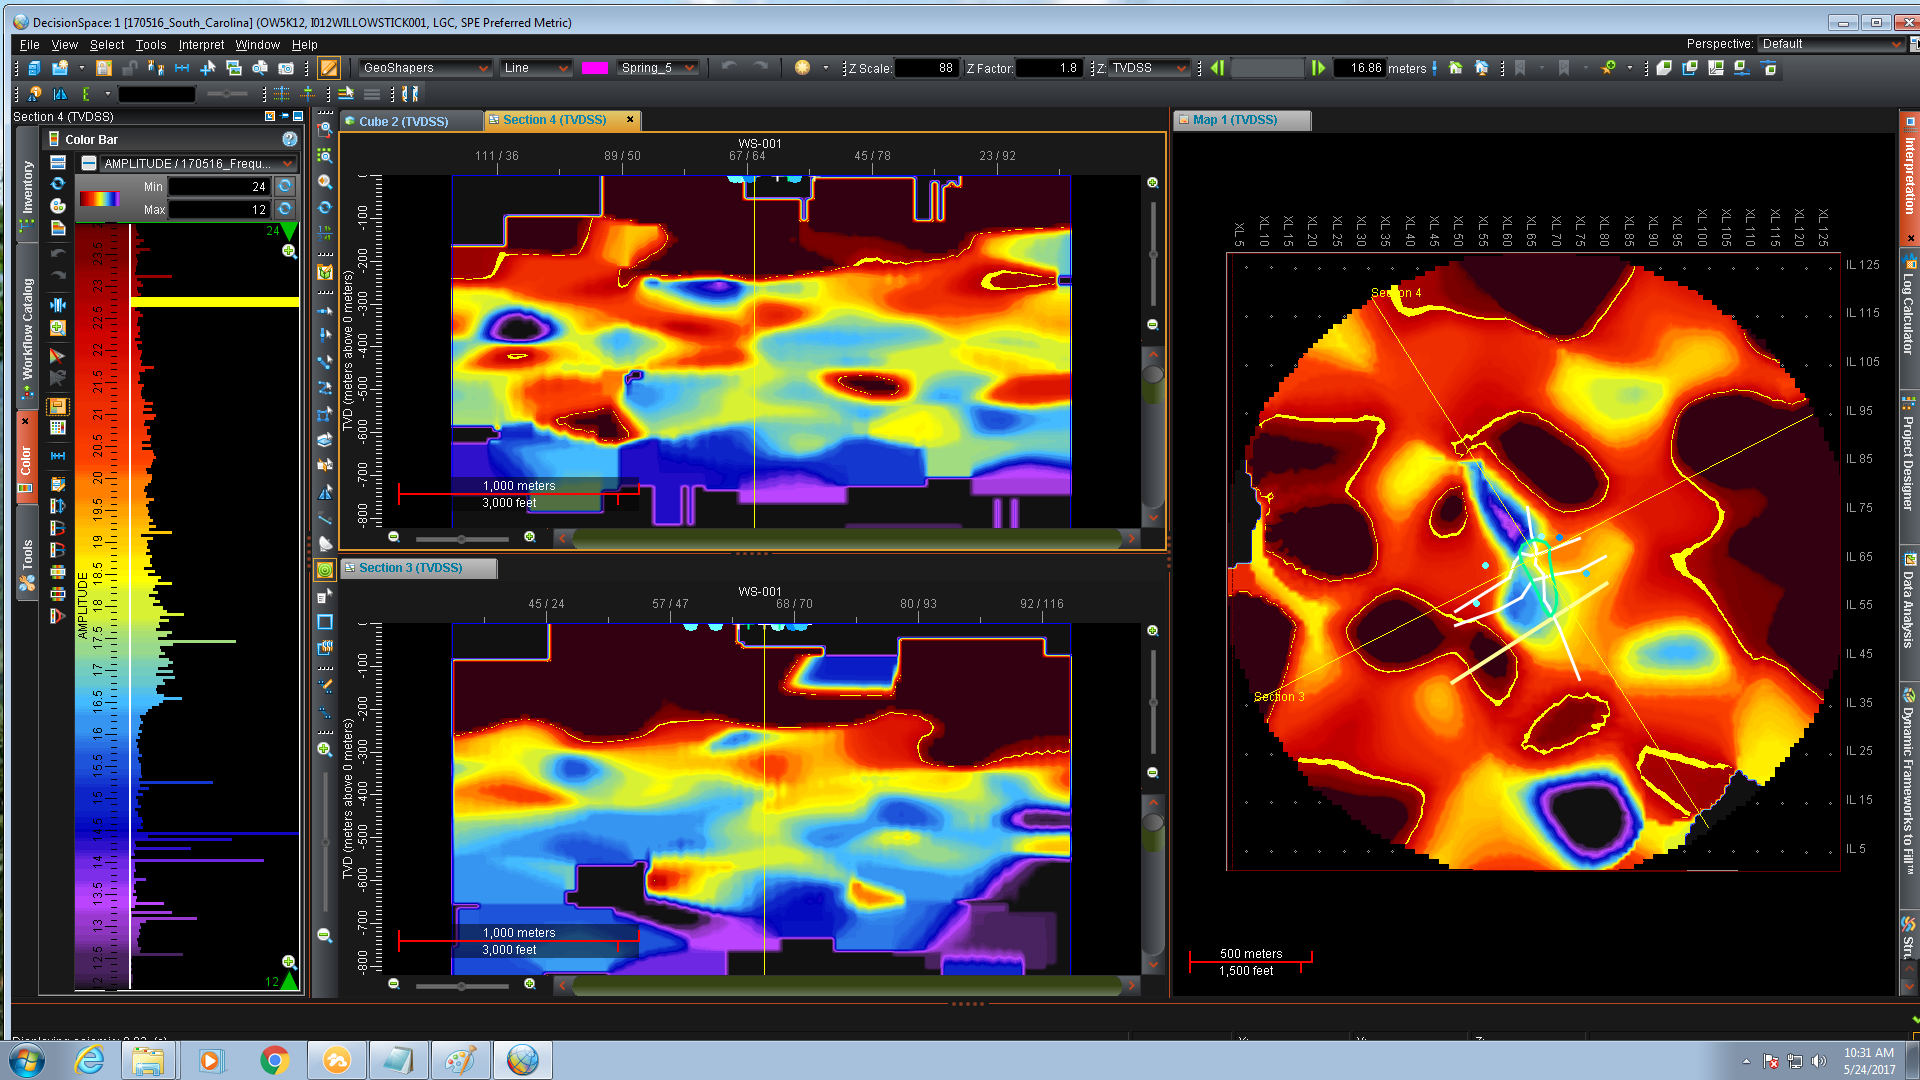
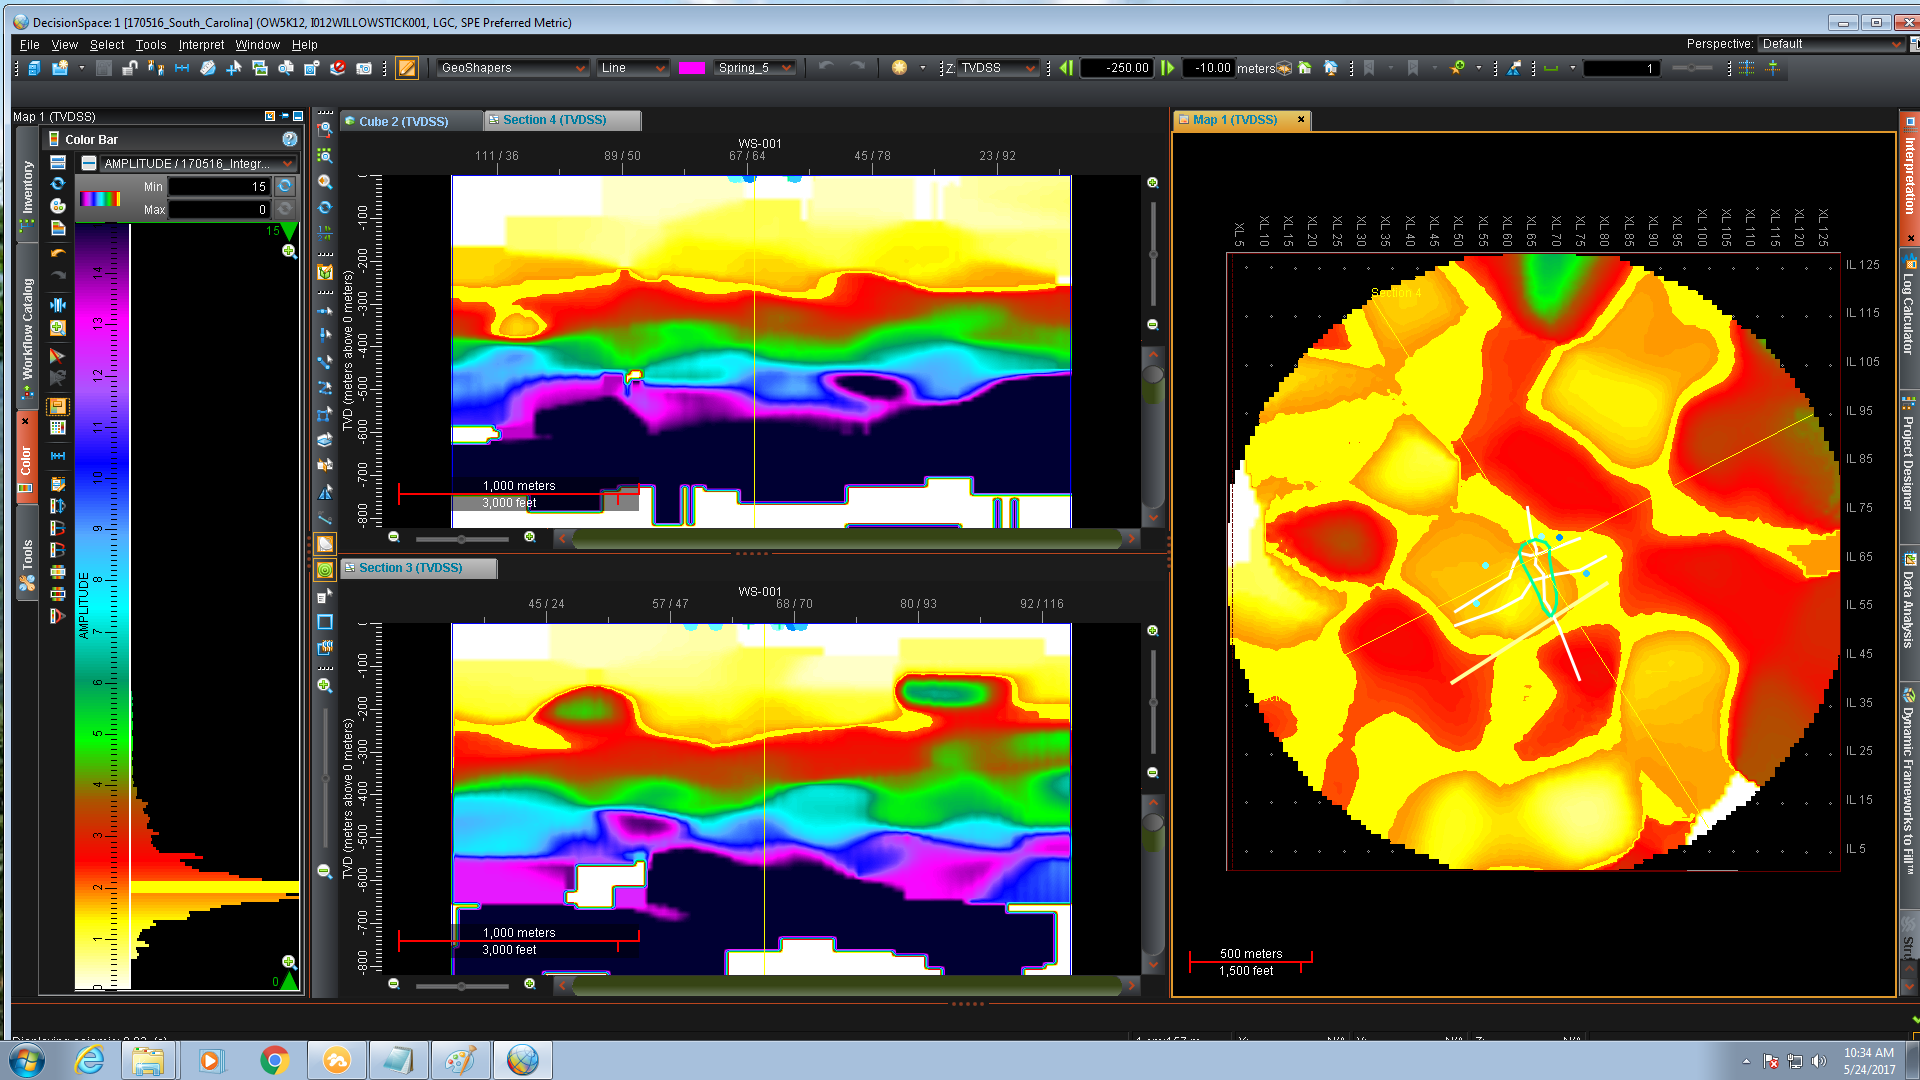
Data Resistivity Cross-Sections SW of Center | Interpretation Cross-Sections of SW Center |
‌HydroSource Integrated Fault Interpretation | Animation Integrated Interpretation |
Interpretation over Amplitude Extraction | Interpretation and 5 Horizontal-Slices |
Resistivity Probes 6 HydroSource Favorable Zones | 4 Best Locations with Fault Maps, Cross-Sections |
Rock Properties, Day-of-Year, Energy Sections | -/+ Energy, Frequency, Moon Local Longitude |
![](Hildale_31_Moon-Phase_Number-Sensors_Peak-Current-Absolute_and_Negative_Cross-Sections.png) | ![](Hildale_32_Peak-Current_Peak-to-Zero_Rise-Rate_Rise-Time_Cross-Sections.png) |
![](Hildale_33_Sun-Local-Longitude_Symmetry_Tidal-Gravity_Tide_Cross-Sections.png) | ![](Hildale_34_Tide-Gradient_Total-Wavelet-Time_Cross-Sections.png) |
![](Hildale_35_Shallow_Integrated.png) | ![](Hildale_36_Shallow_Independent.png) |
![](Hildale_37_Shallow_Both.png) | ![](Hildale_38_Upper_Middle_Integrated.png) |
![](Hildale_39_Upper_Middle_Independent.png) | ![](Hildale_40_Upper_Middle_Both.png) |
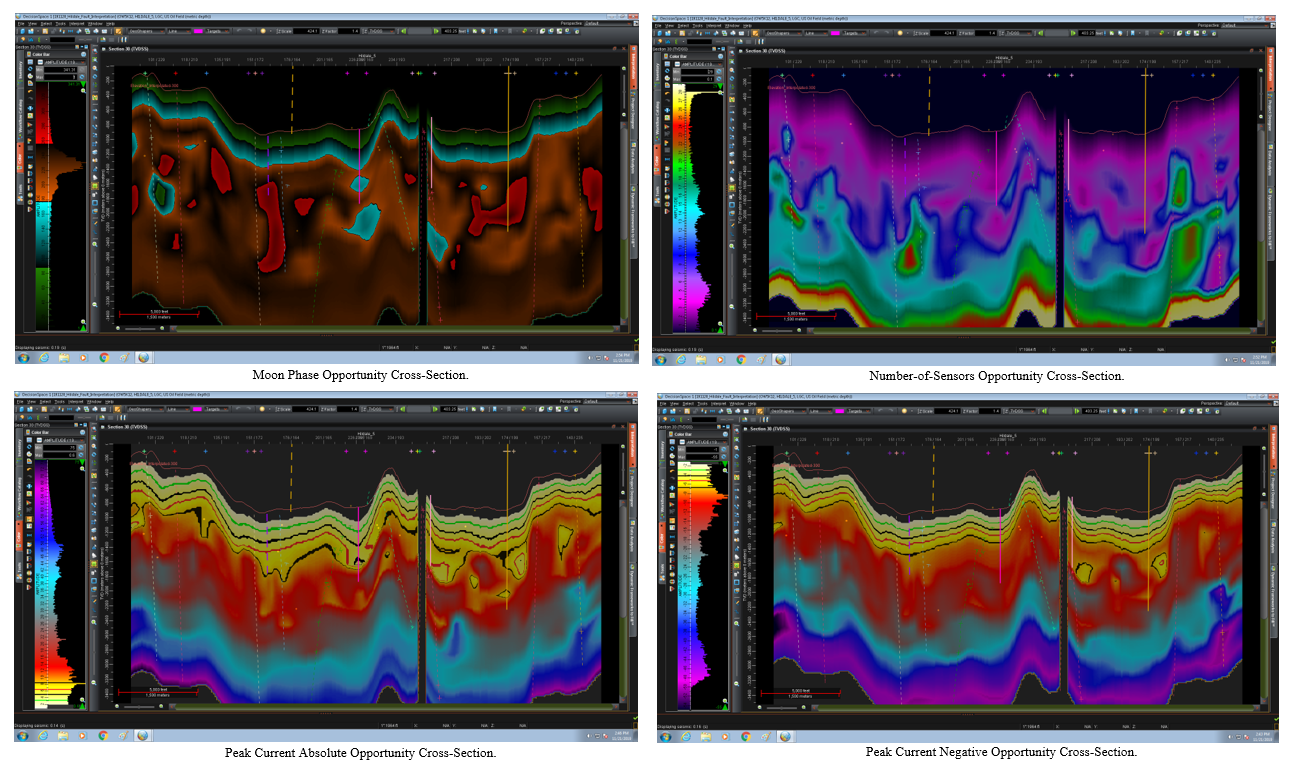
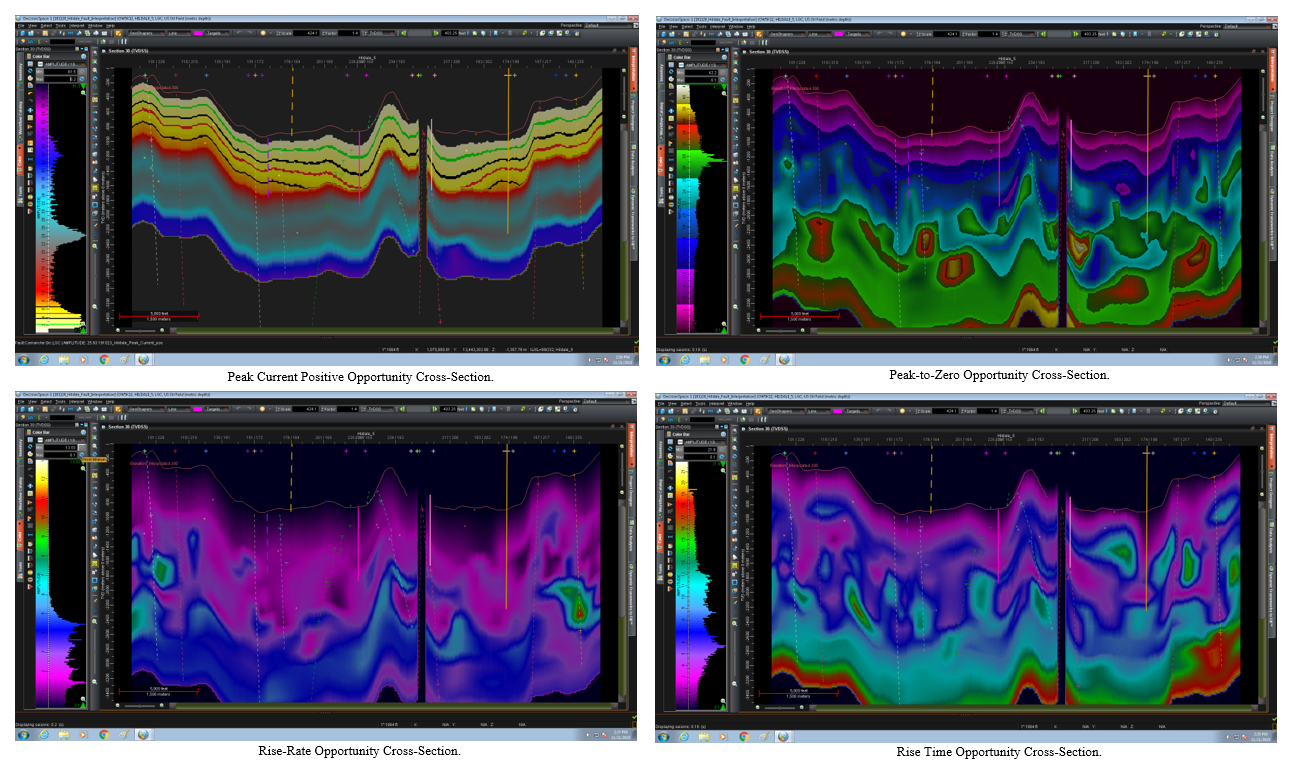
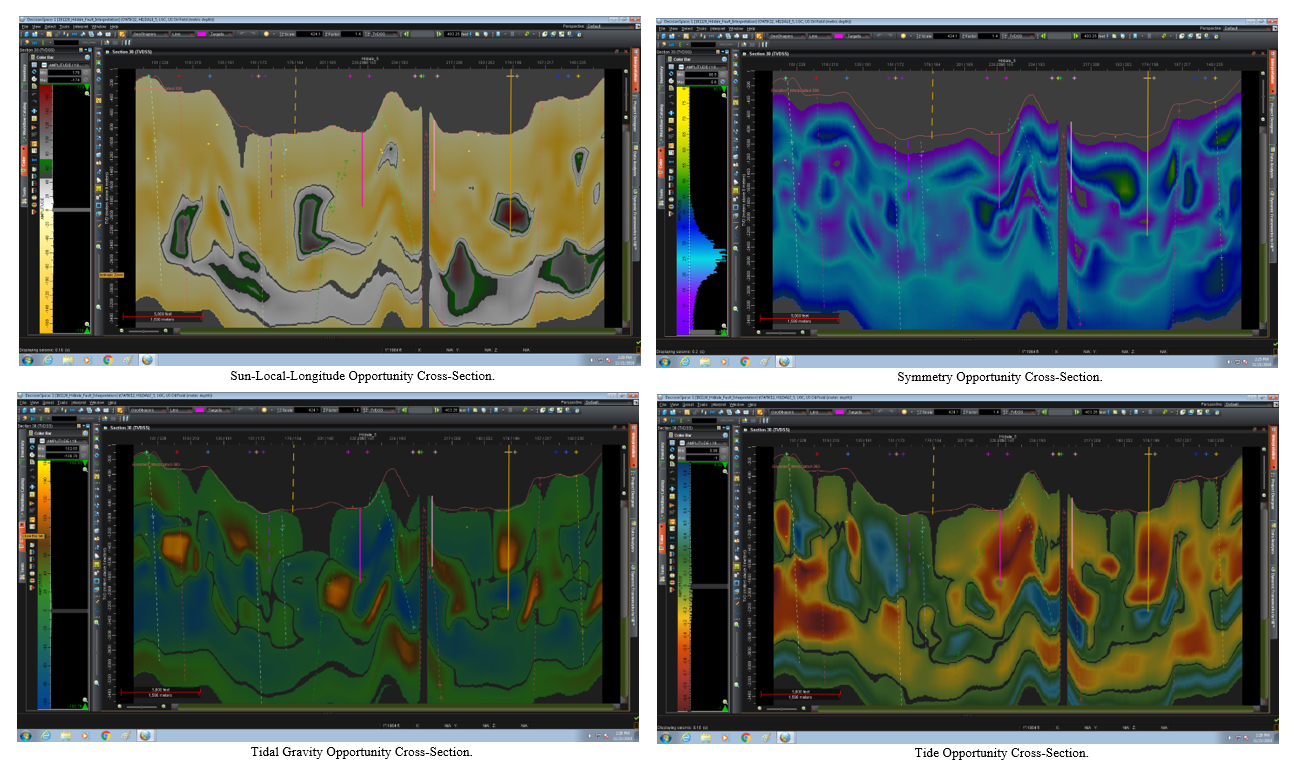
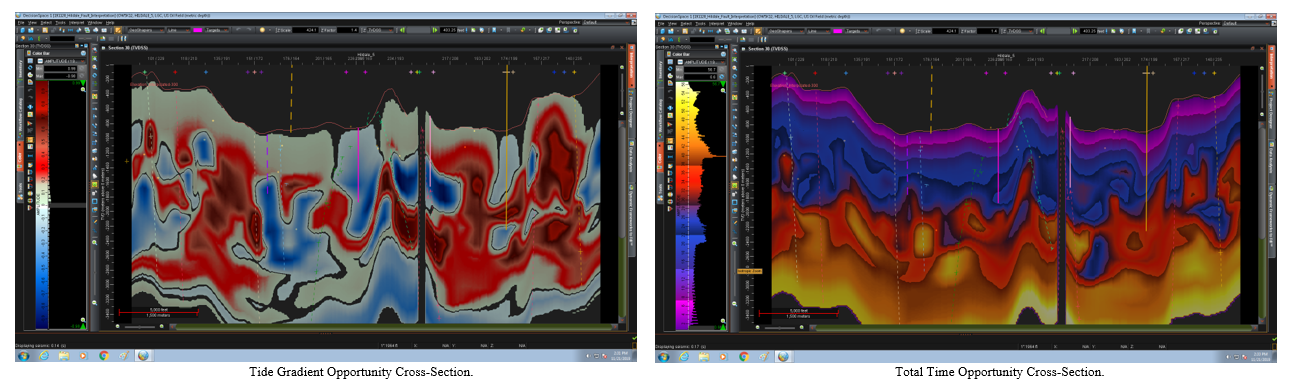
Moon Phase, # Sensors, PC Abs & Neg | PC Pos, P2Z, Rate-of-R-T, & R-T Sections |
Sun Local Long, Symmetry, Tidal Gravity, & Tide | Tide Gradient & Total Wavelet Time Sections |
Shallow Integrated Intepretation | Shallow Independent Interpretation |
Shallow Both Interpretations | Upper Middle Integrated Intepretation |
Upper Middle Independent Interpretation | Upper Middle Both Interpretations |
![](Hildale_41_Lower_Middle_Integrated.png) | ![](Hildale_42_Lower_Middle_Independent.png) |
![](Hildale_43_Lower_Middle_Both.png) | ![](Hildale_44_Deep_Integrated.png) |
![](Hildale_45_Deep_Independent.png) | ![](Hildale_46_Deep_Both.png) |
![](Hildale_47_IL020_XL020.png) | ![](Hildale_48_IL030_XL030.png) |
![](Hildale_49_IL040_XL040.png) | ![](Hildale_50_IL050_XL050.png) |
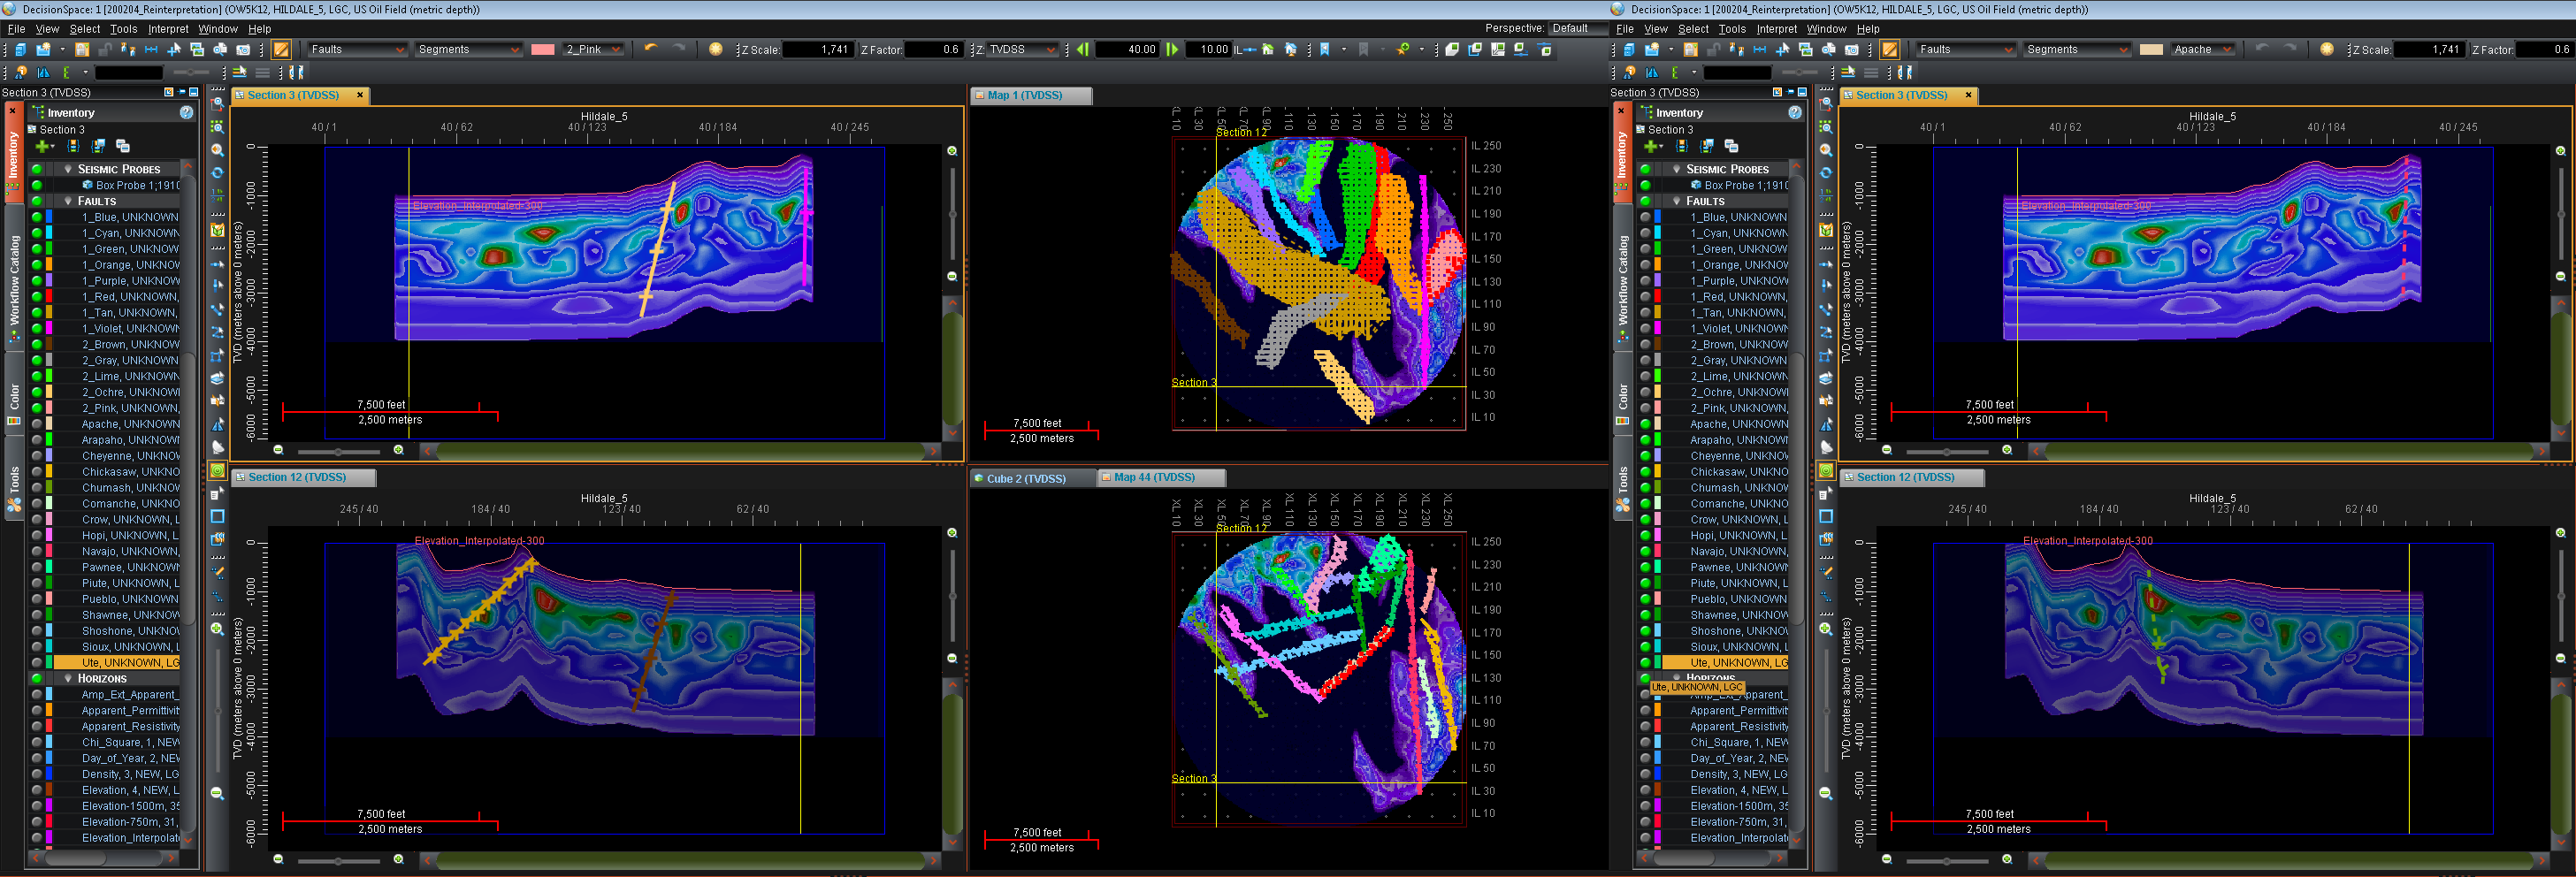
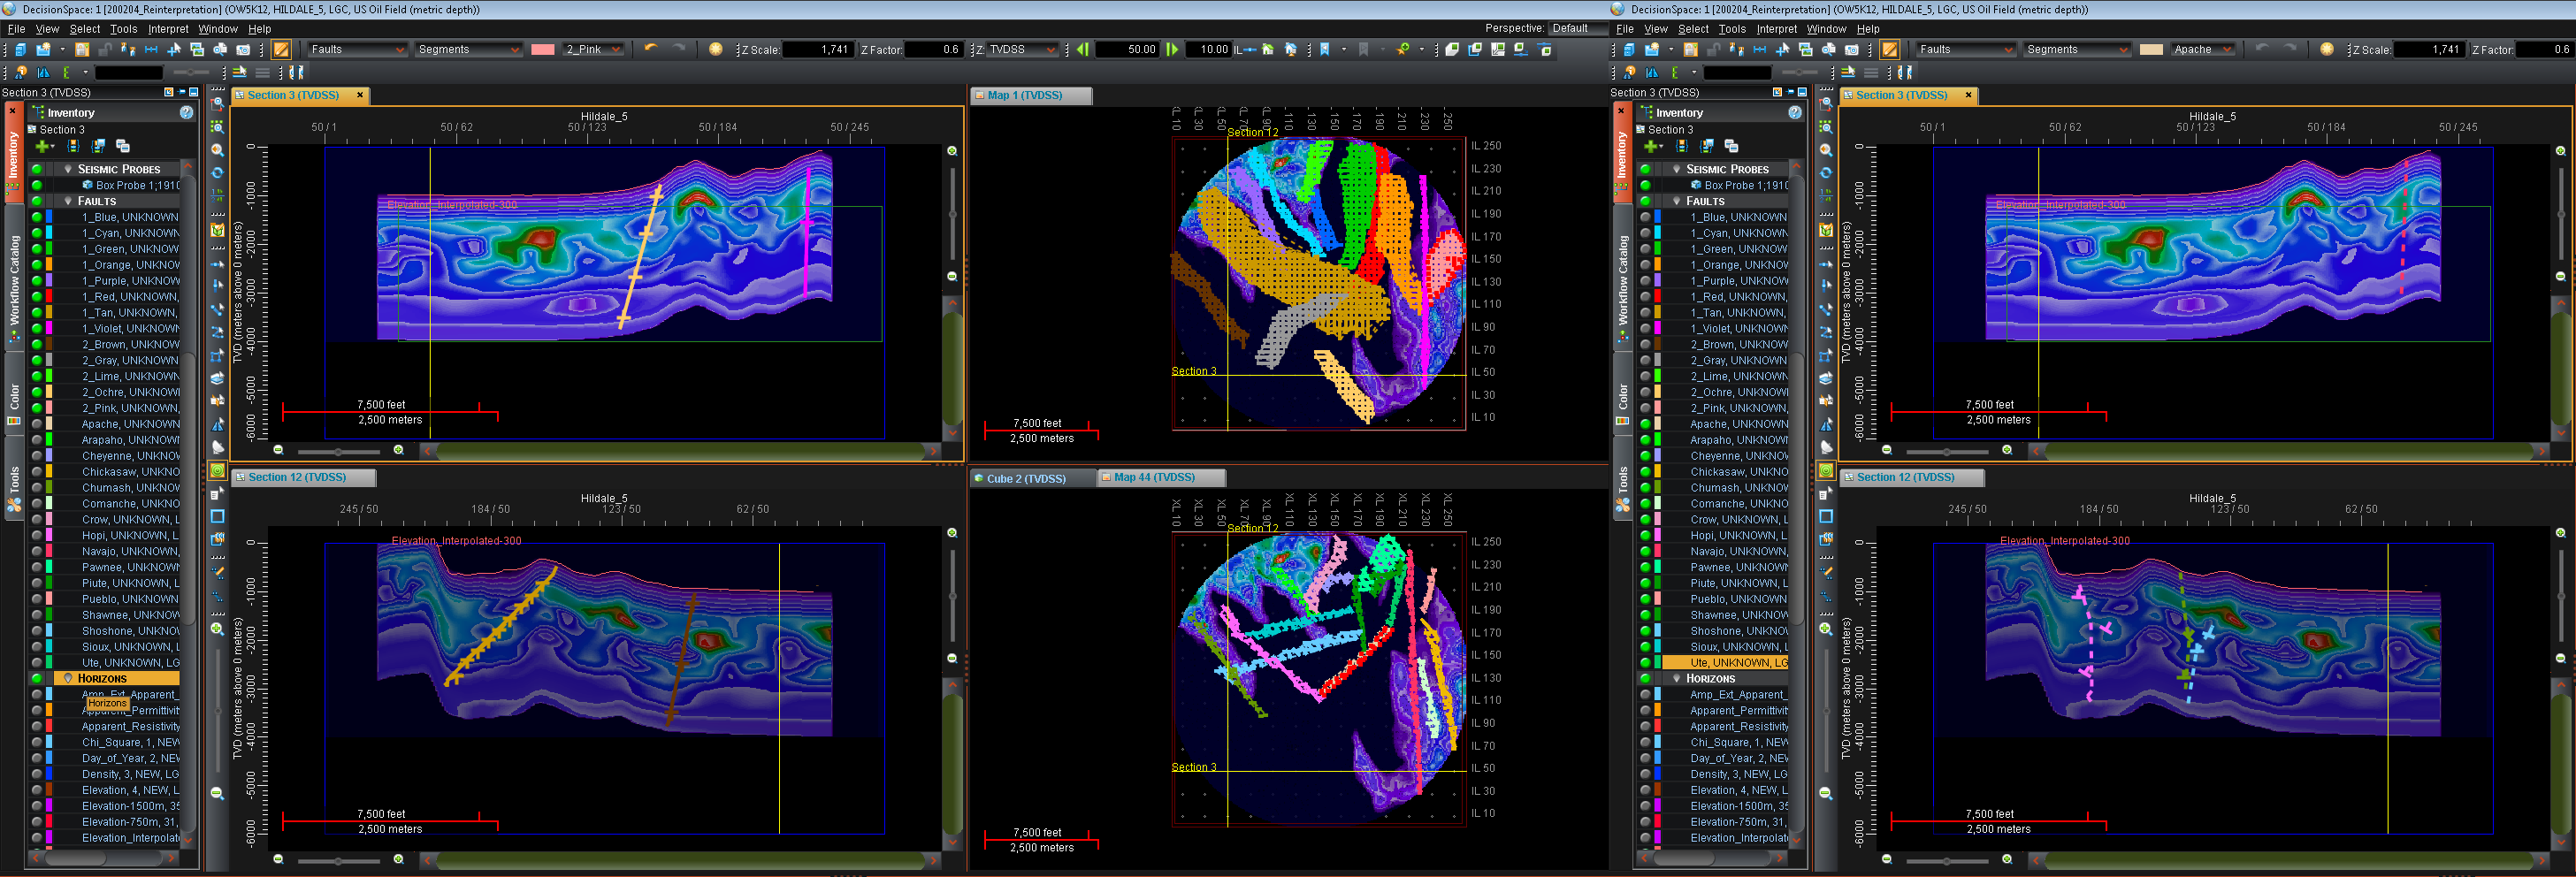
Lower Middle Integrated Intepretation | Lower Middle Independent Interpretation |
Lower Middle Both Interpretations | Deep Integrated with HydroSource Intepretation |
Deep Independent Comparison Interpretation | Deep Both Interpretations Together |
Top Independent, Base Ingegrated, IL-20 XL-20 | Top Independent, Base Ingegrated, IL-30 XL-30 |
Top Independent, Base Ingegrated, IL-40 XL-40 | Top Independent, Base Ingegrated, IL-50 XL-50 |
![](Hildale_51.png) | ![](Hildale_52_IL070_XL070.png) |
![](Hildale_53_IL080_XL080.png) | ![](Hildale_54_IL090_XL090.png) |
![](Hildale_55_IL100_XL100.png) | ![](Hildale_56_IL110_XL110.png) |
![](Hildale_57_IL120_XL120.png) | ![](Hildale_58_IL130_XL130.png) |
![](Hildale_59_IL140_XL140.png) | ![](Hildale_60_IL150_XL150.png) |
Top Independent, Base Ingegrated, IL-60 XL-60 | Top Independent, Base Ingegrated, IL-70 XL-70 |
Top Independent, Base Ingegrated, IL-80 XL-80 | Top Independent, Base Ingegrated, IL-90 XL-90 |
Top Independent, Base Ingegrated, IL-100 XL-100 | Top Independent, Base Ingegrated, IL-110 XL-110 |
Top Independent, Base Ingegrated, IL-120 XL-120 | Top Independent, Base Ingegrated, IL-130 XL-130 |
Top Independent, Base Ingegrated, IL-140 XL-140 | Top Independent, Base Ingegrated, IL-150 XL-150 |
![](Hildale_61_IL160_XL160.png) | ![](Hildale_62_IL170_XL170.png) |
![](Hildale_63_IL180_XL180.png) | ![](Hildale_64_IL190_XL190.png) |
![](Hildale_65_IL200_XL200.png) | ![](Hildale_66_IL210_XL210.png) |
![](Hildale_67_IL220_XL220.png) | ![](Hildale_68_IL230_XL230.png) |
![](Hildale_69_IL240_XL240.png) | ![](Hildale_70_IL250_XL250.png) |
Top Independent, Base Ingegrated, IL-160 XL-160 | Top Independent, Base Ingegrated, IL-170 XL-170 |
Top Independent, Base Ingegrated, IL-180 XL-180 | Top Independent, Base Ingegrated, IL-190 XL-190 |
Top Independent, Base Ingegrated, IL-200 XL-200 | Top Independent, Base Ingegrated, IL-210 XL-210 |
Top Independent, Base Ingegrated, IL-220 XL-220 | Top Independent, Base Ingegrated, IL-230 XL-230 |
Top Independent, Base Ingegrated, IL-240 XL-240 | Top Independent, Base Ingegrated, IL-250 XL-250 |
![](SC_01_Lightning-Strikes_Topography.png) | ![](SC_02_computed_Attributes_170627.png) |
![](SC_03_Lightning_Attribute_Map_Thumbnails.png) | ![](SC_04_Lightning_Attribute_Volume_Section_Thumbnails.png) |
![](SC_05_Spike.png) | ![](SC_06_Depth.png) |
![](SC_07_Density_depth-slice_on_sections.png) |
![](SC_09_Day-of-Year.png) | ![](SC_10_Energy.png) | ![](Lightning_Near_Large_Powerlines_in_Farmland_iStock_000009564317_Medium.jpg) |
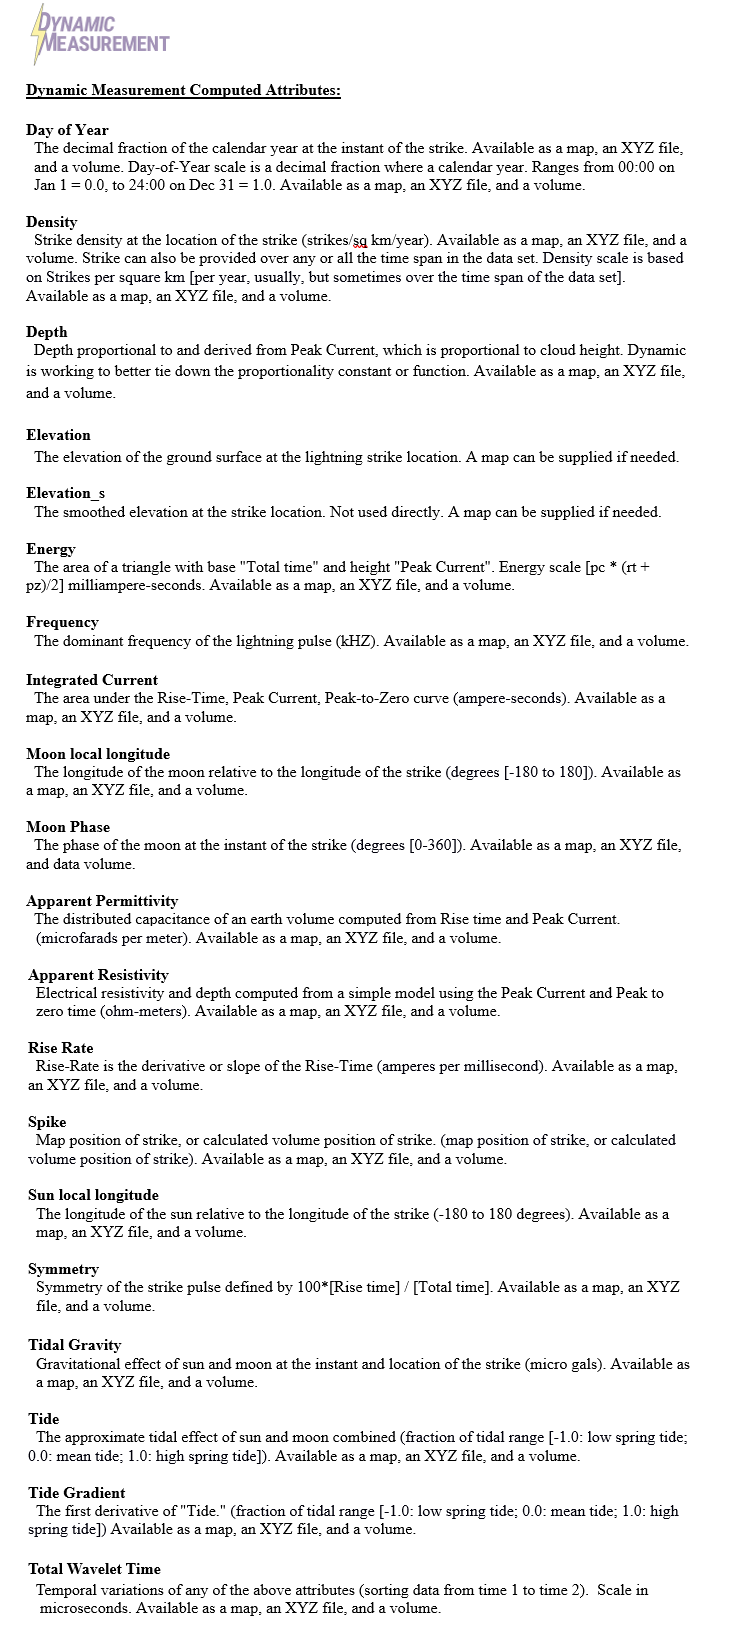
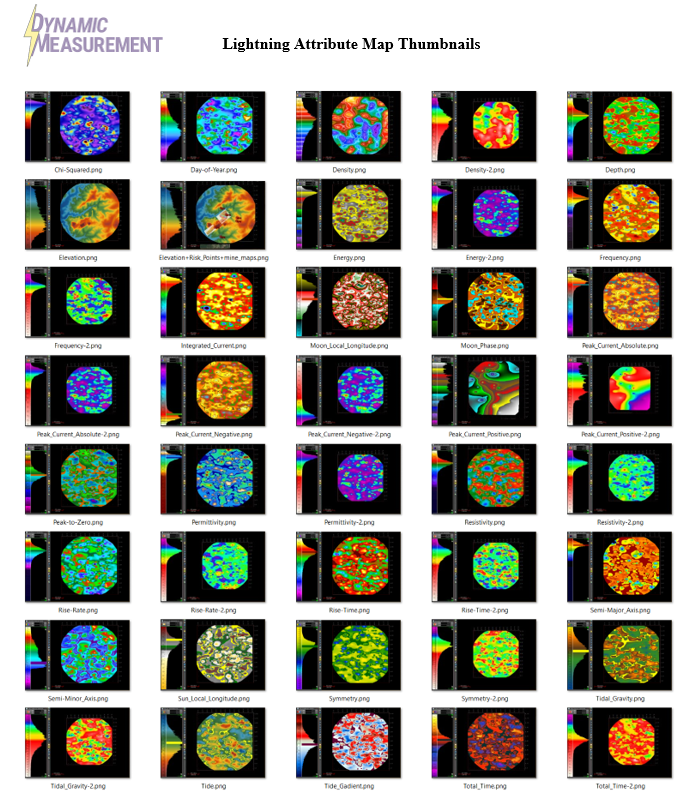
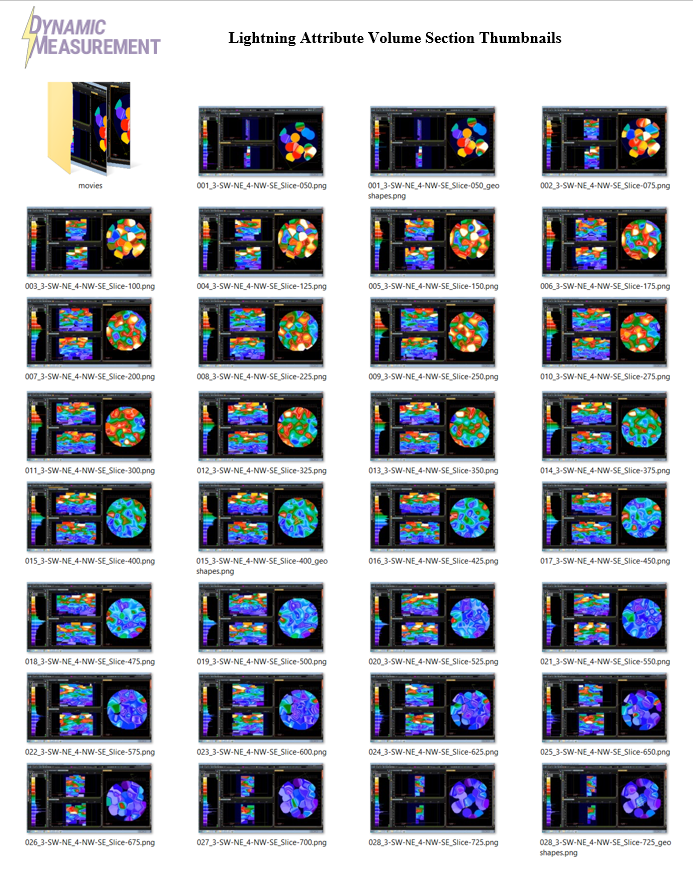
Lightning Strikes over Topography | Computed Attributes |
Lightning Map Thumbnails | Attribute Section Thumbnails |
Spike Attribure Sections | Depth Sections |
Density Sections | Day-of-Year Sections |
Energy Attribute Sections | Background Lightning Photo |
![](SC_11_Frequency.png) | ![](SC_12_Integrated_Current.png) |
![](SC_13_Moon_Local_Longitude.png) | ![](SC_14_Moon_Phase.png) |
![](SC_15_Peak_Current.png) | ![](SC_16_Peak_Current_Negative.png) |
![](SC_17_Peak_Current_Positive.png) | ![](SC_18_Peak-to-Zero.png) |
![](SC_19_Rise-Rate.png) | ![](SC_20_Rise-Time.png) |
Frequency Sections | Integrated Current Sections |
Moon Local Longitude | Moon Phase Sections |
Average Peak Current Sections | Negative Peak Current Sections |
Positive Peak Current Sections | Peak-to-Zero Sections |
Rate-of-Rise-Time Sections | Rise-Time Attribute Sections |
![](SC_21_Semi-Major_Axis.png) | ![](SC_22_Semi-Minor_Axis.png) |
![](SC_23_Sun_Local_Longitude.png) | ![](SC_24_Symmetry.png) |
![](SC_25_Tidal_Gravity.png) | ![](SC_26_Tide.png) |
![](SC_27_Tide_Gradient.png) | ![](SC_28_Total_Time.png) |
![](SC_29_Permittivity.png) | ![](SC_30_Resistivity.png) |
Semi-Major Axis Sections | Semi-Minor Axis Sections |
Sun Local Longitude | Wavelet Symmetry |
Tidal Gravity Sections | Strokes f(Tide) Sections |
Tide Gradient Sections | Total Wavelet Time Sections |
Permittivity Sections | Resistivity Sections |
![](SC_31_Lightning_Resistivity_Sections.png) | ![](SC_32_Resistivity_000_geoshapes.png) |
![](SC_33_Resistivity-100.png) | ![](SC_34_Resistivity-150.png) |
![](SC_35_Resistivity-200.png) | ![](SC_36_Resistivity-250.png) |
![](SC_37_Resistivity-300.png) | ![](SC_38_Resistivity-350.png) |
![](SC_39_Resistivity-450.png) | ![](SC_40_Resistivity-500.png) |
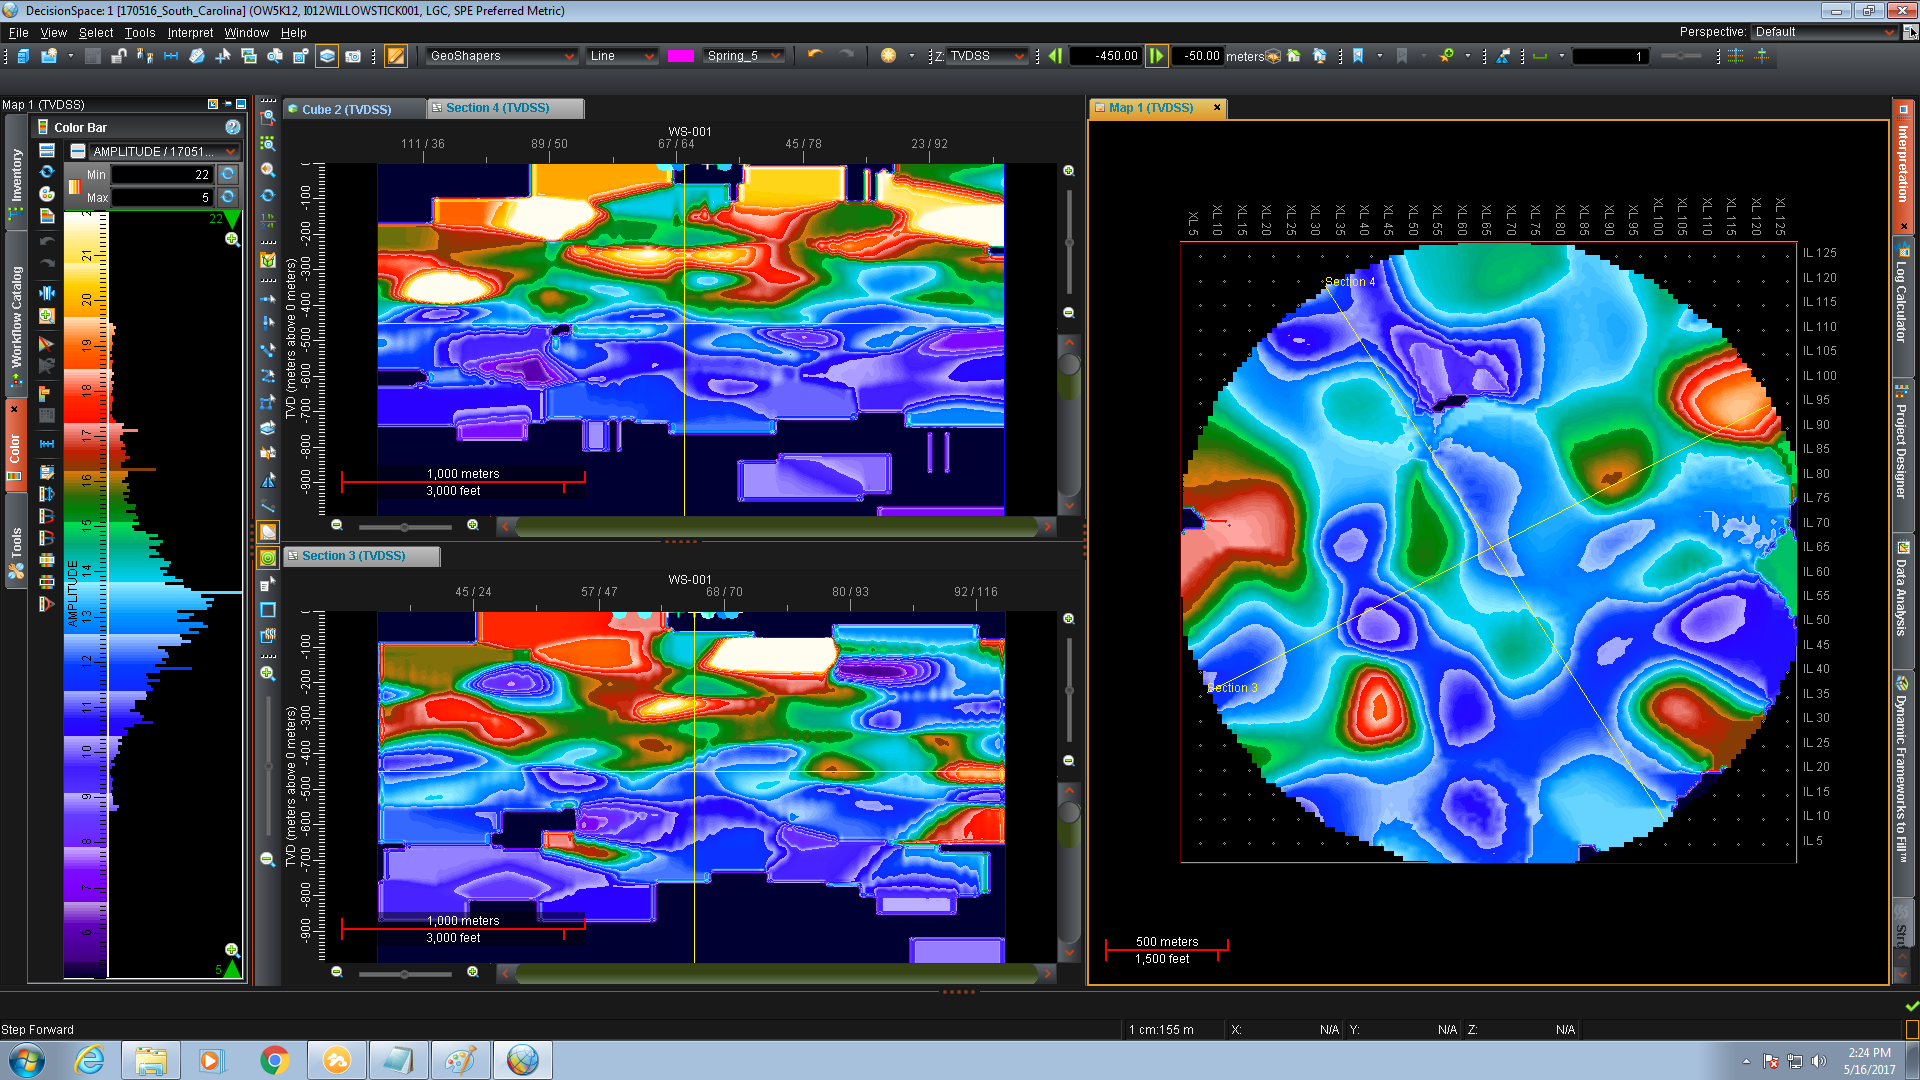
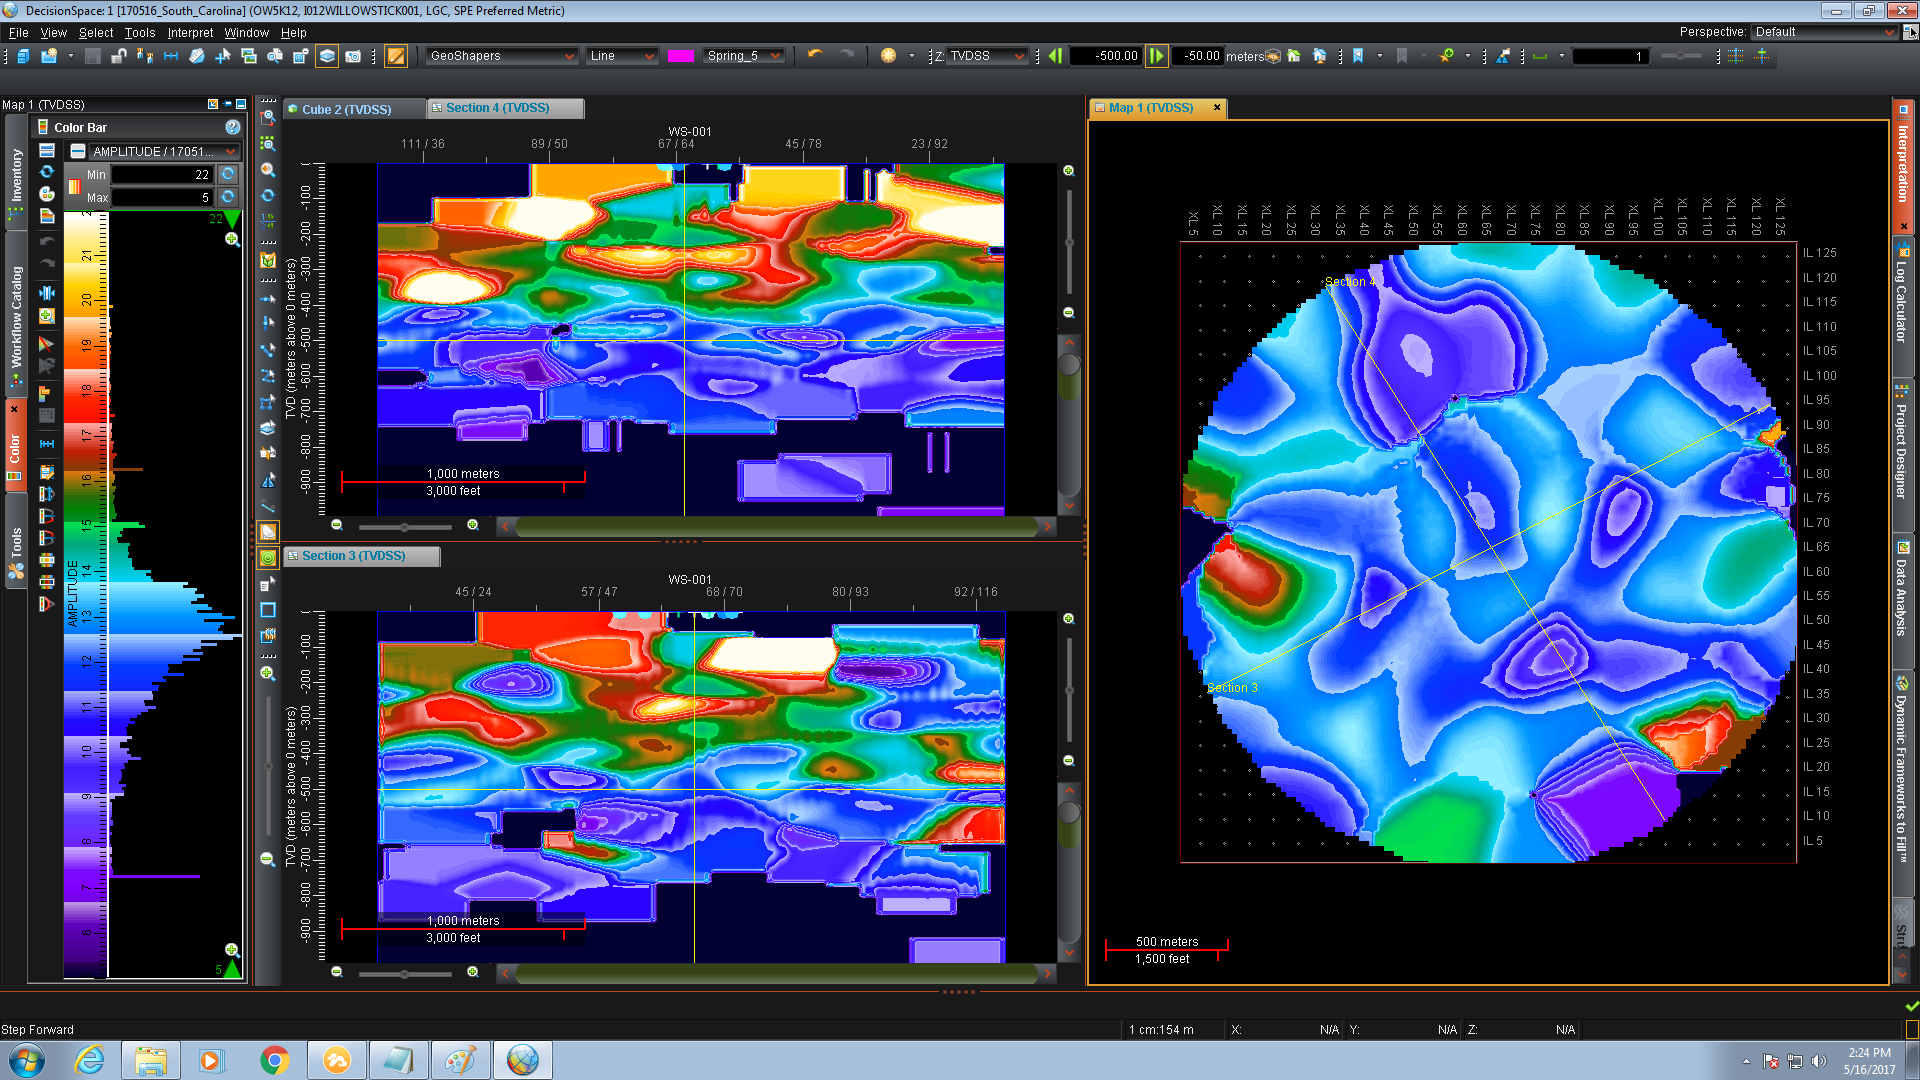
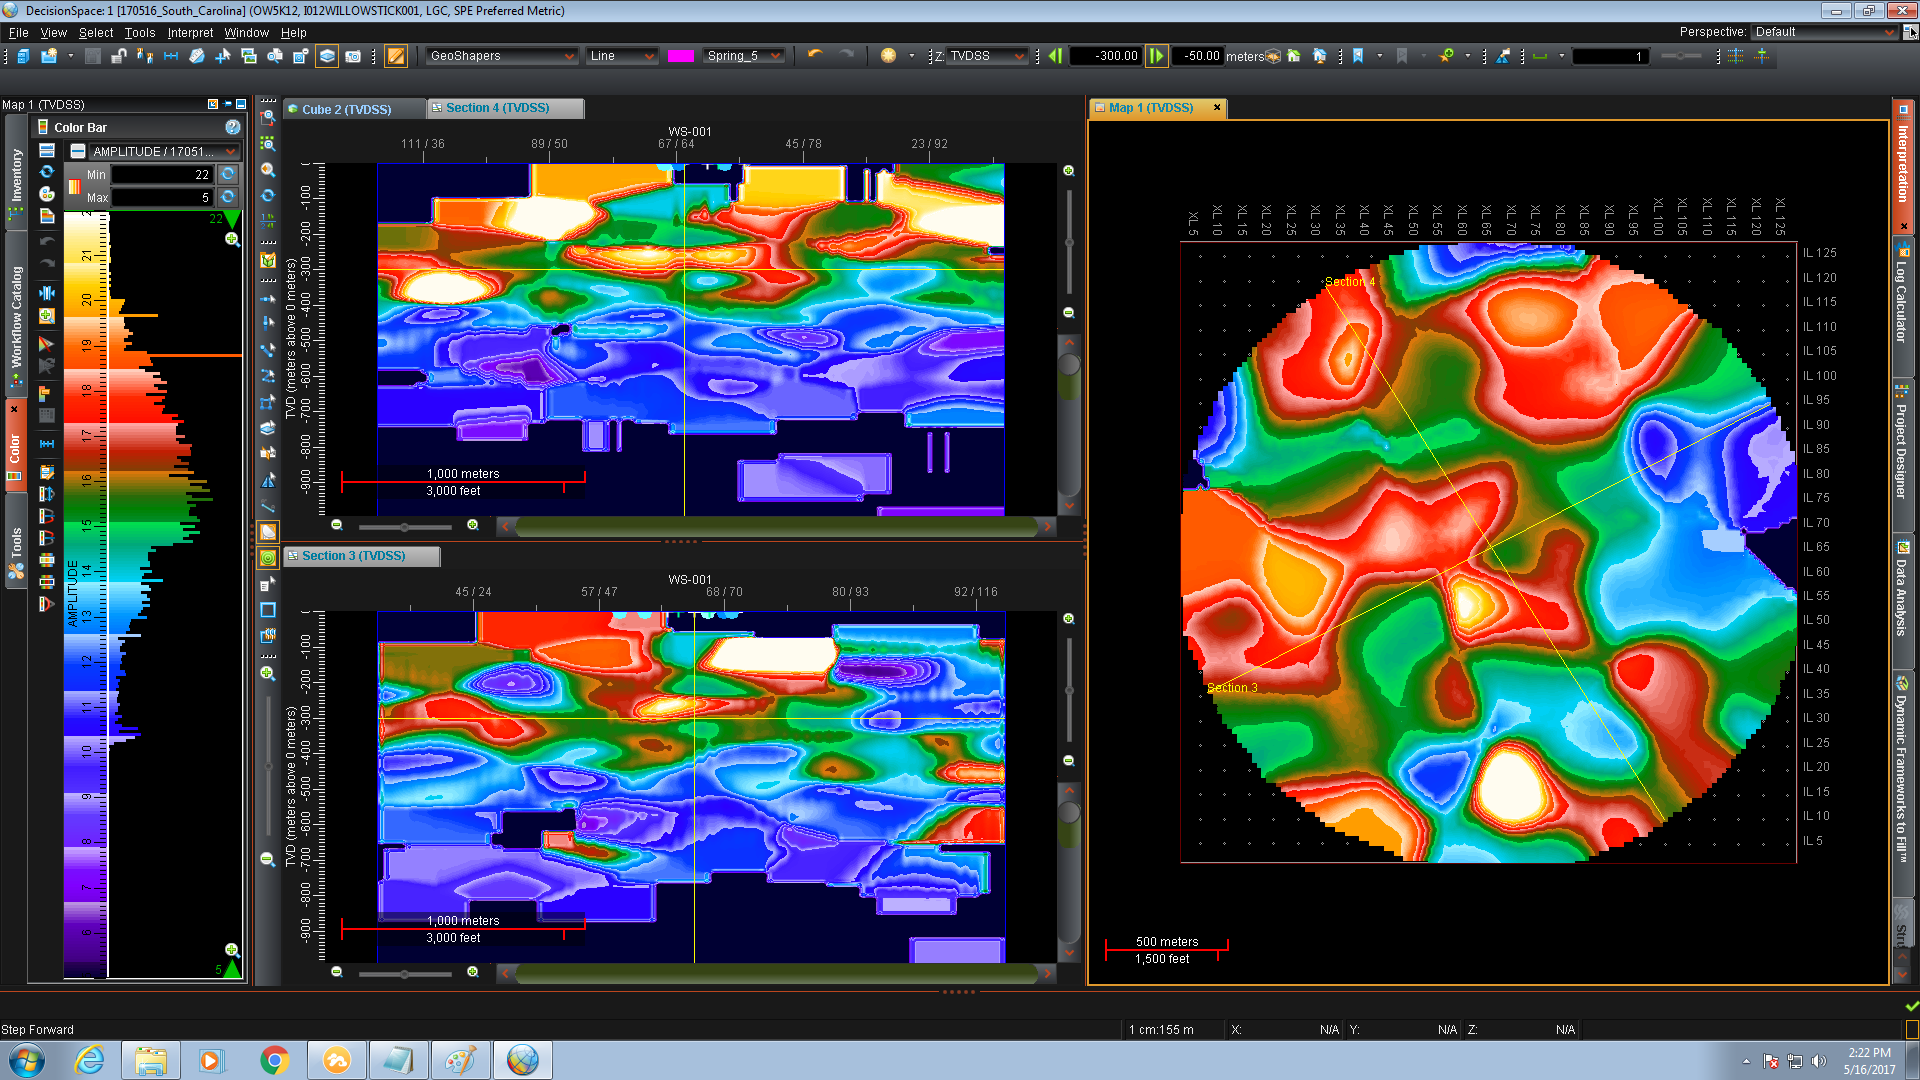
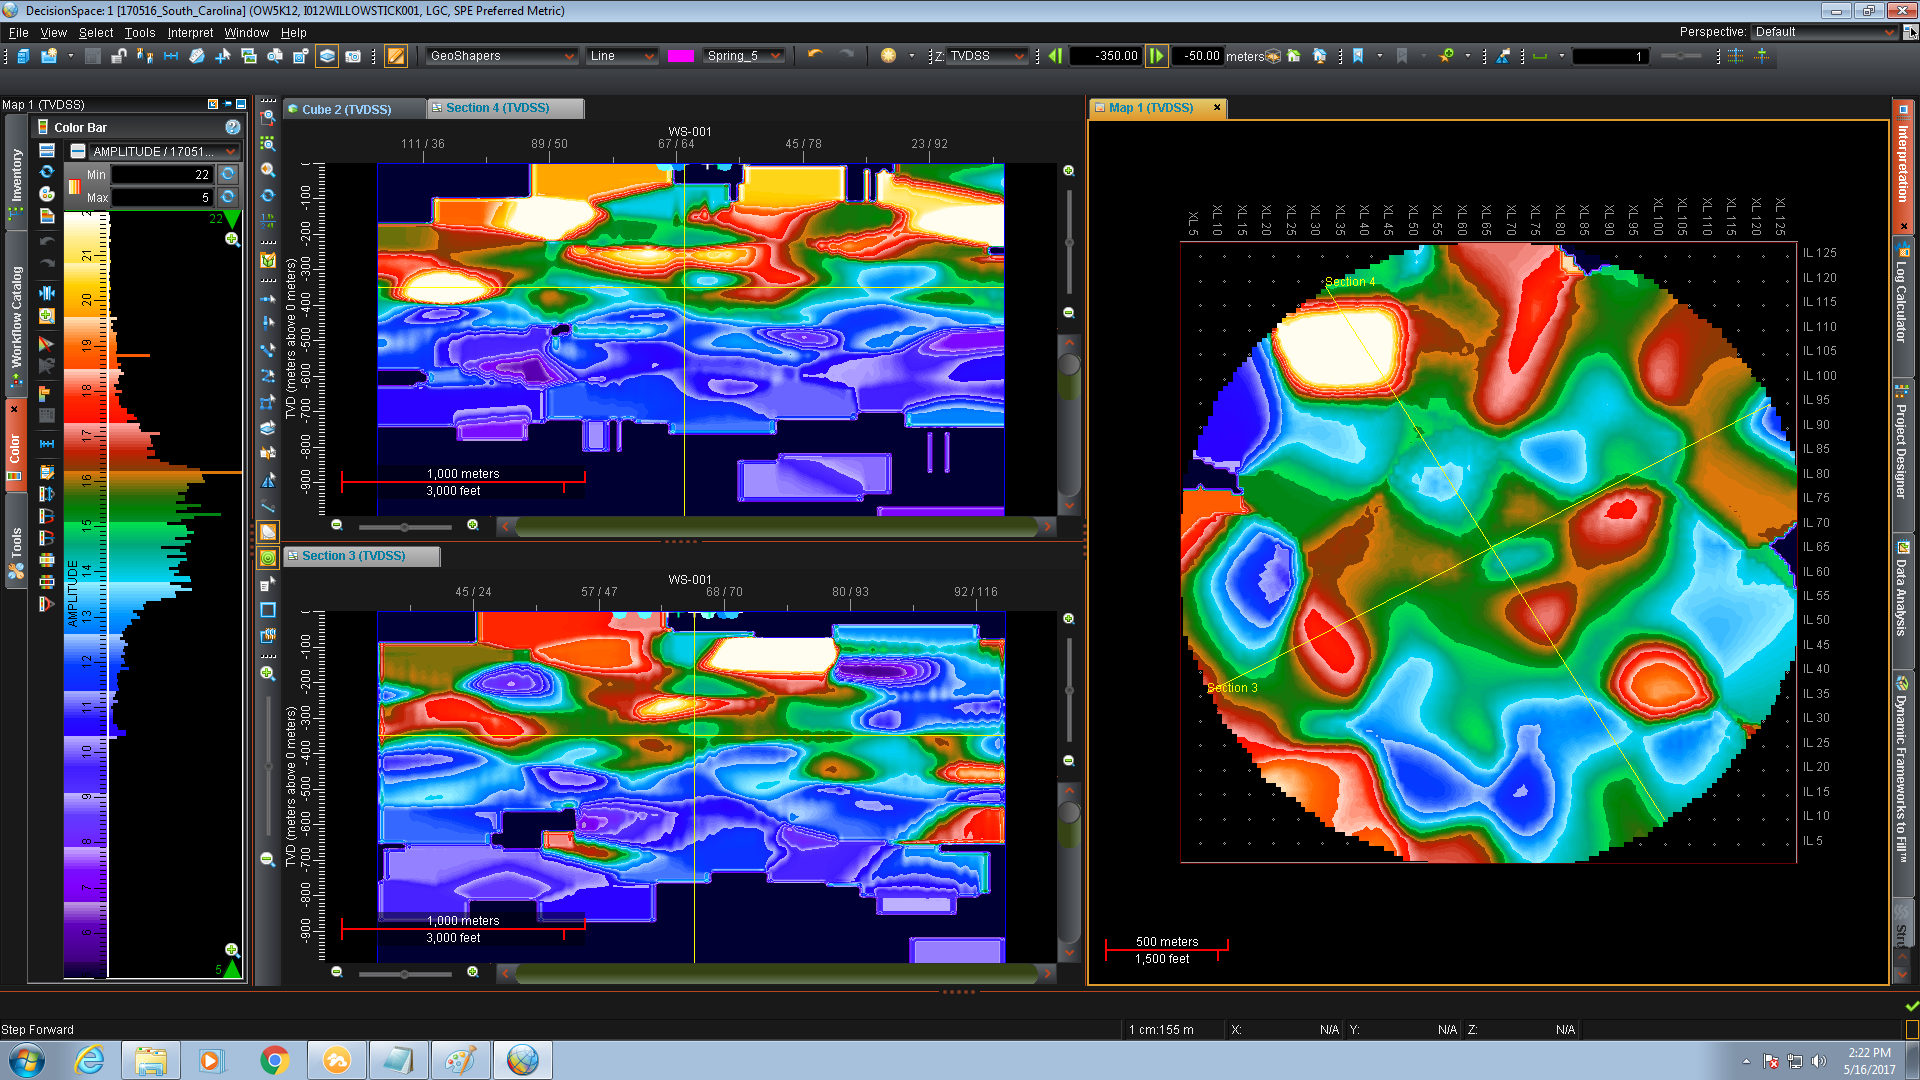
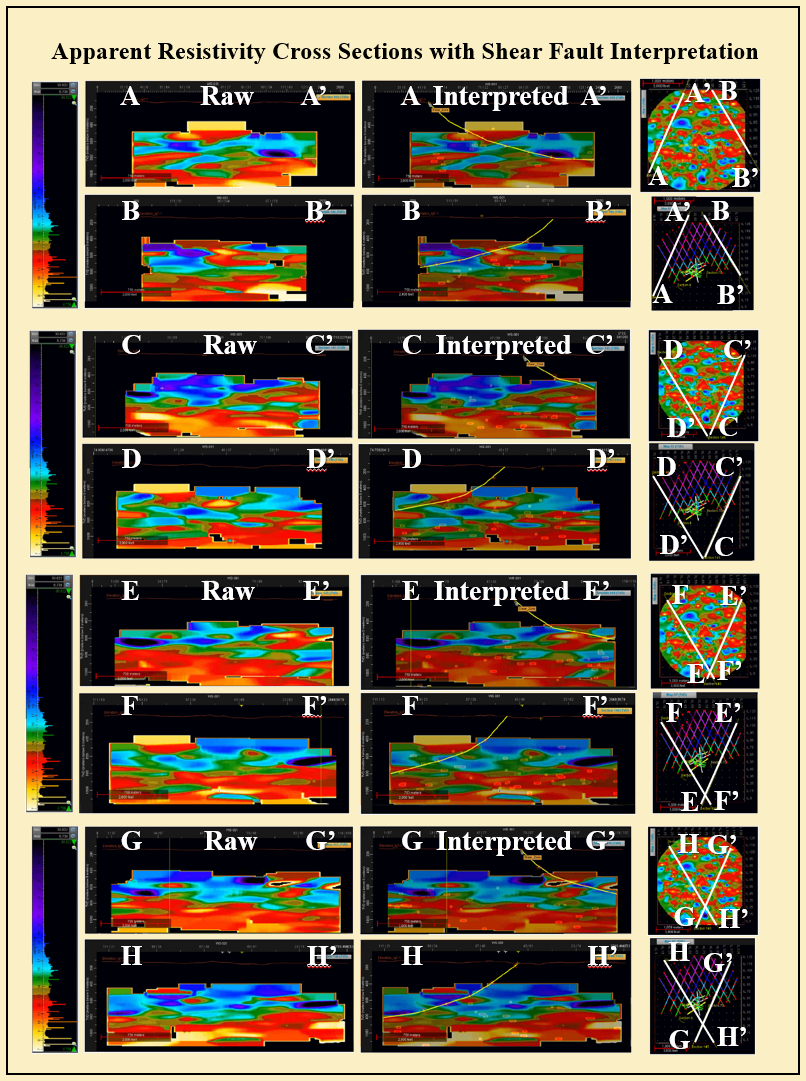
Resistivity Shear Interpretation | 000 Apparent Resistivity "Slice" |
-100 Apparent Resistivity Slice | -150 Apparent Resistivity Slice |
-200 Apparent Resistivity Slice | -250 Apparent Resistivity Slice |
-300 Apparent Resistivity Slice | -350 Apparent Resistivity Slice |
-450 Apparent Resistivity Slice | -500 Apparent Resistivity Slice |
![](SC_41_Resistivity-550.png) | ![](SC_42_Resistivity-600.png) |
![](SC_43_Basement_Faulting_Canadian_Shield.png) | ![](SC_44_Possible_Faulting_4_Attributes.png) |
![](SC_45_Possible_Faulting_4_Attributes.png) | ![](SC_46_LB_Fault_Interpretation.png) |
![](SC_48_LB_Hi_&_Low_Resistivity_Anomalies.png) | ![](SC_47_Water_Flow_Interp_&_Comments.png) |
![](SC_49_LB_Water_Flow_Interp.png) | ![](SC_50_Resistivity_4_C_faults_red-orange_animation_cover.png) |
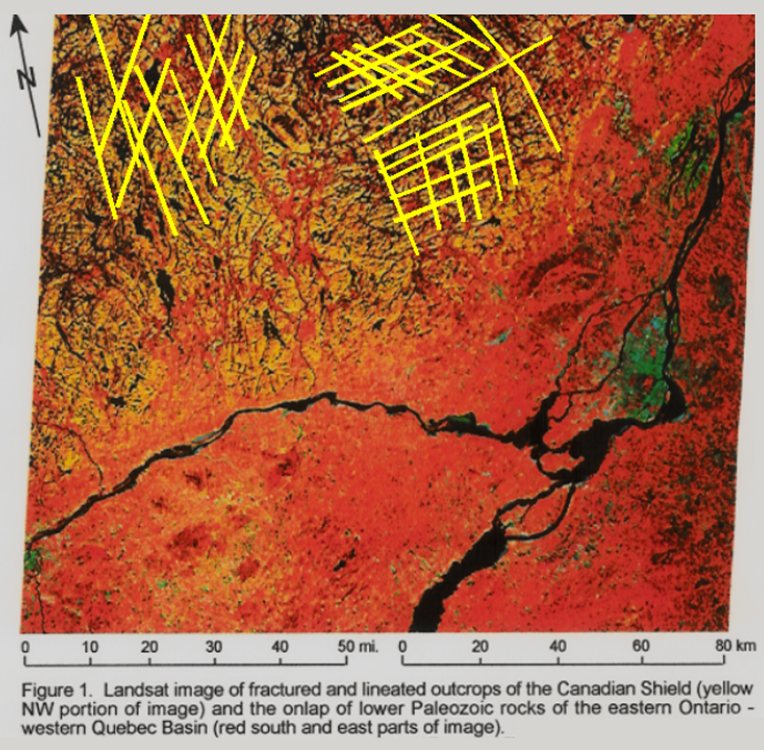
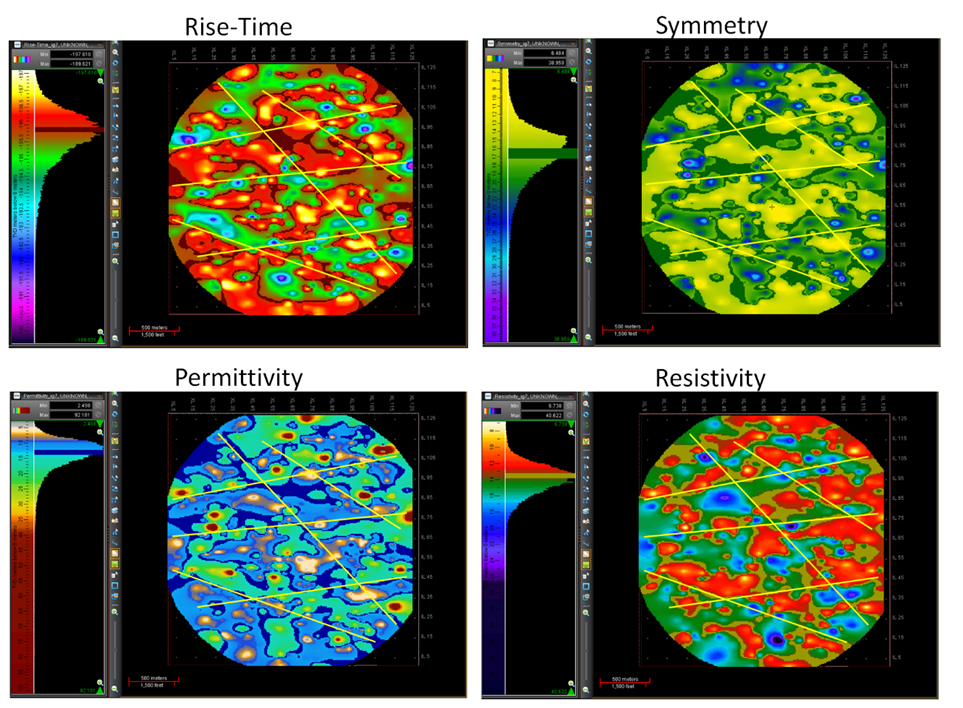
-550 Apparent Resistivity Slice | -600 Apparent Resistivity Slice |
Analog Faulting Canadian Shield | R-T, Symmetry, Rock Properties |
Elev, Tidal Grav & Grad, TT | LB Fault Interpretation |
LB Potential Water Flow Paths | LB 2 Low Resistivity Channels |
LB Water Flow Cartoon | Animation Barite Hills SPOTsm |
![](SC_51_Apparent_Resistivity_Shear_Fault_Interpretation.png) | ![](SC_52_Geology-Topgraphy_Fracture-Sets.png) |
![](SC_53_Geologic-Map_Block-Diagrams.png) | ![](SC_54_Geologic-Maps_over_Apparent-Resistivity-reversed-color.png) |
![](SC_55_Poster_Intro.png) | ![](SC_56_Proven_Industry_EM_Flow_Path_Detection.png) |
![](SC_57_Willowstick_Groundwater_Flow_Path.png) | ![](SC_58_Energy-Attribute-Outline_on_5-other-attributes.png) |
![](SC_59_Energy-Attribute-2-colors_Conventional_&_MODPATH_flow_paths_Willowstick.png) | ![](SC_60_Dynamic_Attributes_&_Flow_Path.png) |
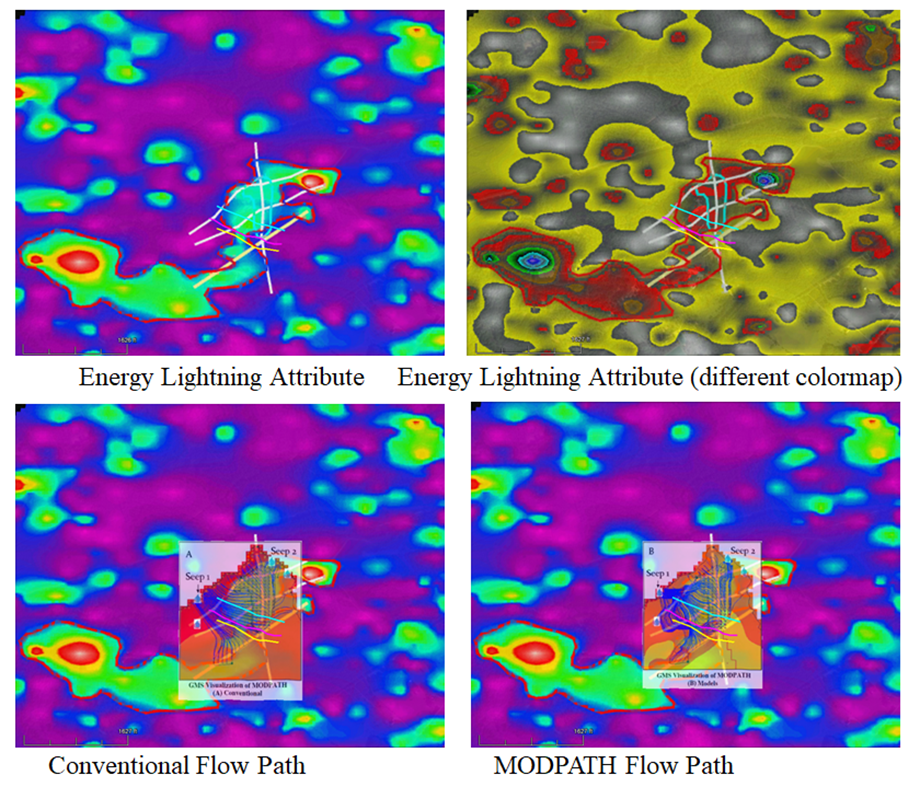
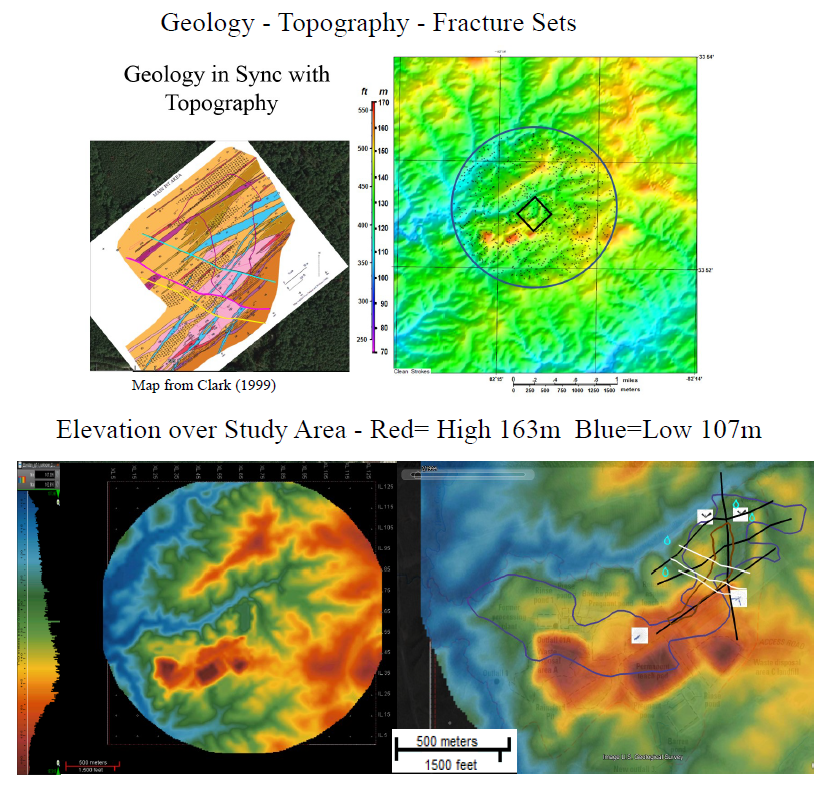
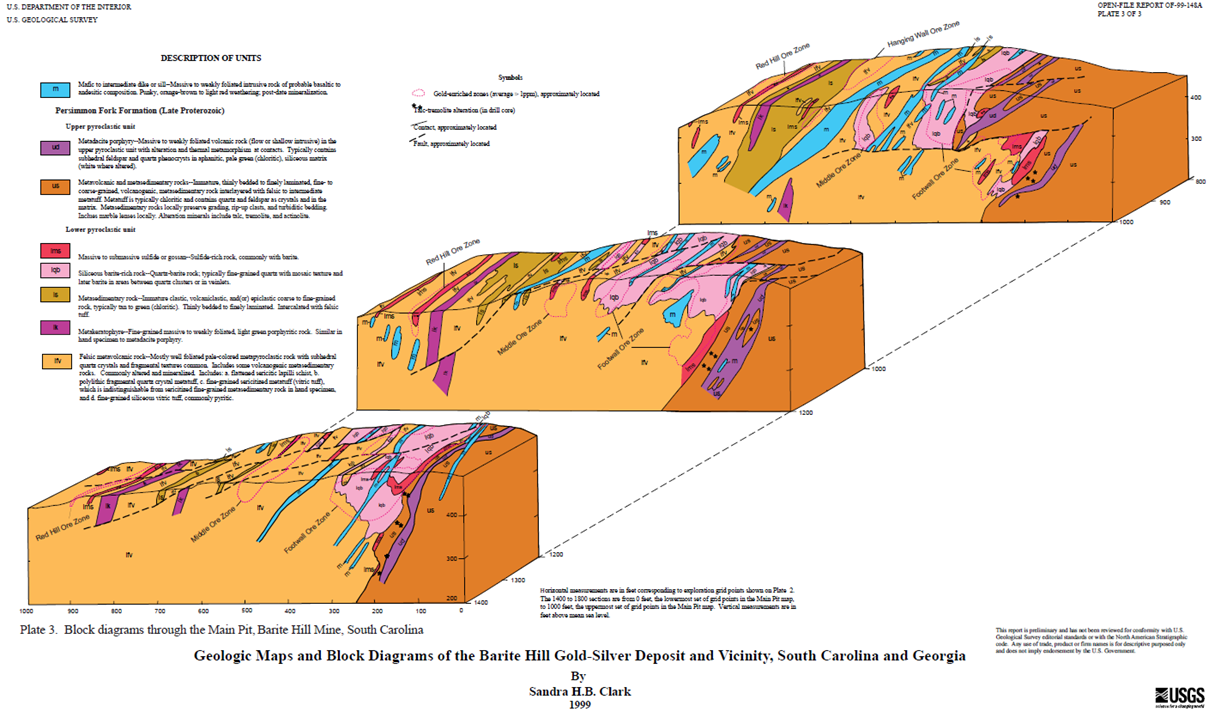
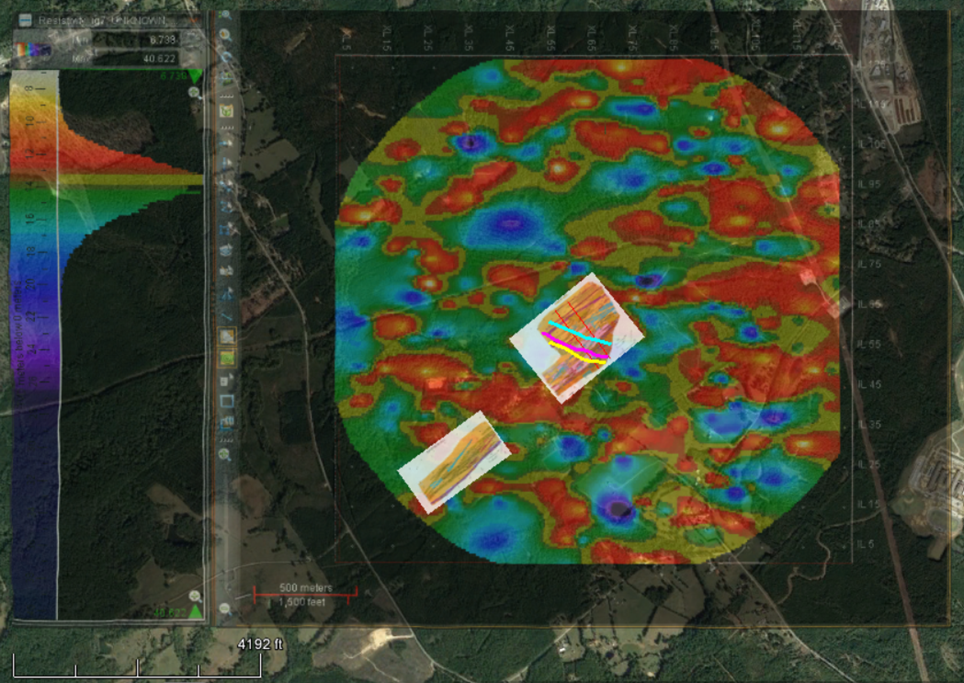
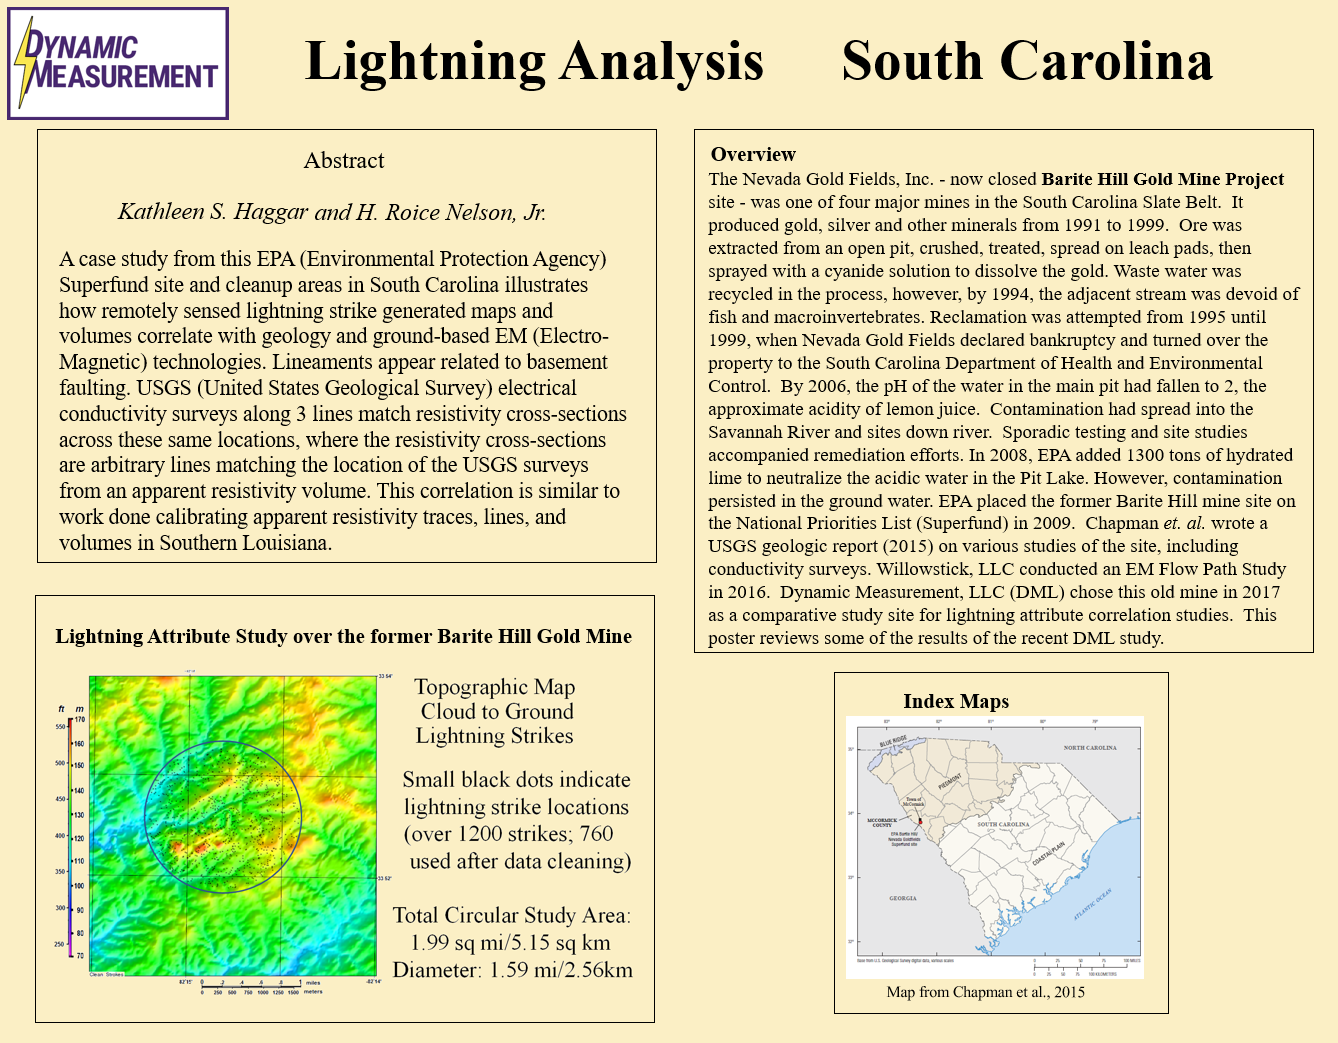
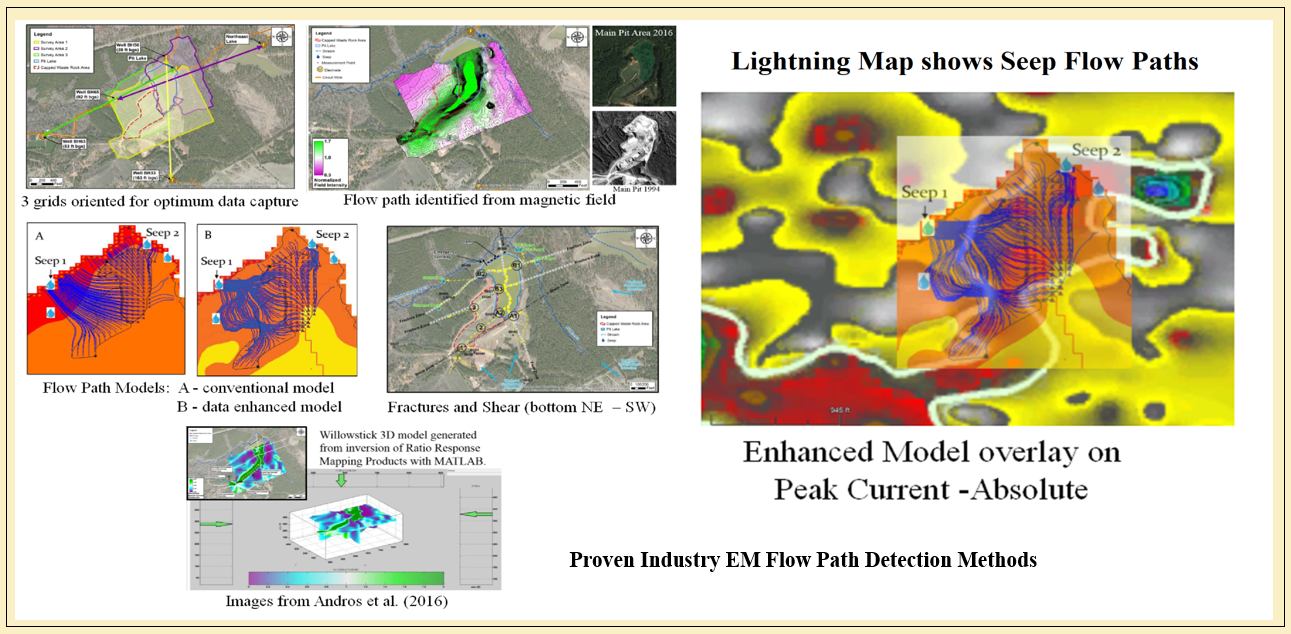
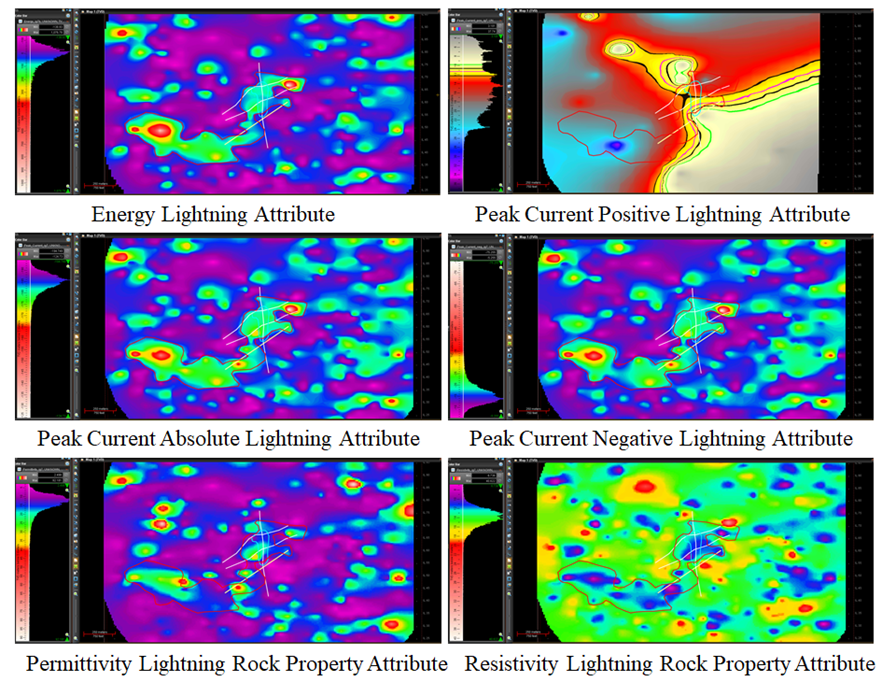
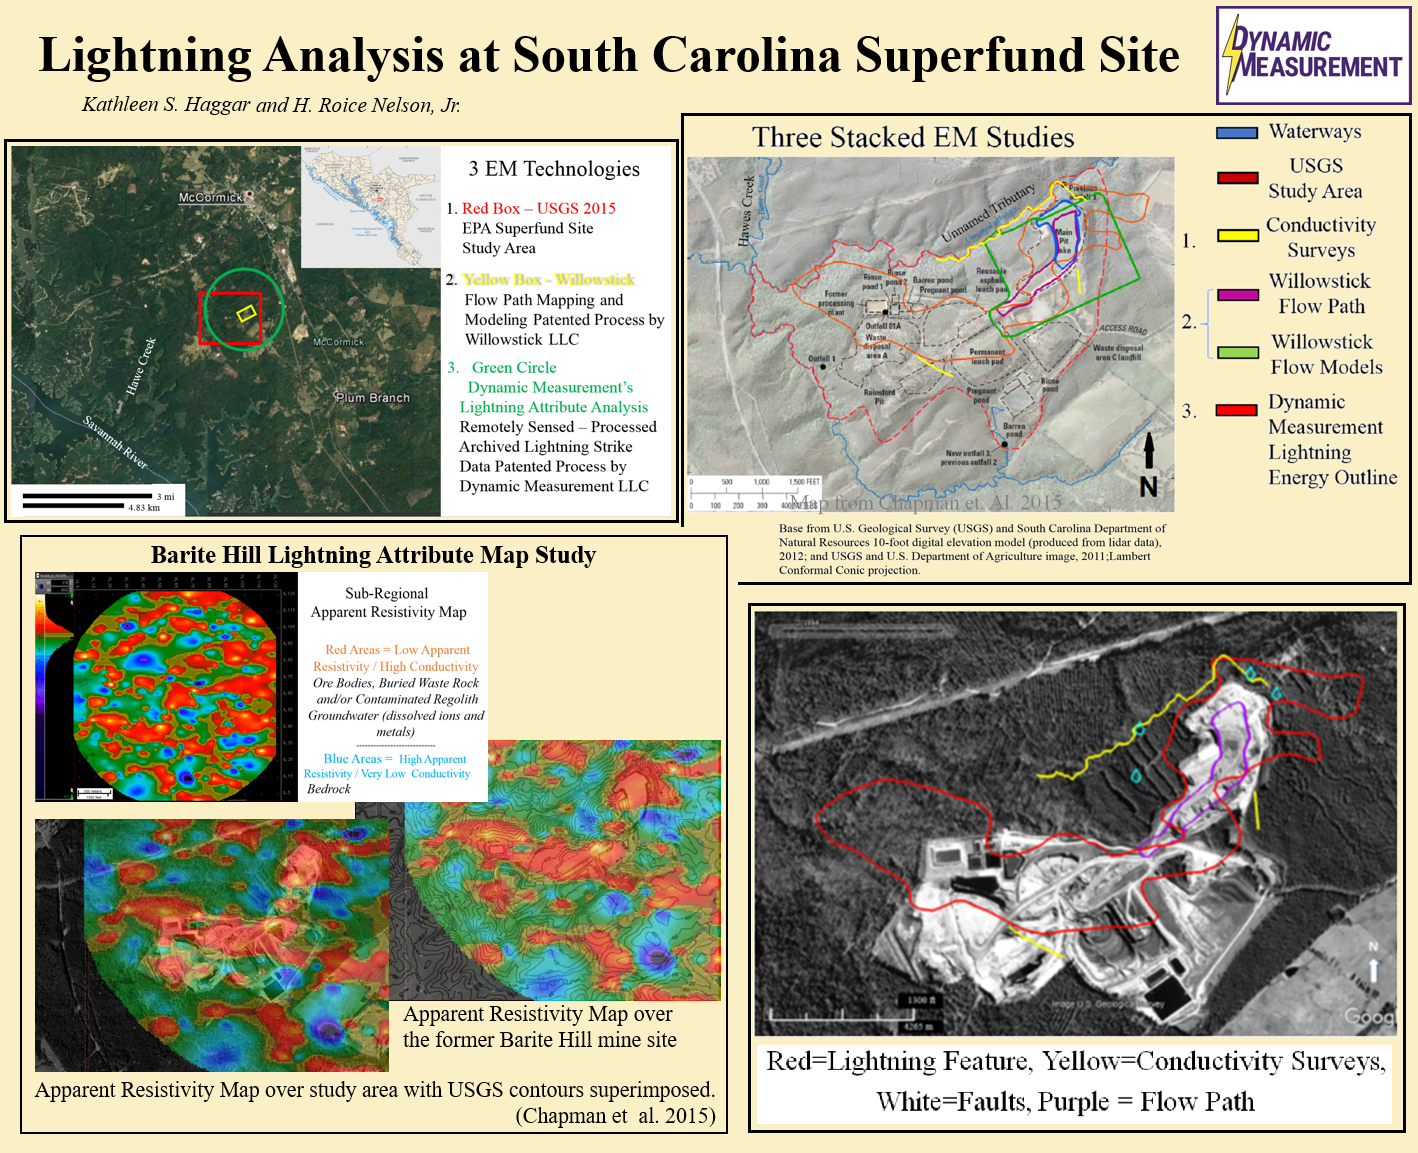
Shear Fault Interpretation | Geology Topo Fracture Sets |
Geologic Block Diagrams | Geologic Maps Resistivity |
Poster Abstract and Overview | Willowstick Seep Flow Paths |
Willowstick Water Flow | Energy, PC+,A,-, Rock Properties |
Energy Attribute and Flow Paths | Energy, PCA, Resistivity + Flow |
![](SC_61_USGS_Conductivity-Lightning_Resistivity.png) | ![](SC_62_Apparent_Resistivity_A-A'.png) |
![](SC_63_Apparent_Resistivity_B-B'.png) | ![](SC_64_Apparent_Resistivity_C-C'.png) |
![](SC_65_Zoom_GE.PNG) | ![](SC_66_Zoom_Mod_Path_Model_GE.PNG) |
![](SC_67_Zoom_Preffered_Flow_only.PNG) | ![](SC_68_Zoom_Rise_Rate_GE.PNG) |
![](SC_69_Zoom_Rise_Rate_Mod_Path_Conventional_GE.PNG) | ![](SC_70_Zoom_Rise_Rate_Mod_Path_Model_GE.PNG) |
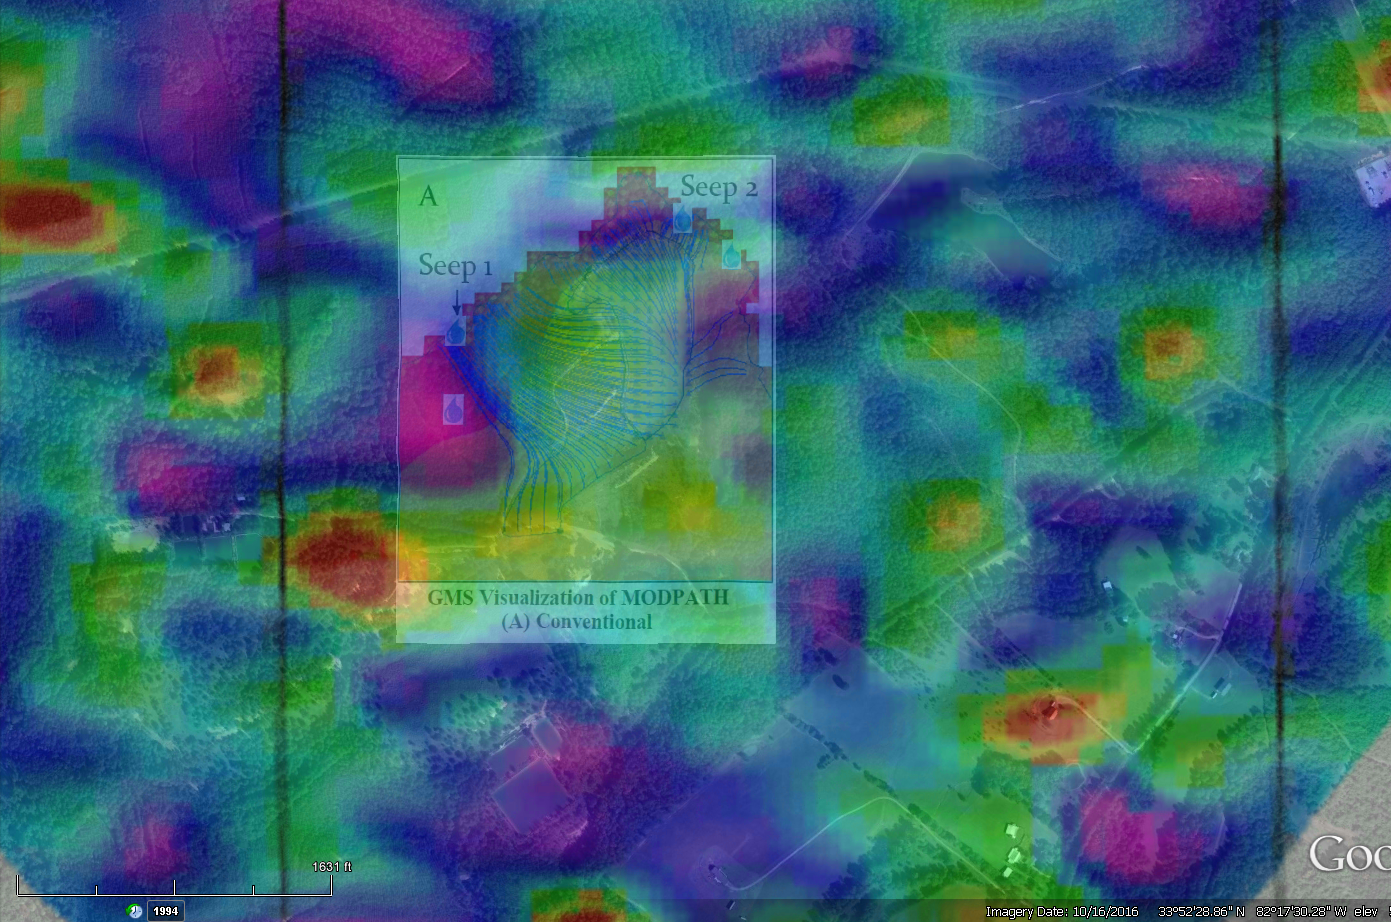
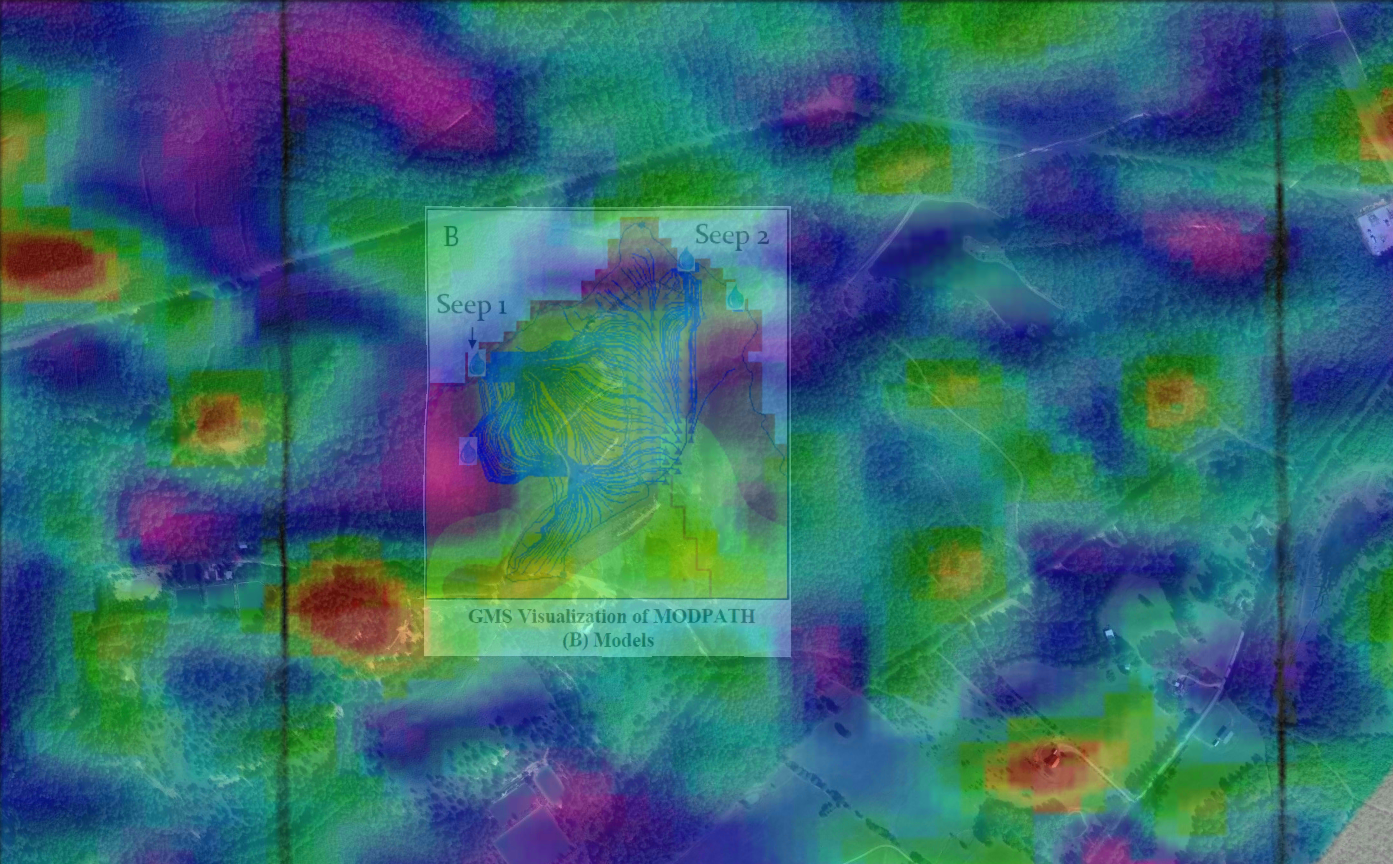
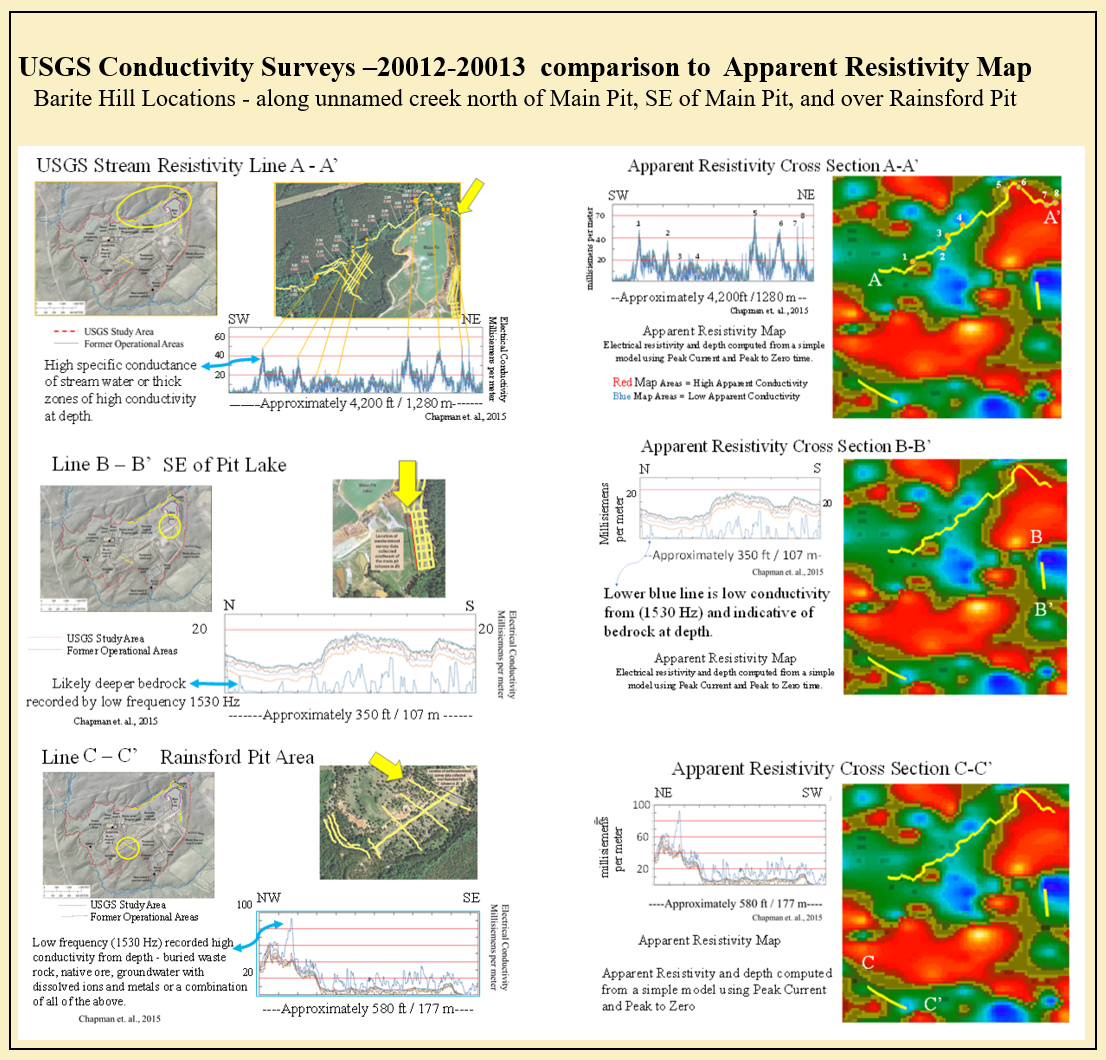
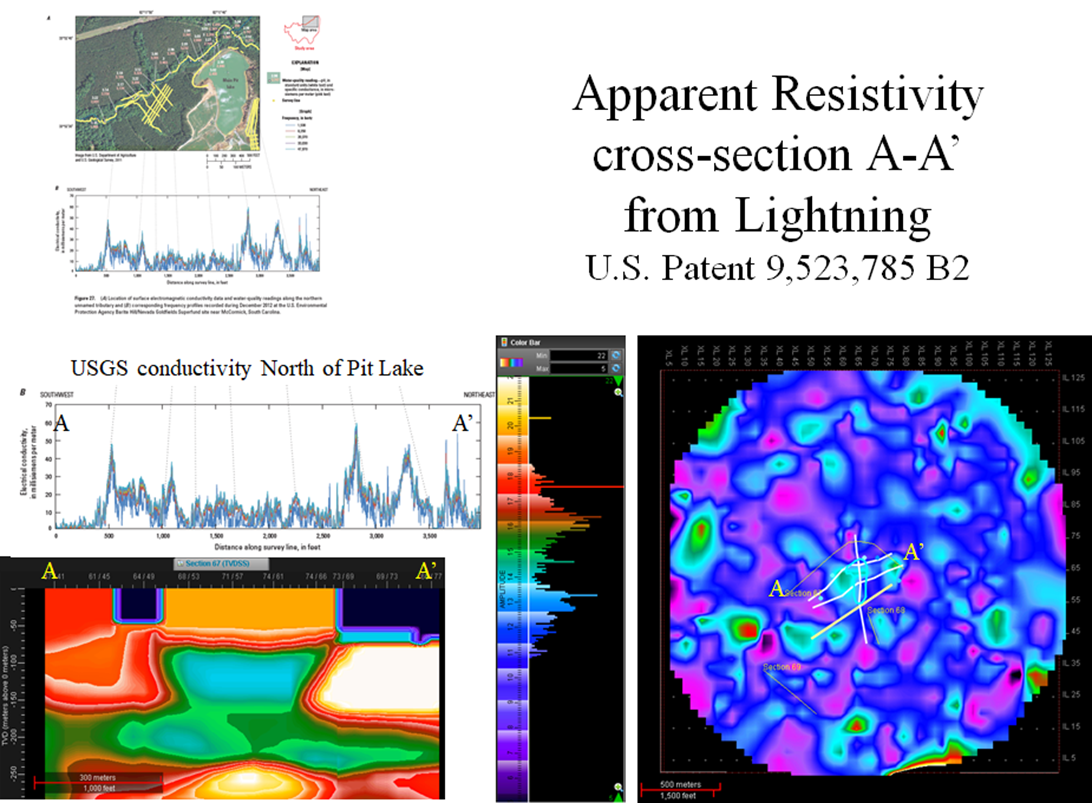
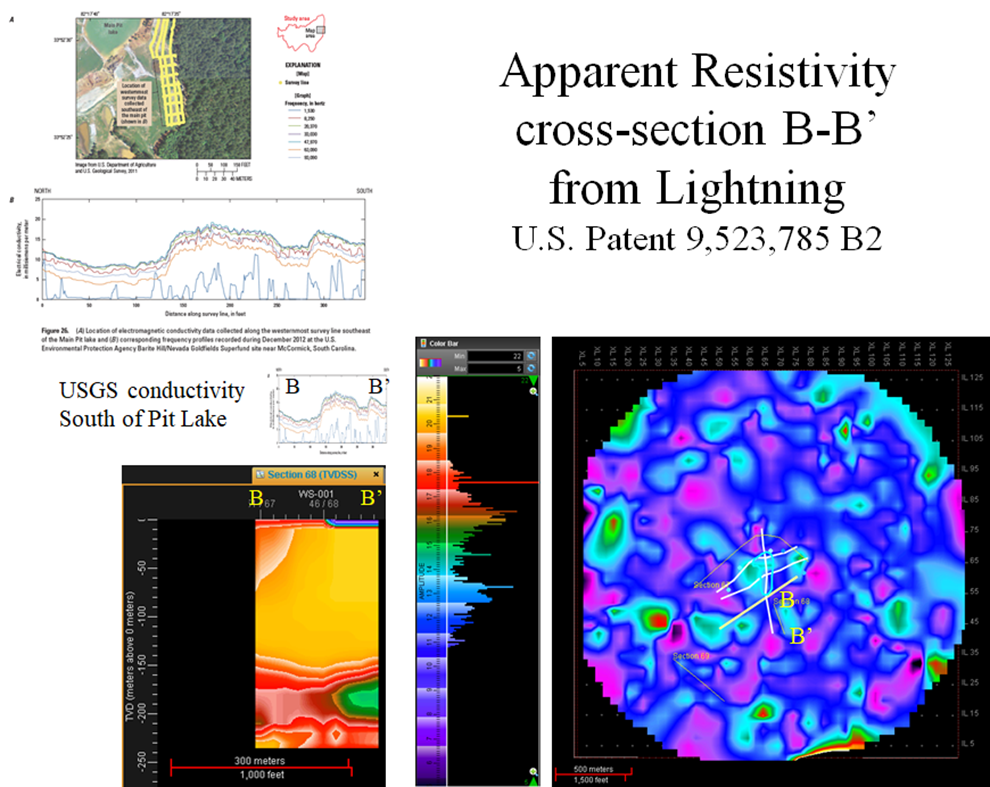
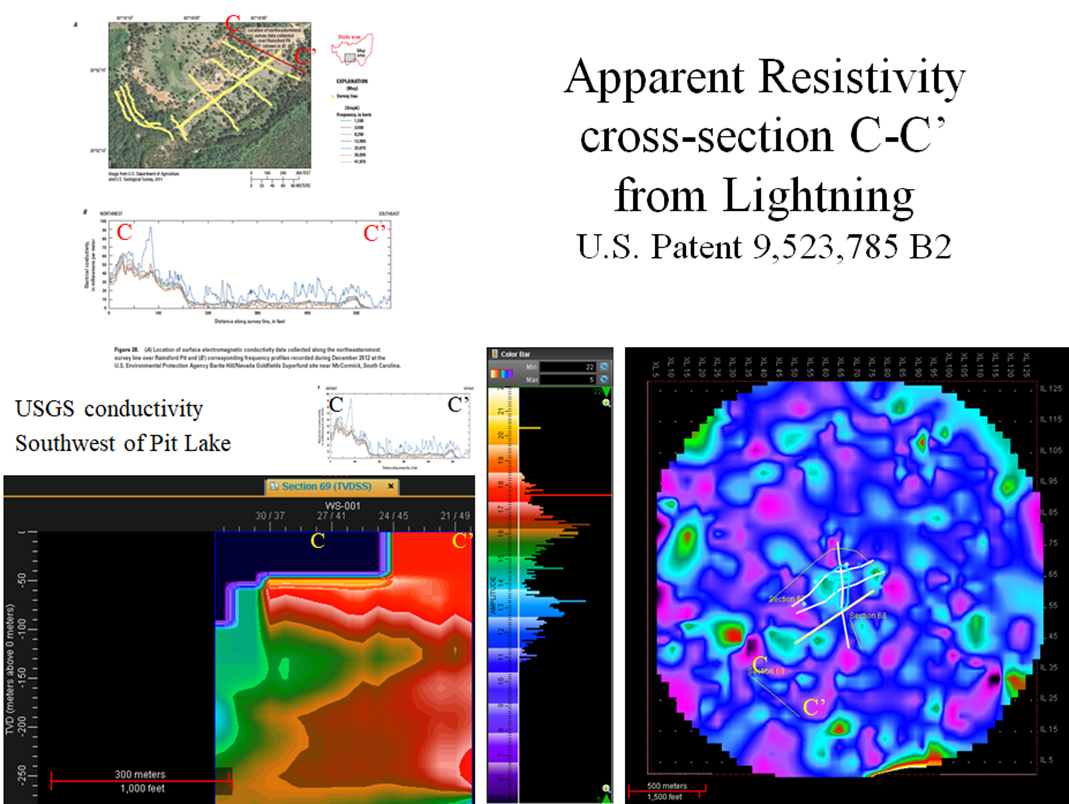
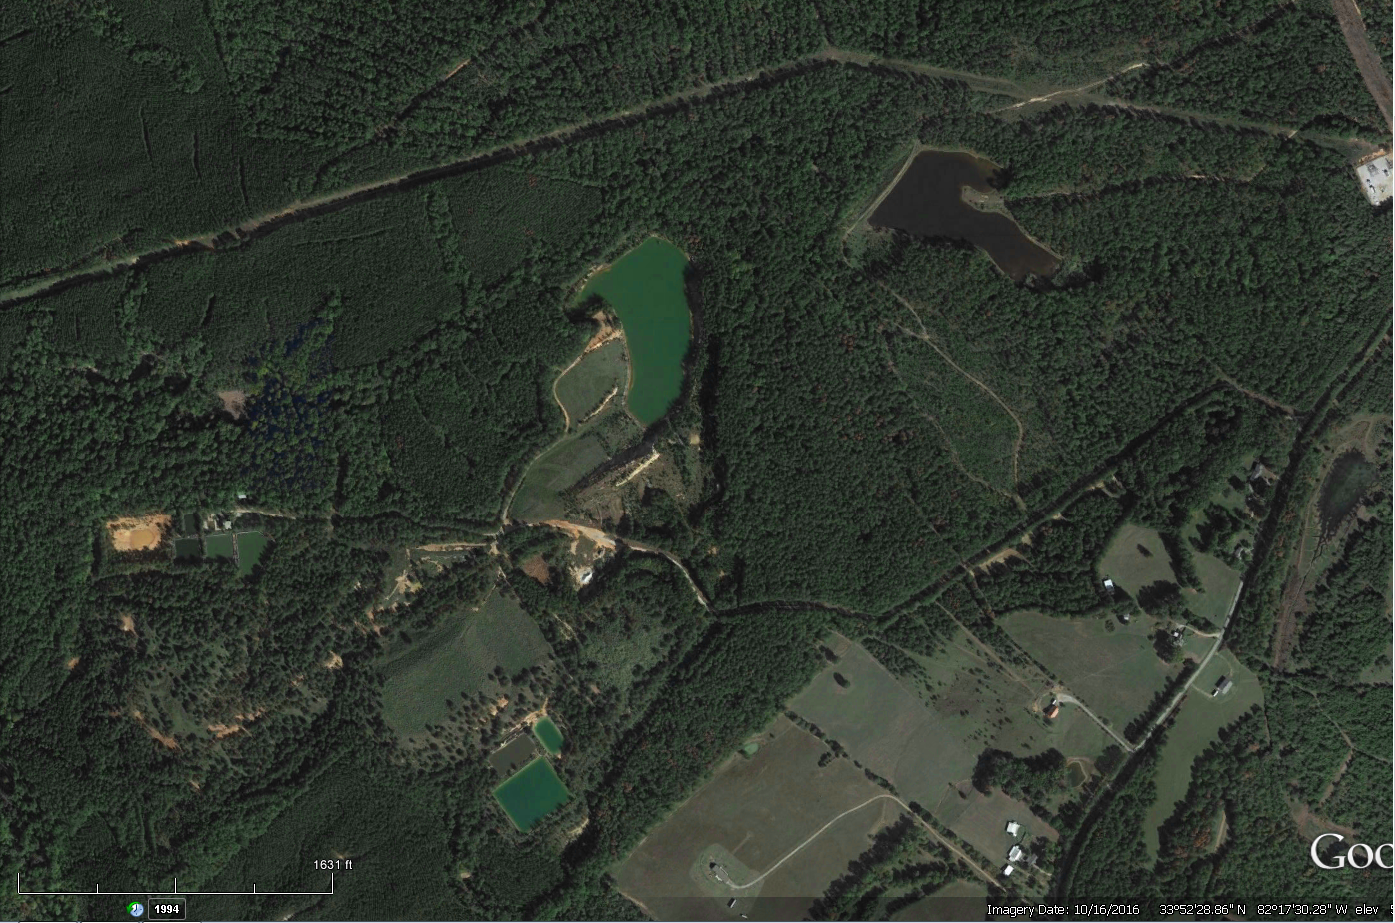
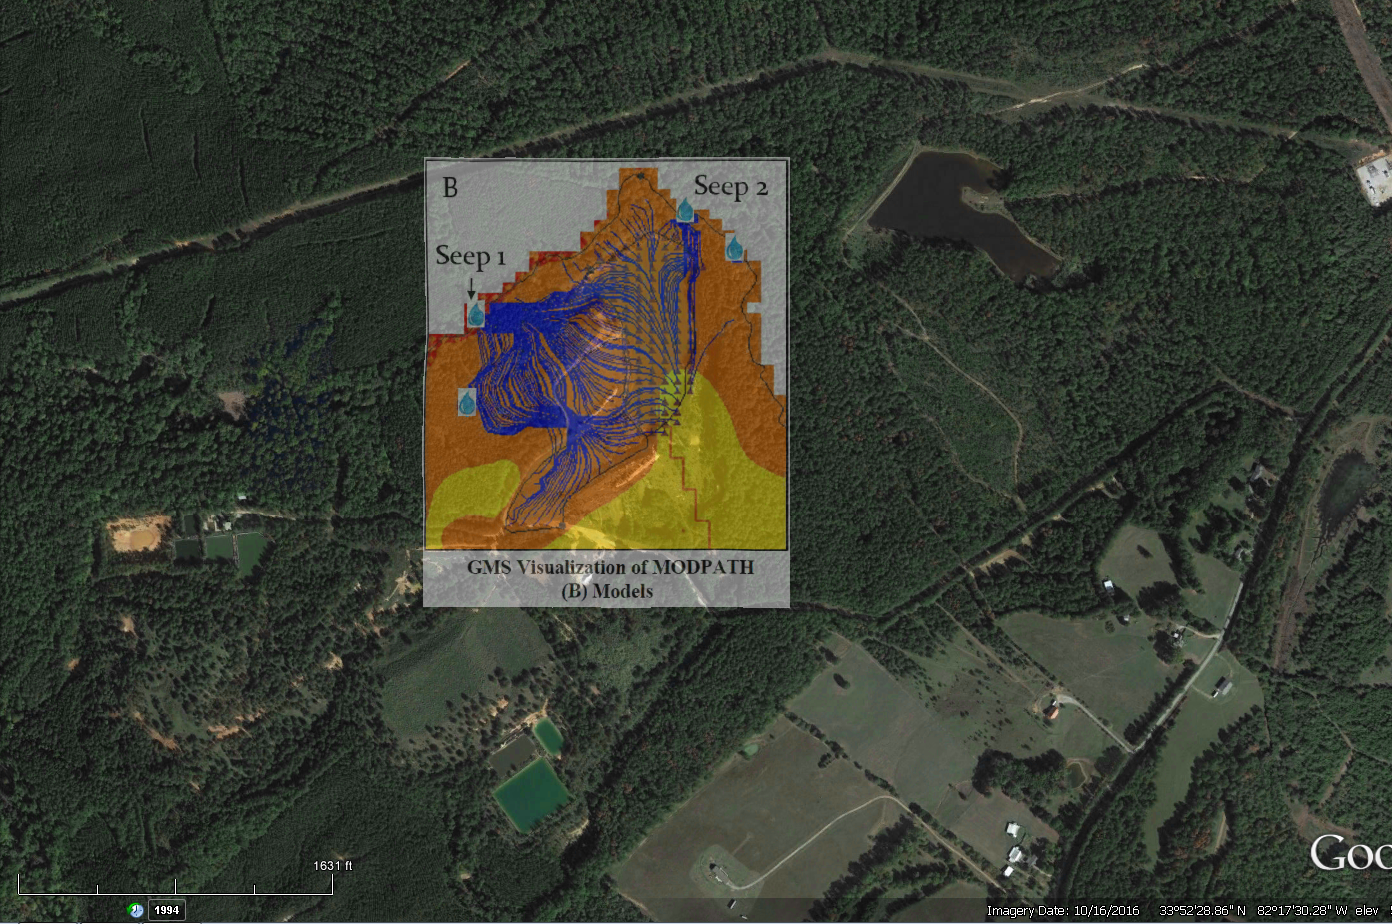
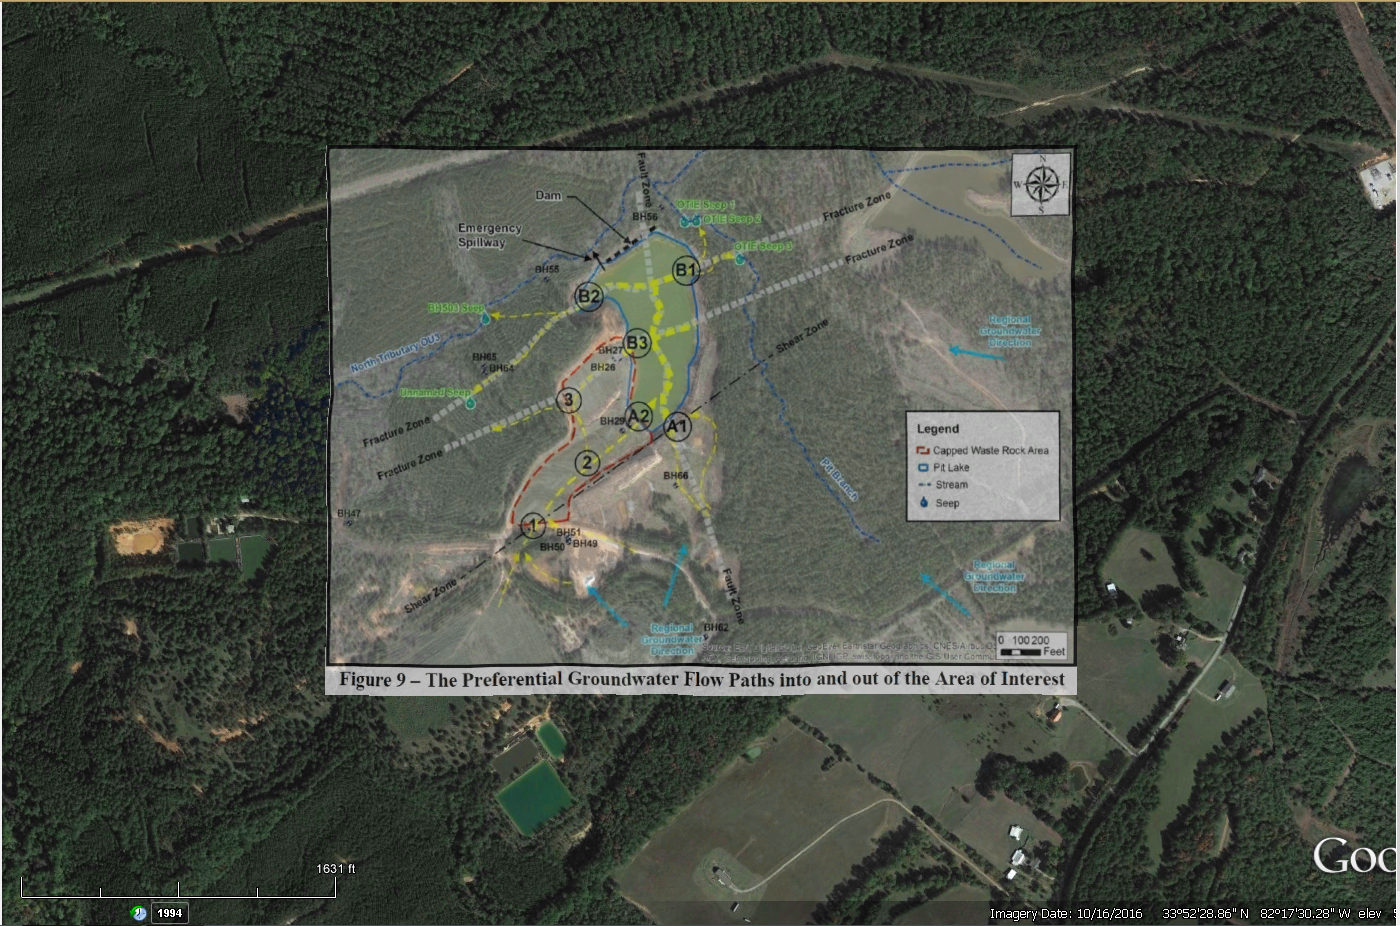
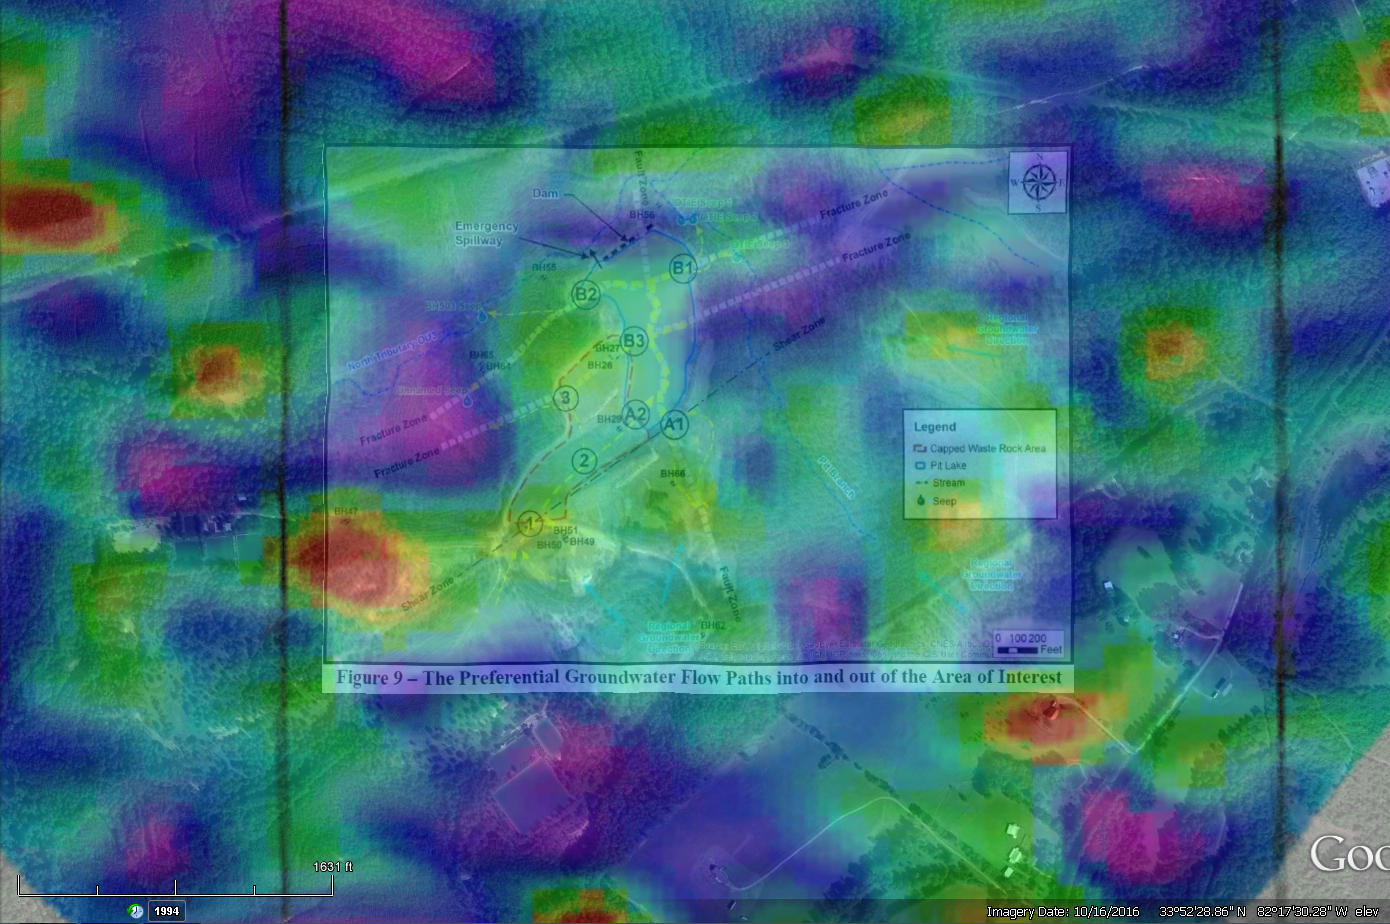
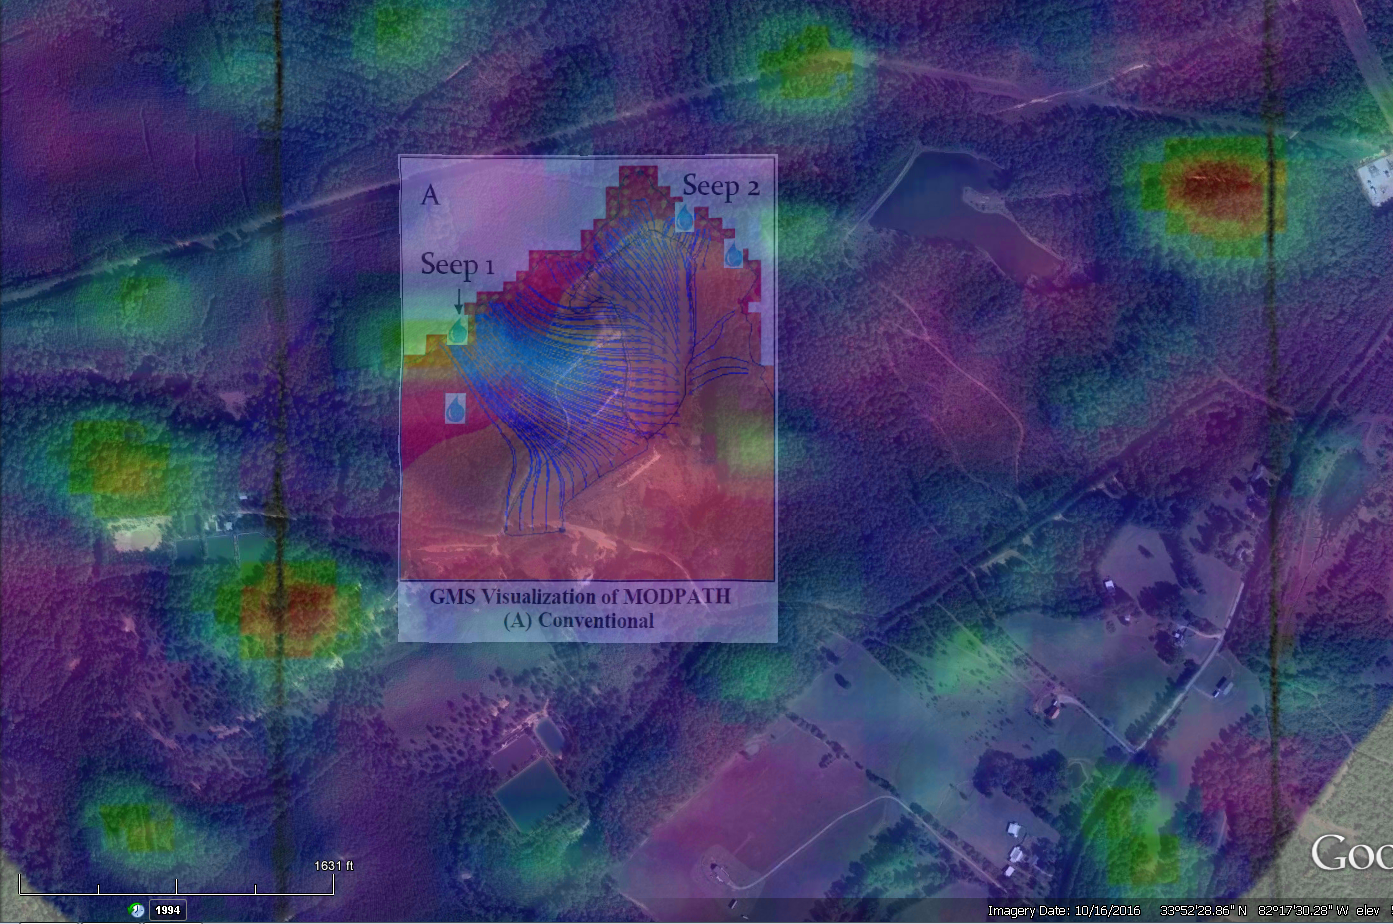
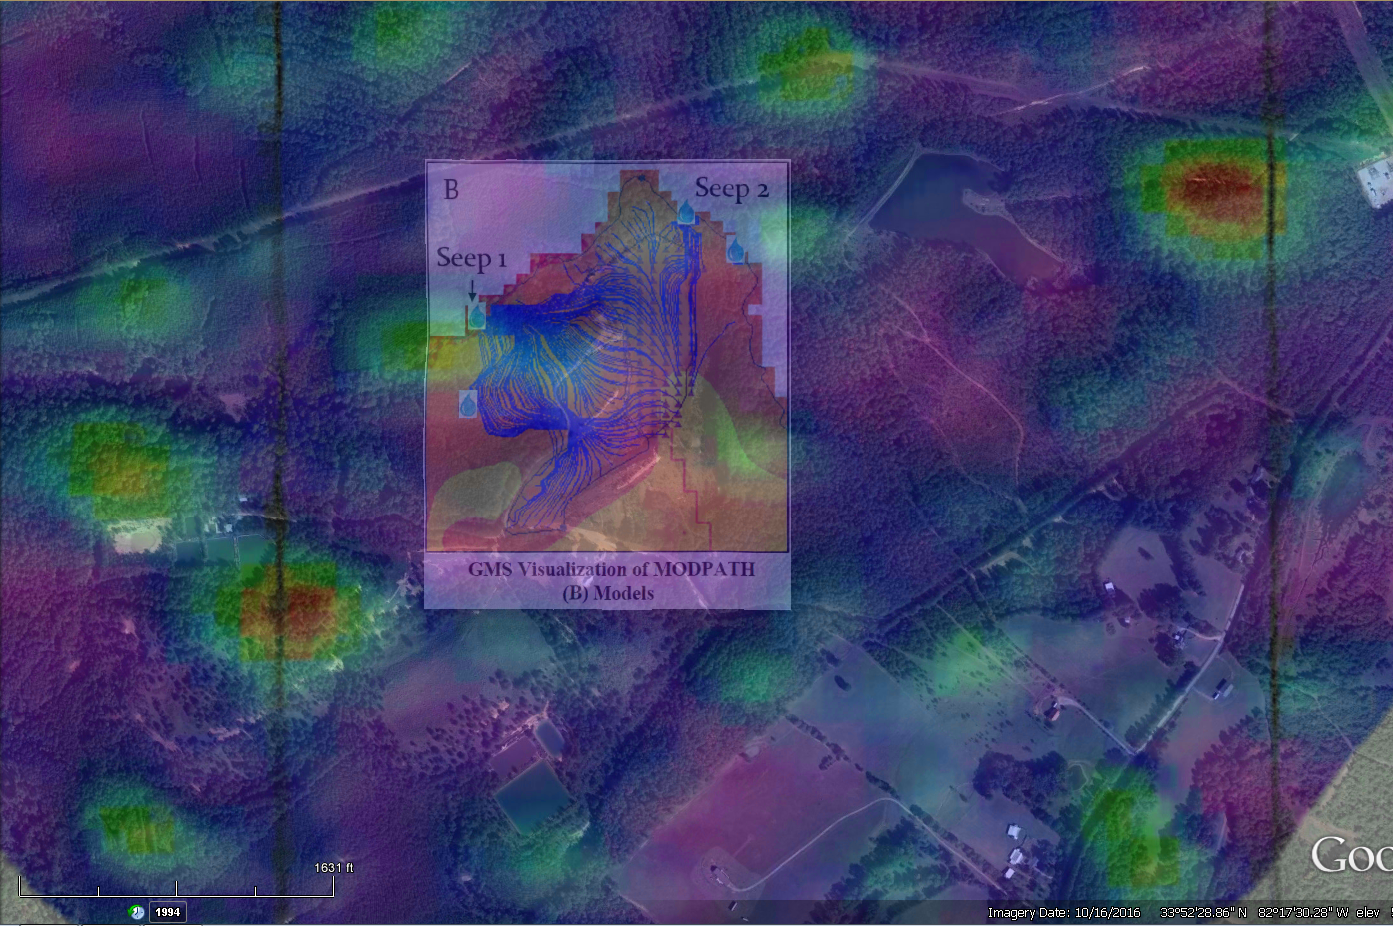
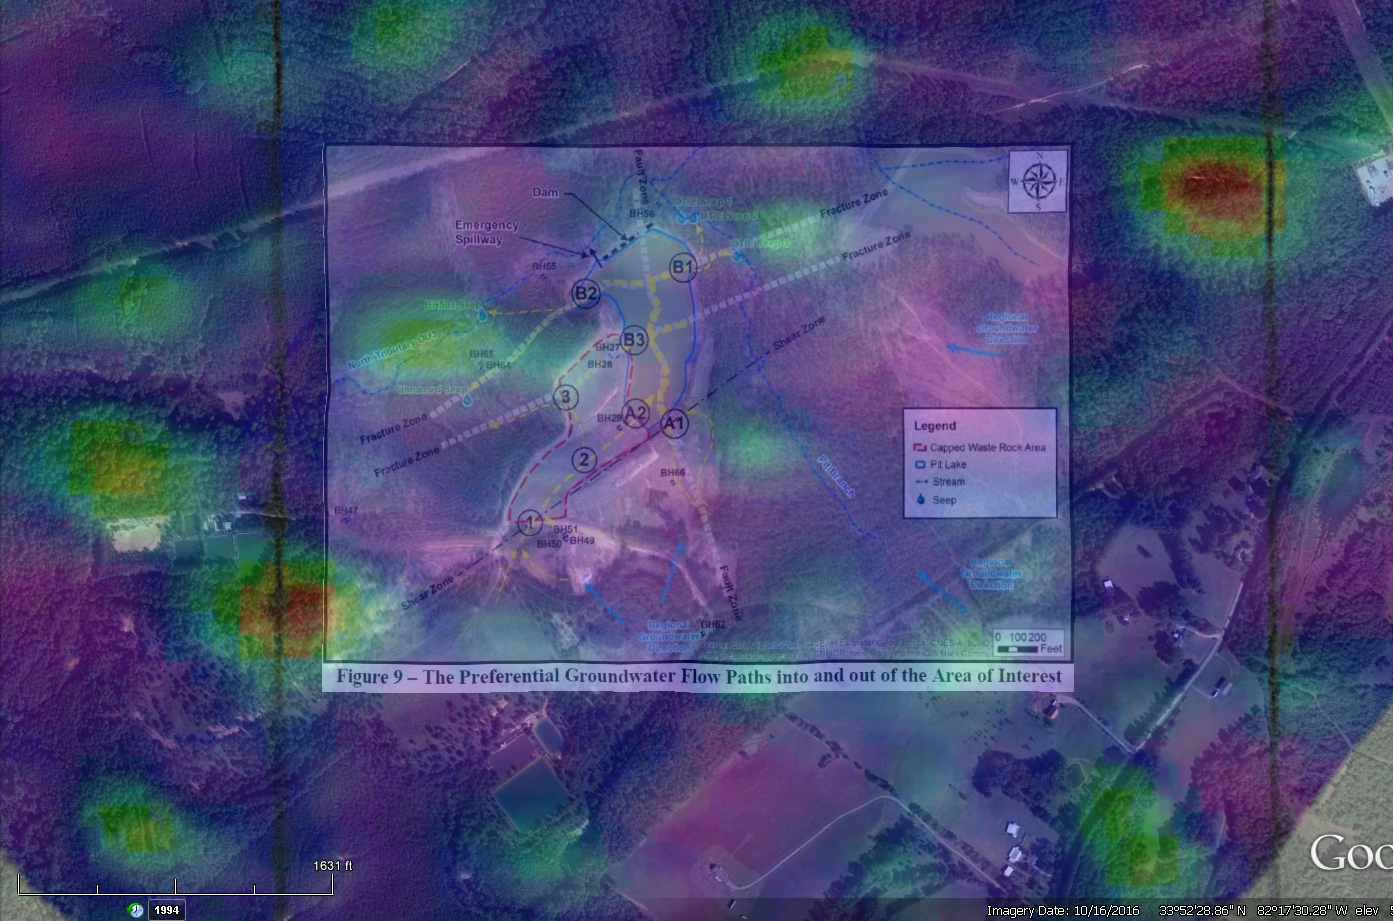
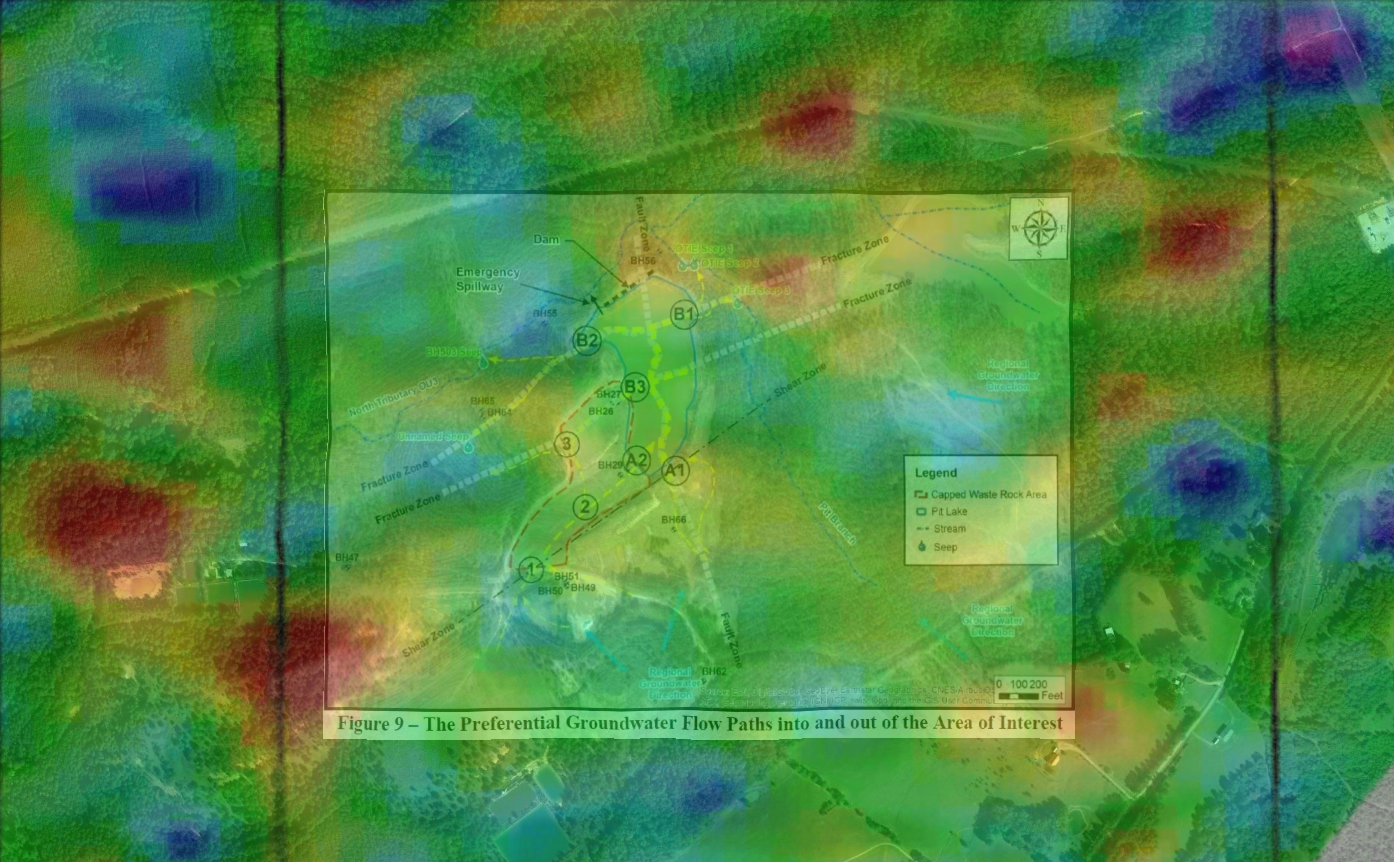
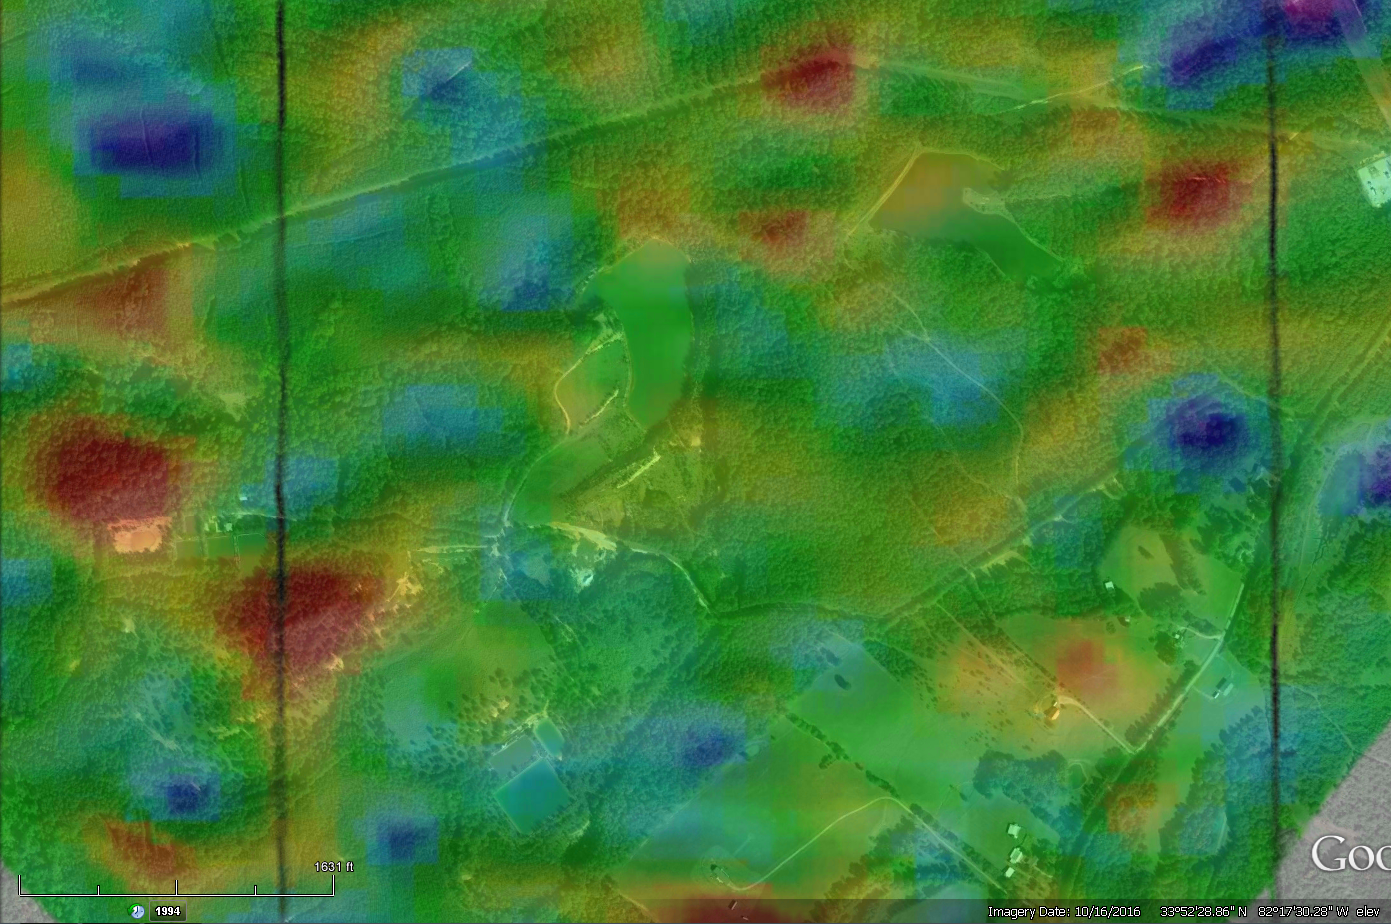
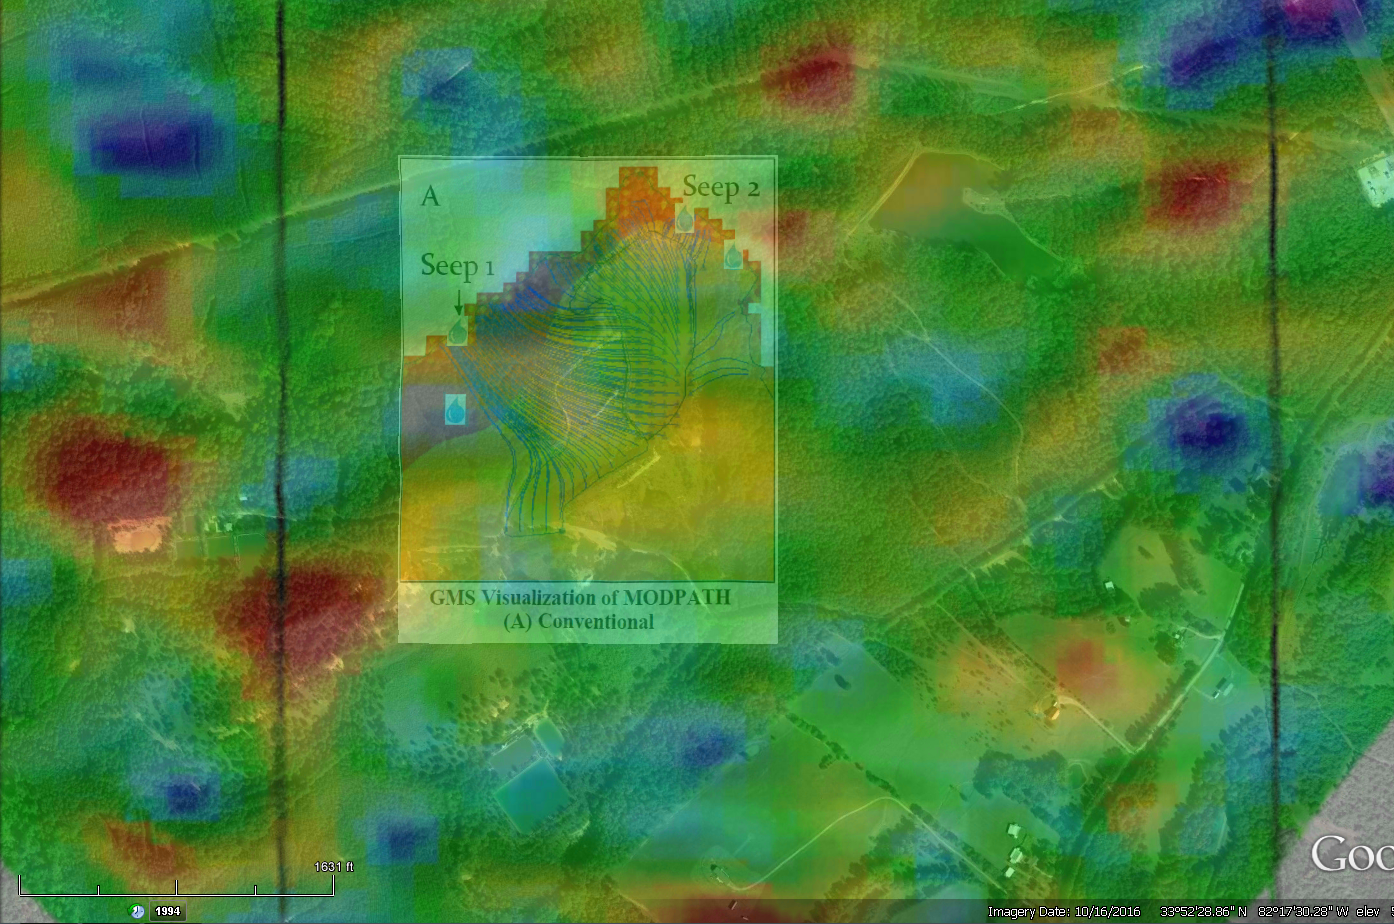
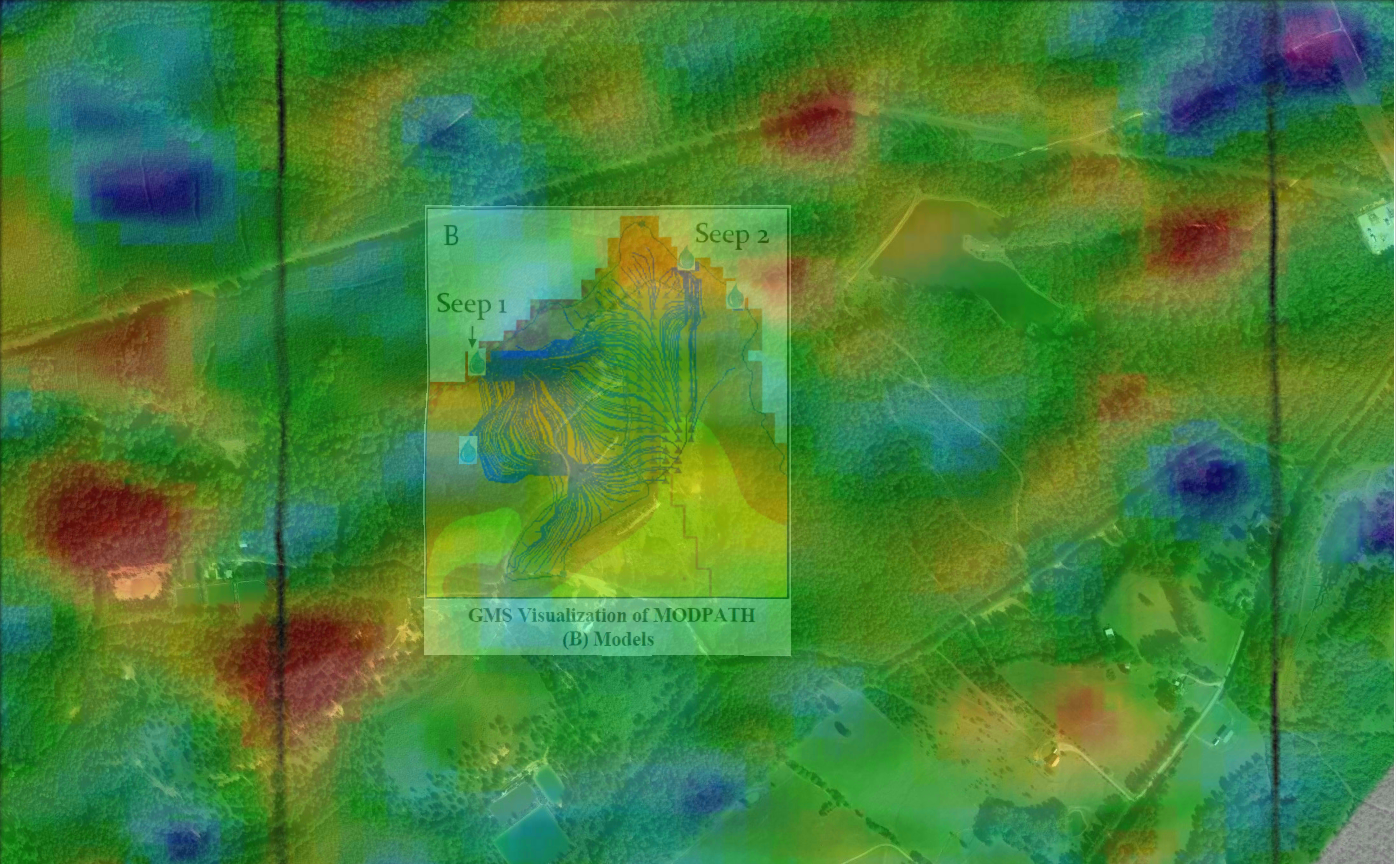
Tieing USGS Conductivity | Tieing USGS A-A' Section |
Tieing USGS B-B' Section | Tieing USGS C-C' Section |
Zoom Area GoogleEarth | MODPATH on GoogleEarth |
Preferential Flow Paths | Rise-Rate GoogleEarth |
Rise-Rate MODPATH A | Rise-Rate MODPATH B |
![](SC_71_Zoom_Rise_Rate_Preferred_Flow.PNG) | ![](SC_72_Zoom_RT_GE.PNG) |
![](SC_73_Zoom_RT_Mod_Path_Conventional_GE.PNG) | ![](SC_74_Zoom_RT_Mod_Path_Model_GE.PNG) |
![](SC_75_Zoom_RT_Preferred_Flow.PNG) | ![](SC_76_Zoom_Total_Time__Preferred_Flow_GE.PNG) |
![](SC_77_Zoom_Total_Time_GE.PNG) | ![](SC_78_Zoom_Total_Time_Mod_Path_Conventional_GE.PNG) |
![](SC_79_Zoom_Total_TimeMod_Path_Model_.PNG) | ![](SC_80_Lightning_Analysis_SC_Superfund_Site.png) |
Rise-Rate Preferential Flow | Rise-Time GoogleEarth |
Rise-Time MODPATH A | Rise-Time MODPATH B |
Rise-Time Preferential Flow | Total-Time GoogleEarth |
Total-Time MODPATH A | Total-Time MODPATH B |
Total-Time Preferential Flow | Summary 3 EM Projects |
![](SC_81_USGS-Lightning-Rose_Diagrams.png) | ![](SC_82_Barite_Hills_Risk_Points.png) |
![](SC_83_Poster_Conclusions.png) | ![](SC_84_Formation+of+the+Appalachians.jpg) |
![](SC_85_thrusts.gif) | ![](SC_86_New_Jersey_Thrust.jpg) |
![](SC_87geologic_setting.png) | ![](SC_88_Pressure-Temperature_minerals.png) |
![](SC_89_epithermal_deposit_formation.png) | ![](SC_90_gold_in_epithermal_deposits.png) |
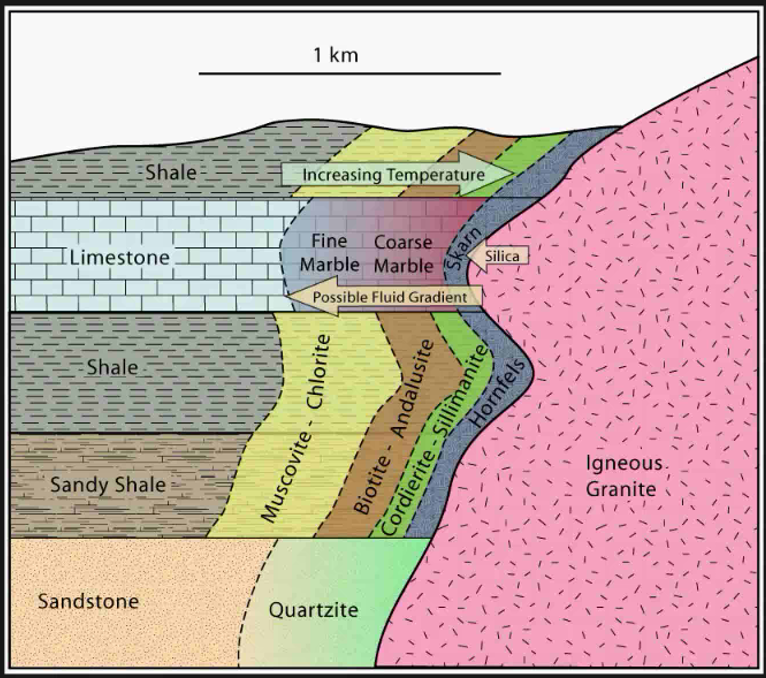
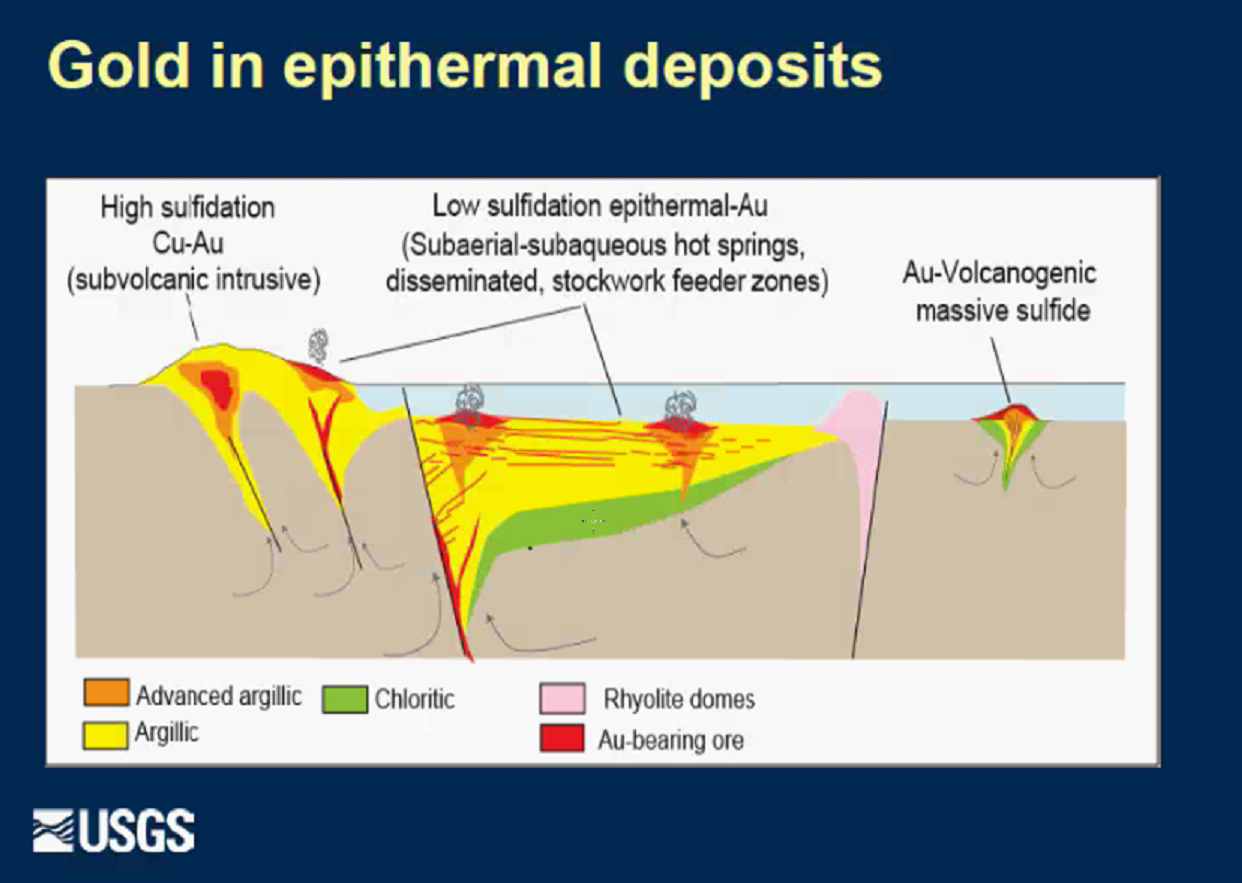
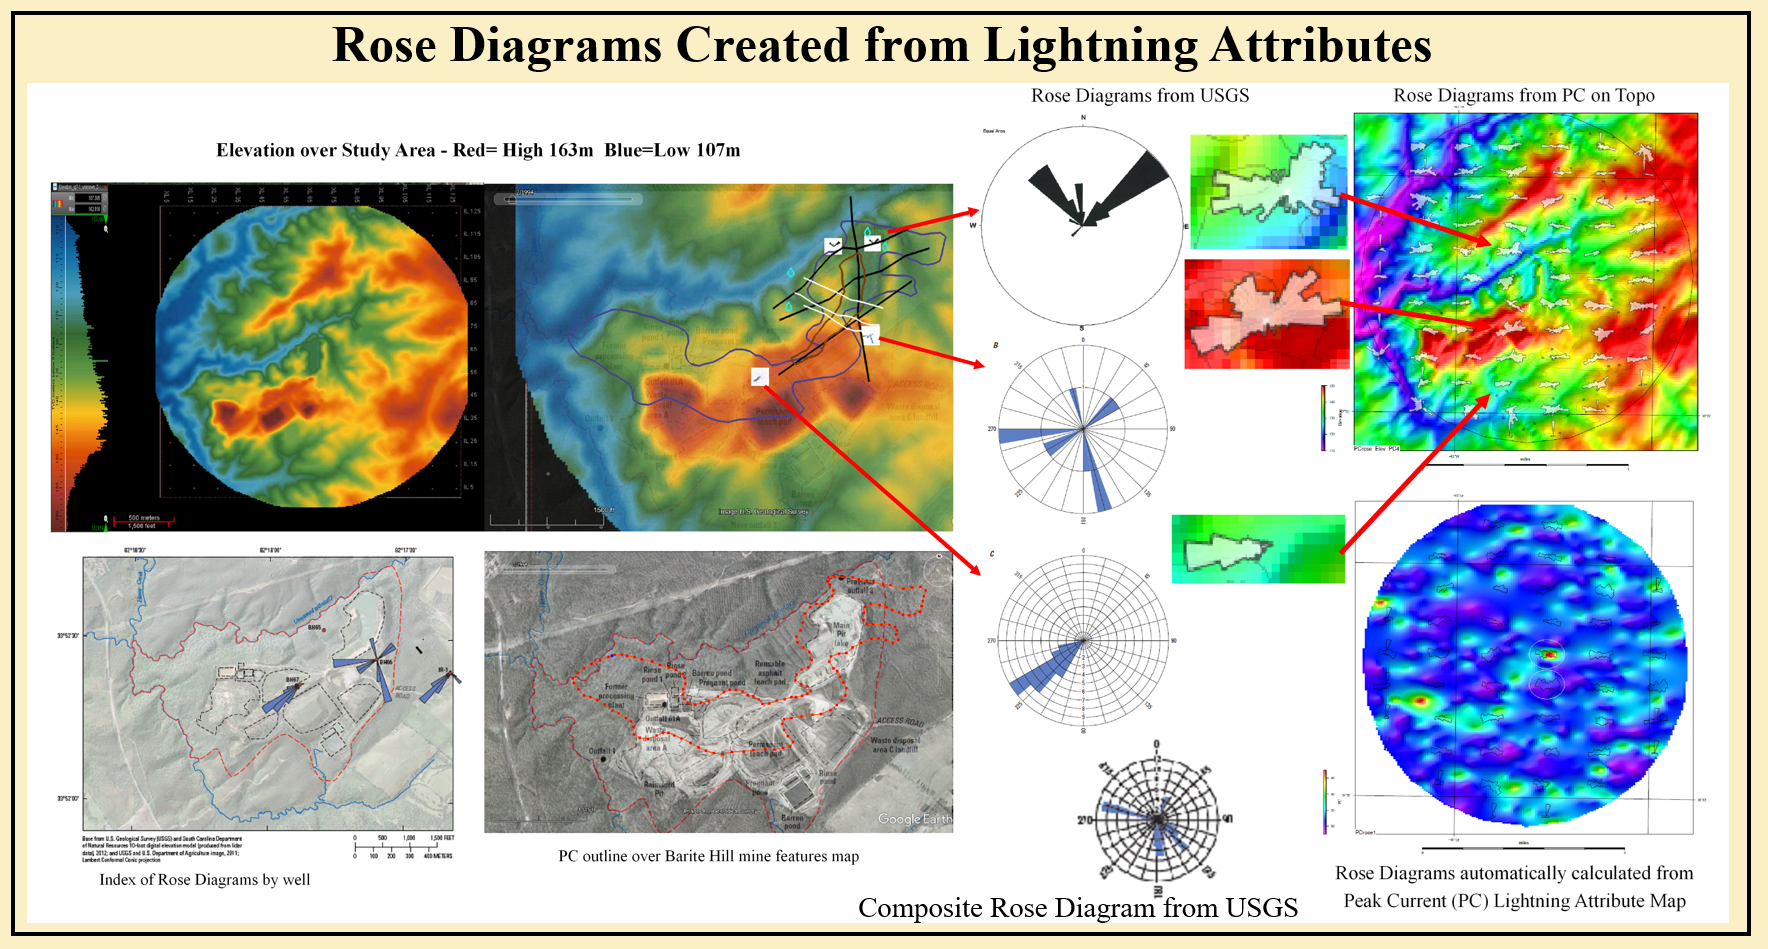
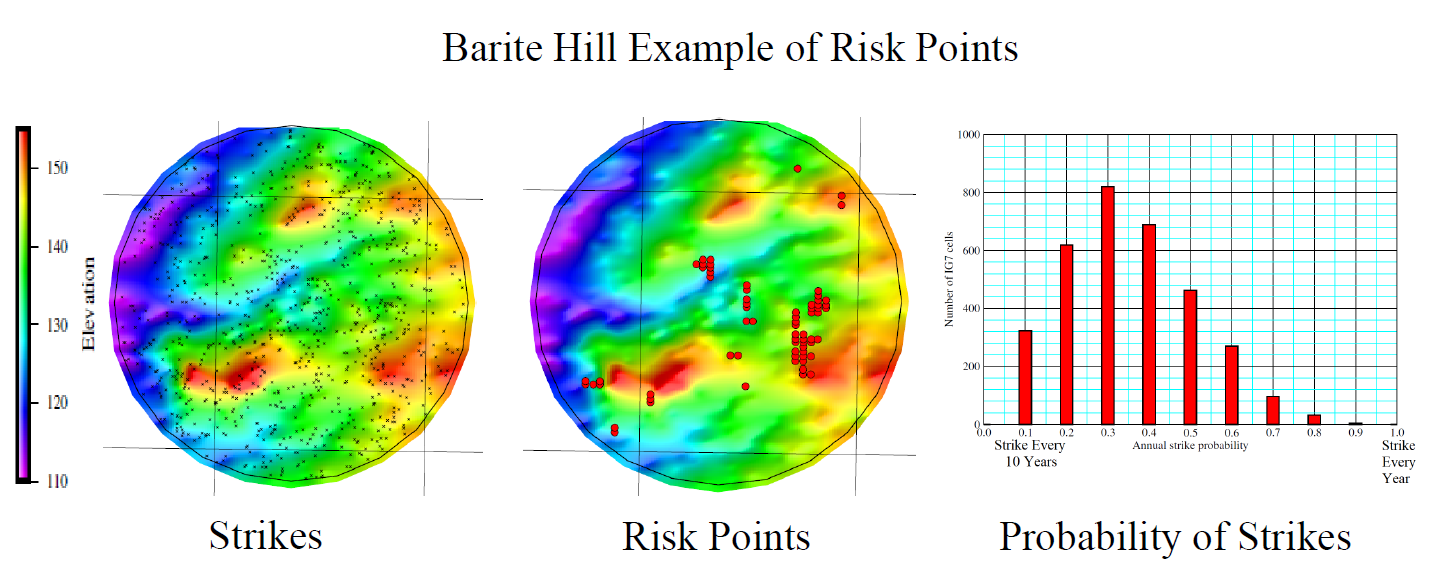
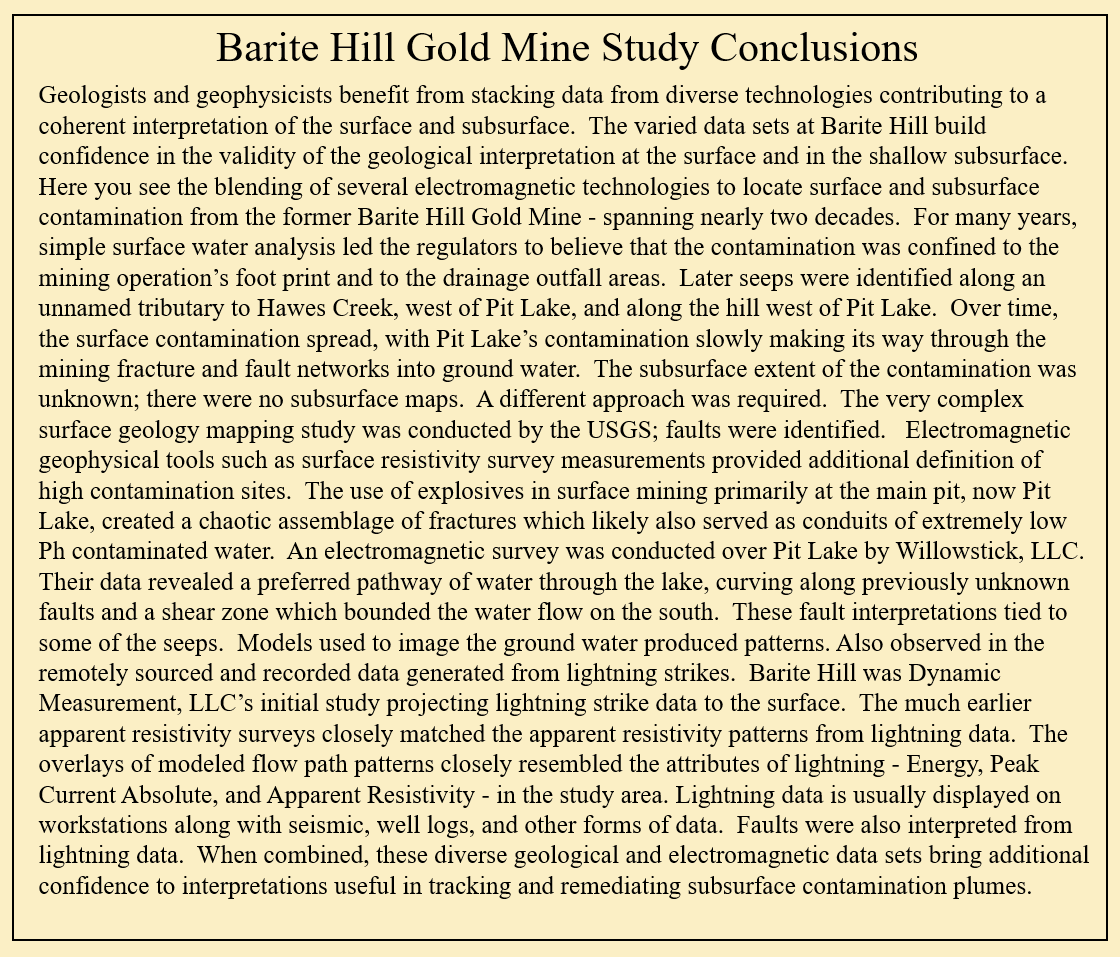
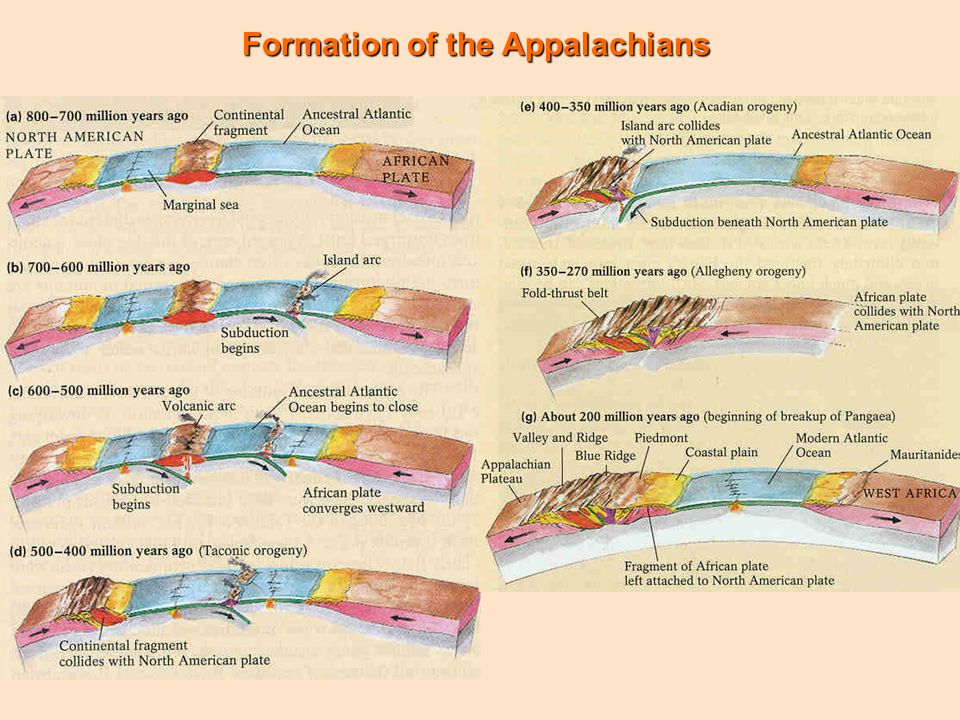
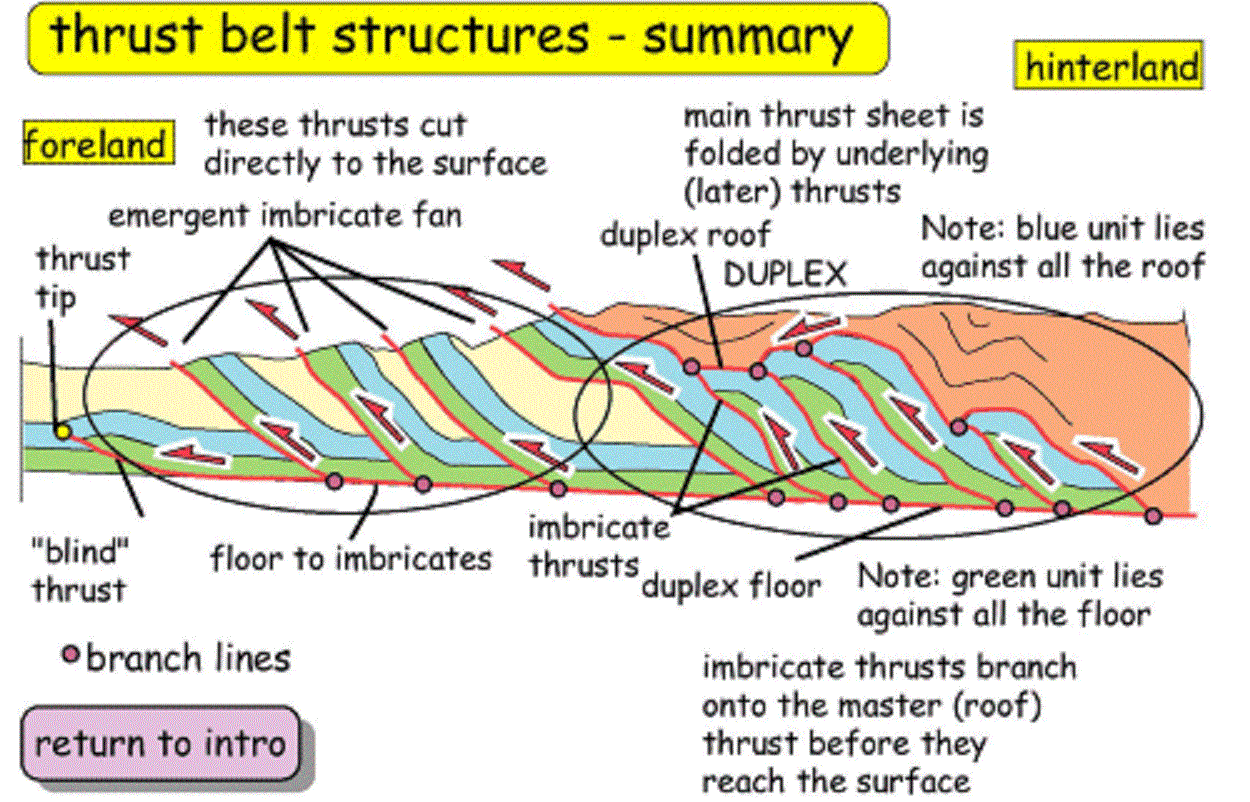
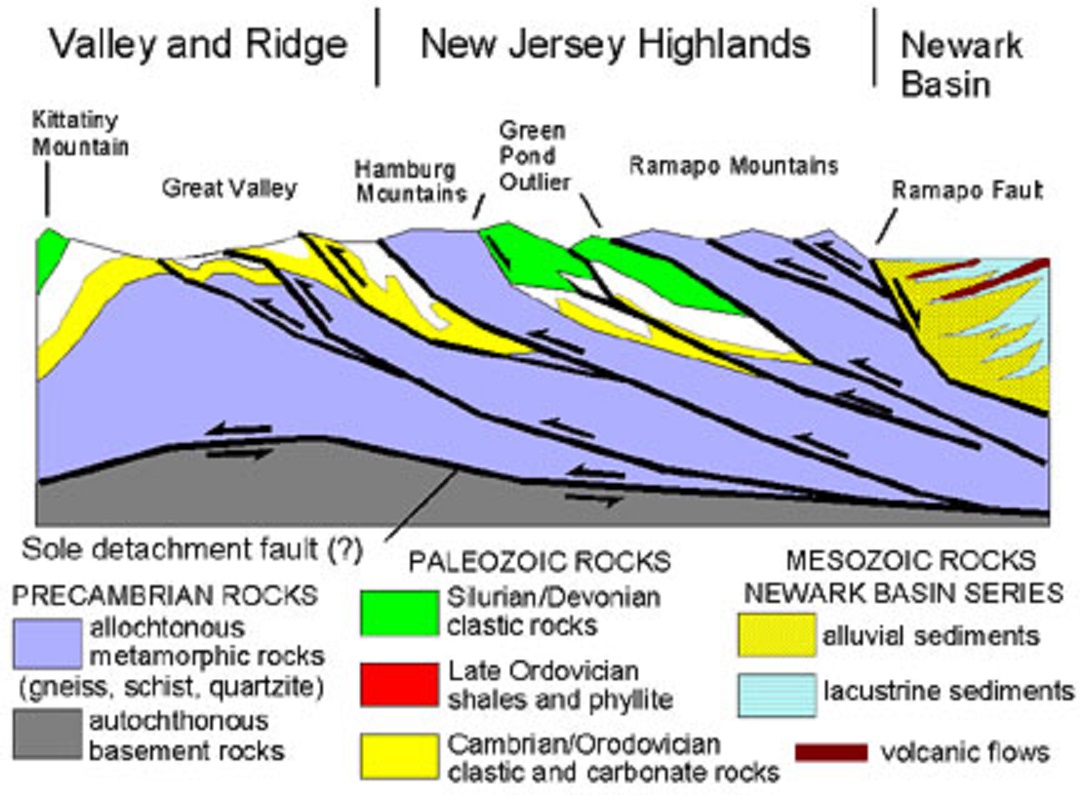
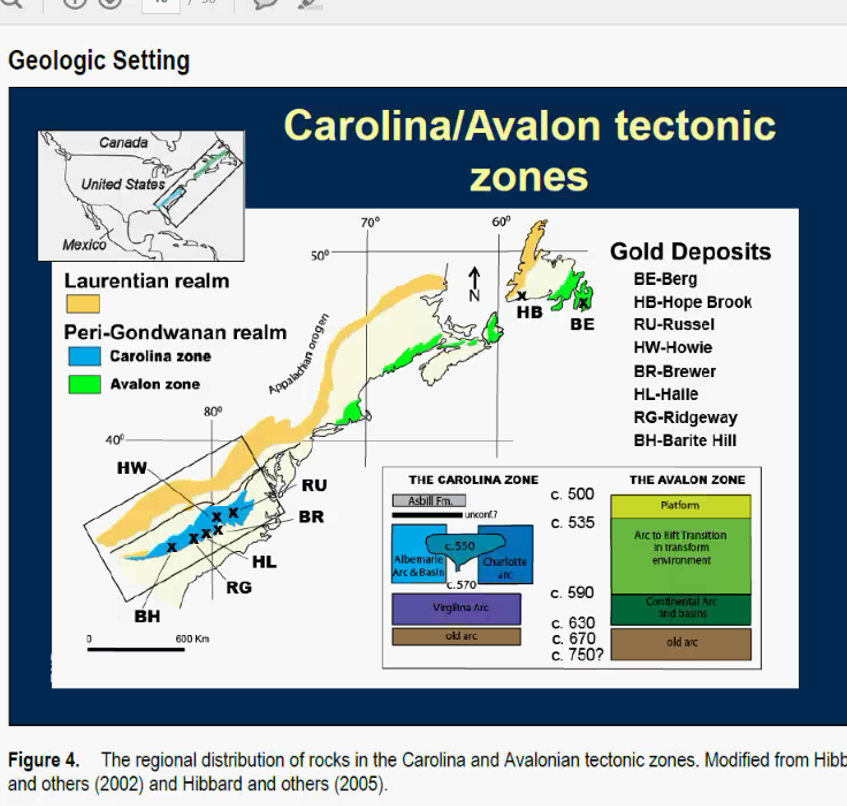
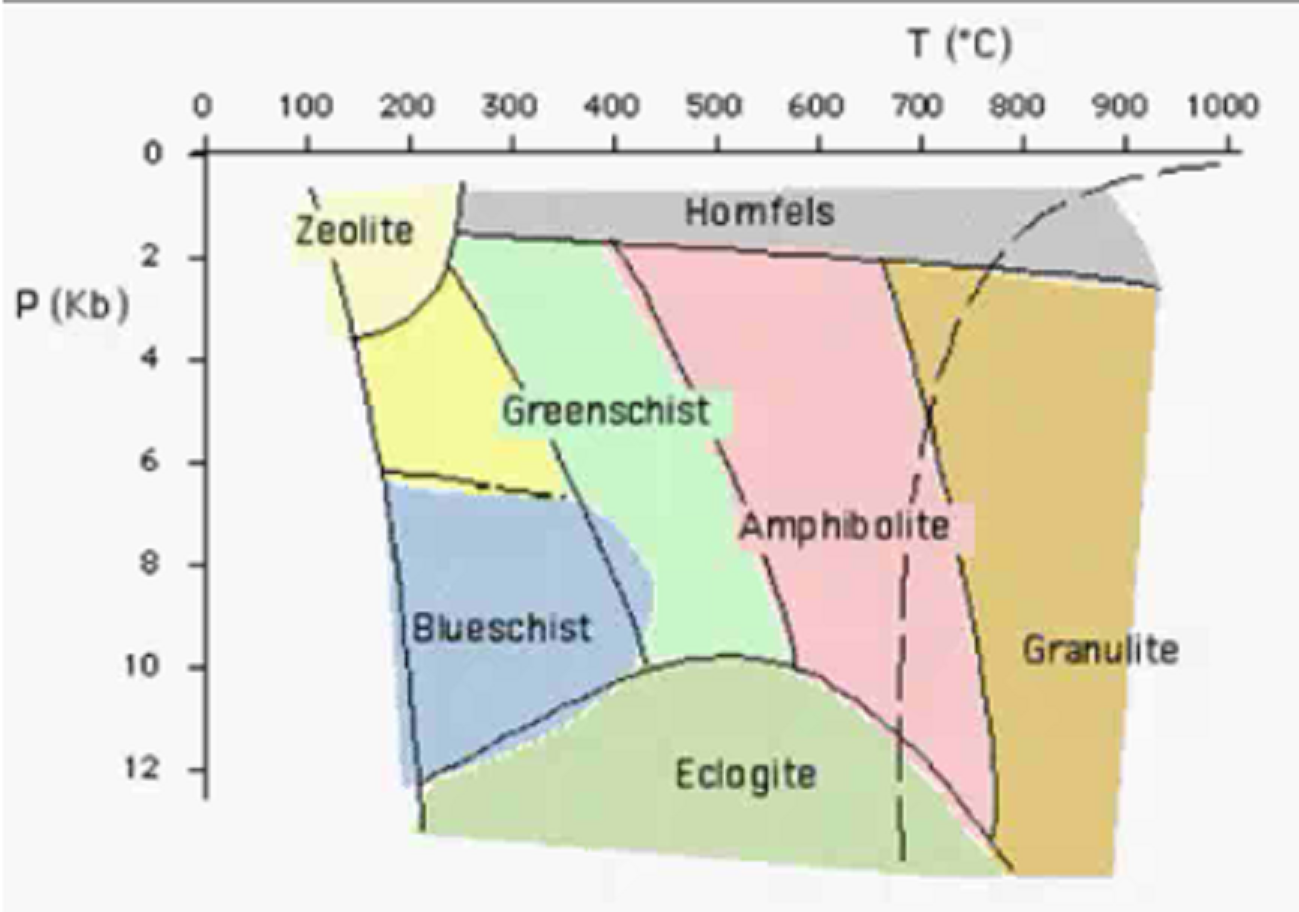
Rose Diagrams from Lightning | Barite Strikes, Risk Points |
Poster Barite Conclusions | Formation of Appalachians |
Thrust Belt Structures South | Thrust Belt Structures North |
Carolin/Avalon Tectonic Zones | Metamorphic Temp vs Pressure |
Intrusion Alteration | Gold Epithermal Deposits |