 |  |
 |  |
 |  |
 |  |
 |  |
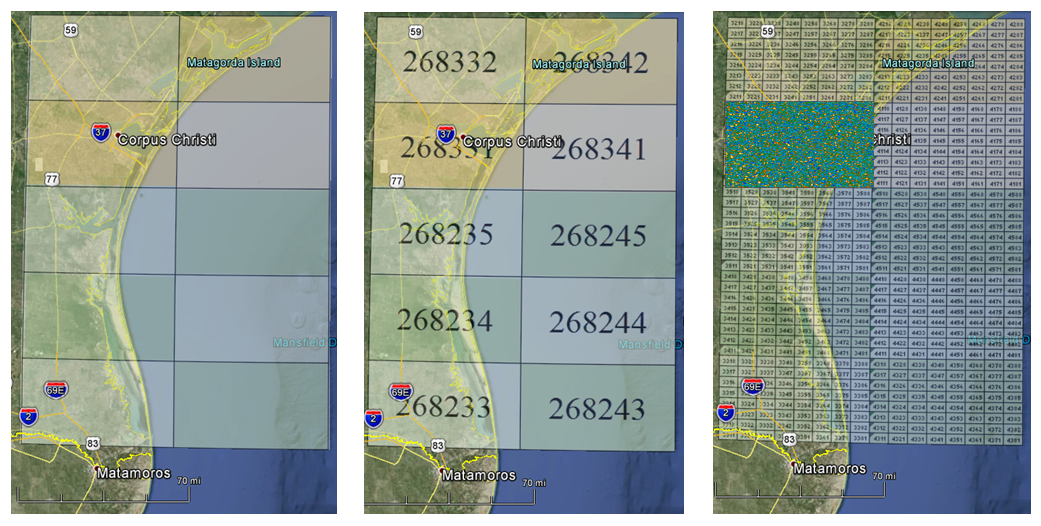
| Frio Gas Play, Lightning Analysis Area | Infinite Gridsm (IG) Breakdown, 268331-slice |
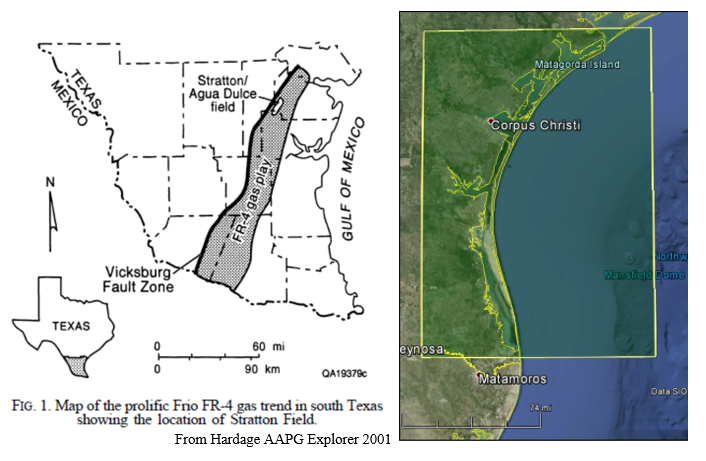
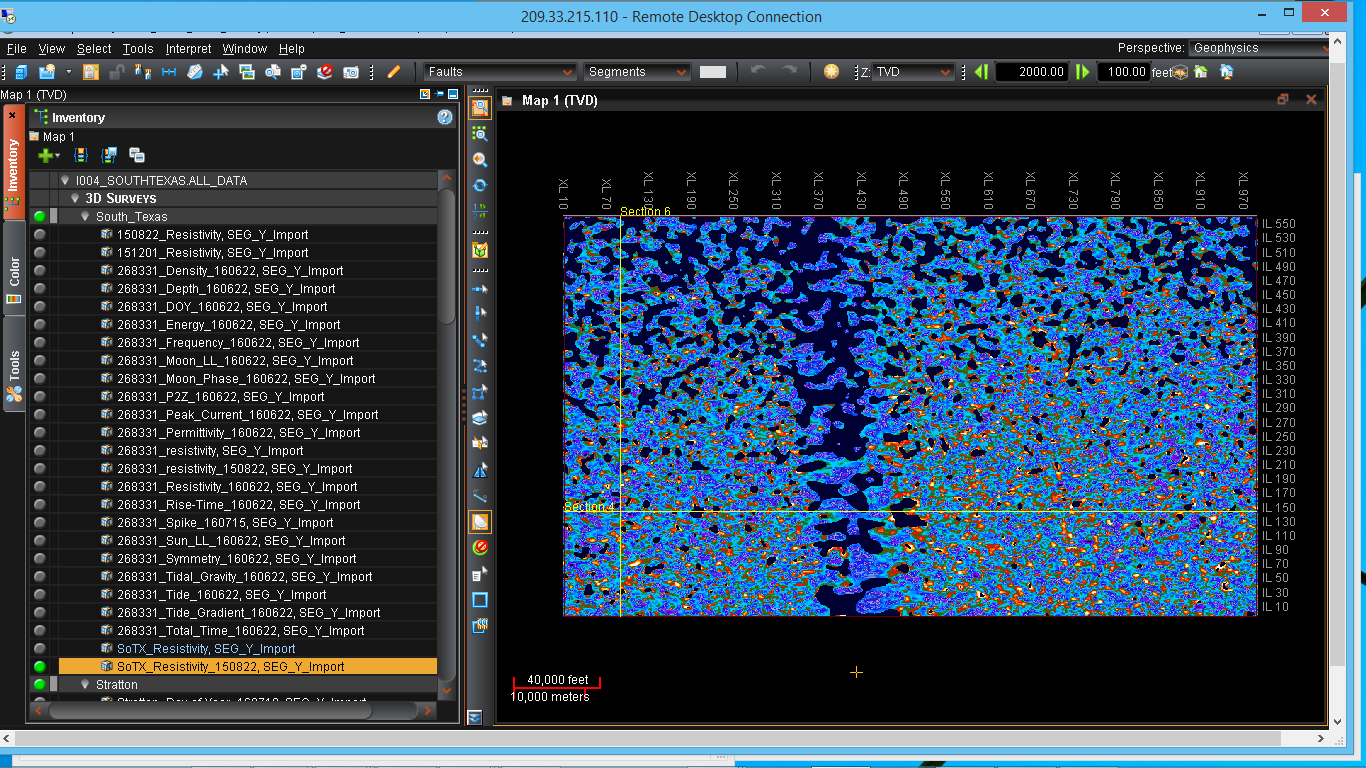
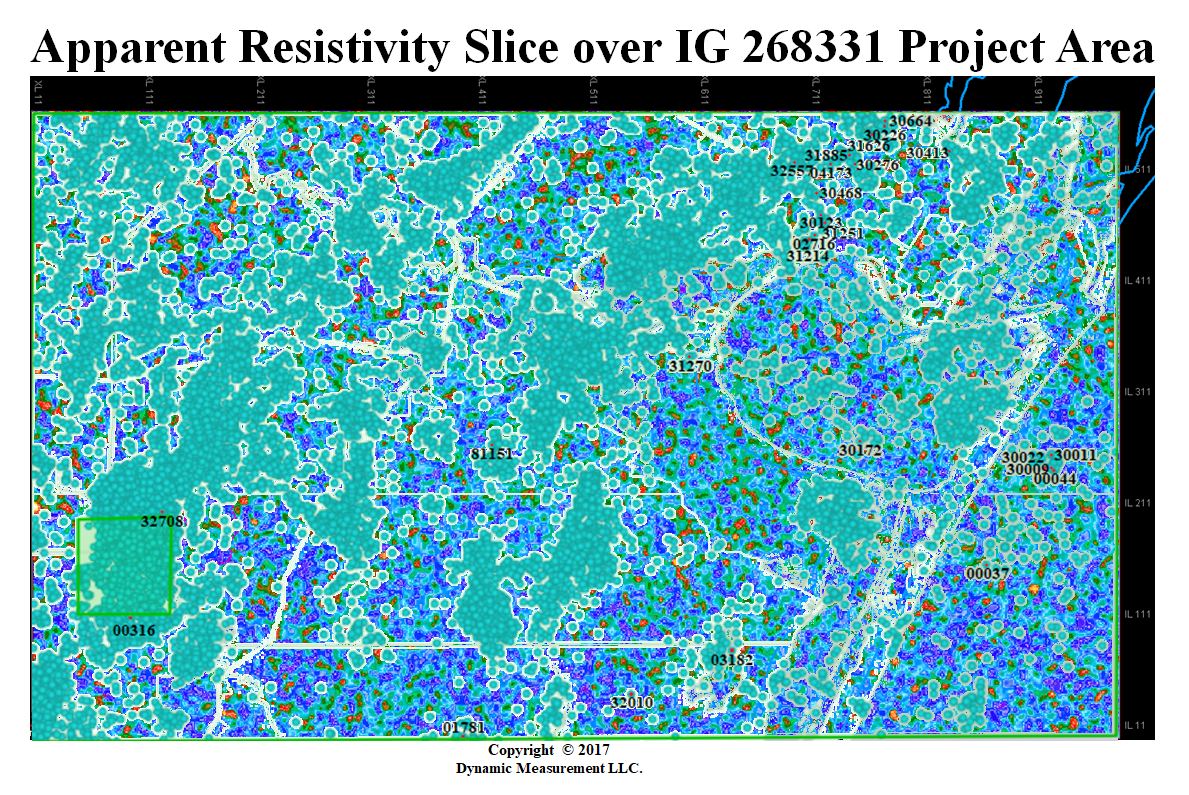
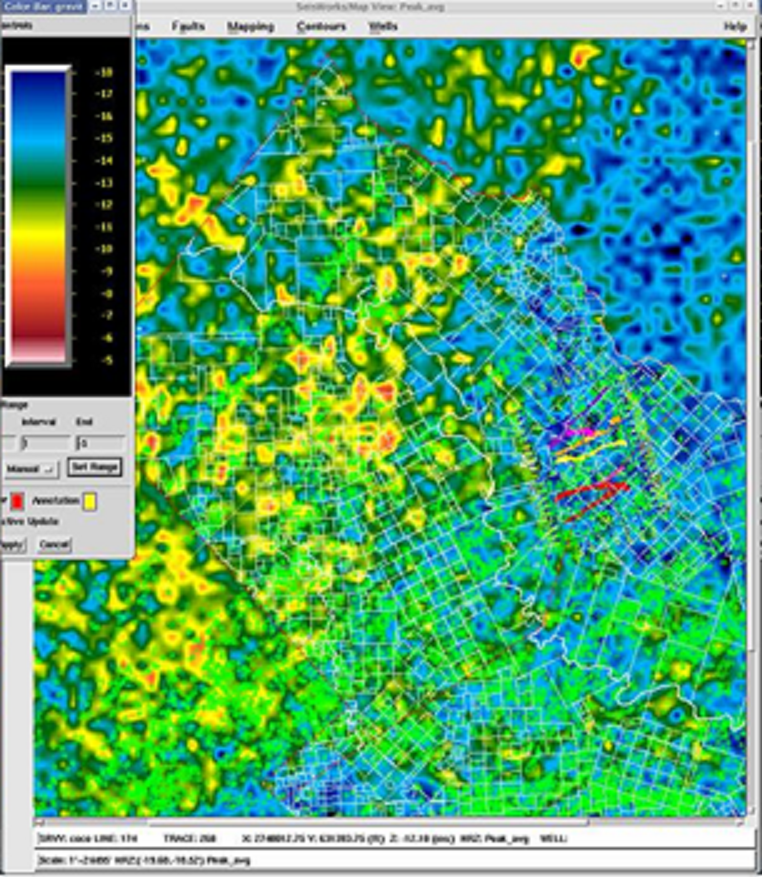
268331 with Stratton Field in southwest | Resistivity Horizontal-Slice through 268331 |
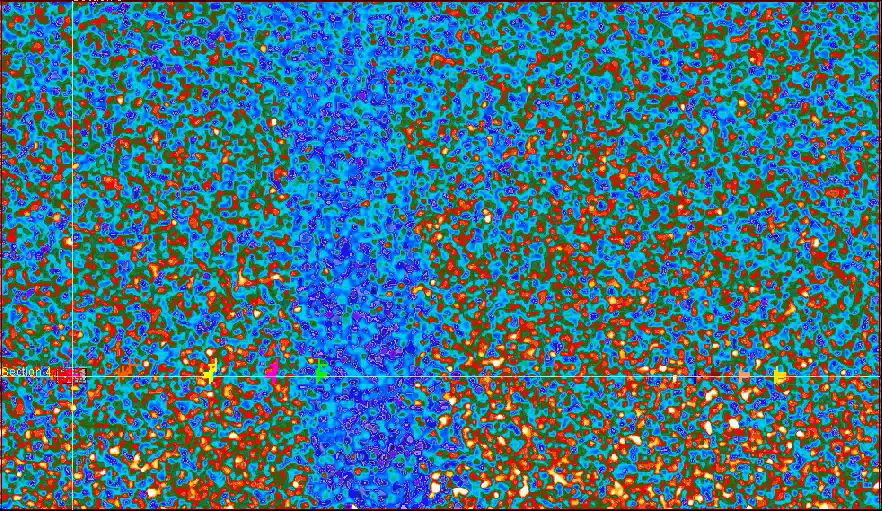
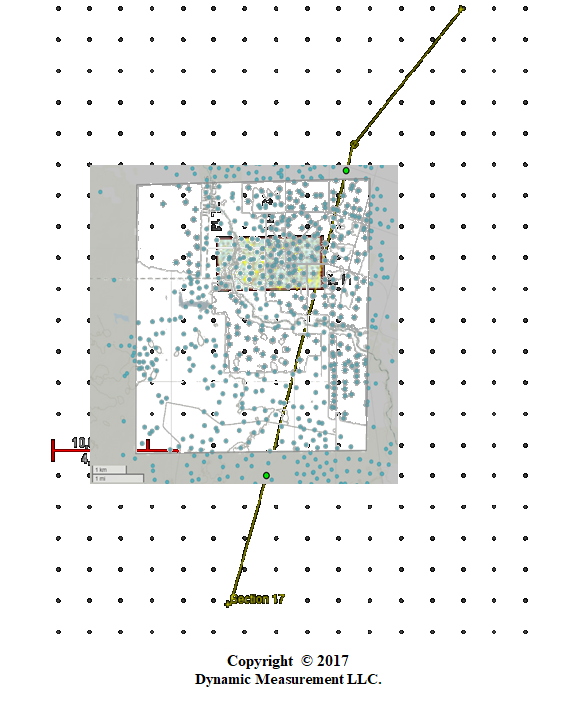
IG-4 Lablels (less 2683 prefix) for cell 268331 | Close-Up on Stratton Field in 26833112-13 |
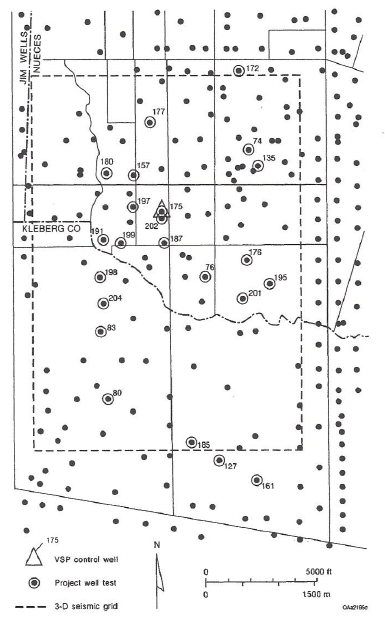
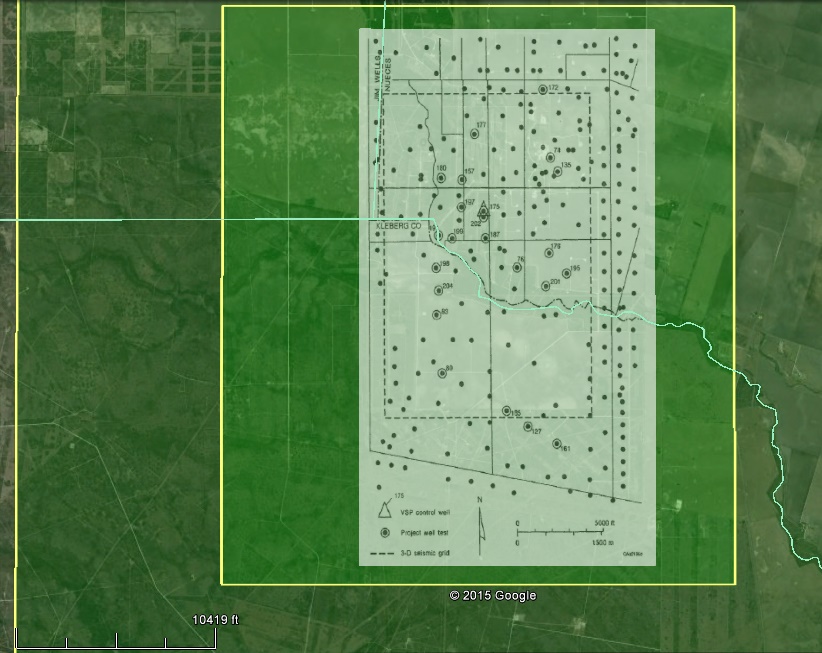
Stratton Field Map showing released wells | Stratton Field Map inside area of lightning analysis |
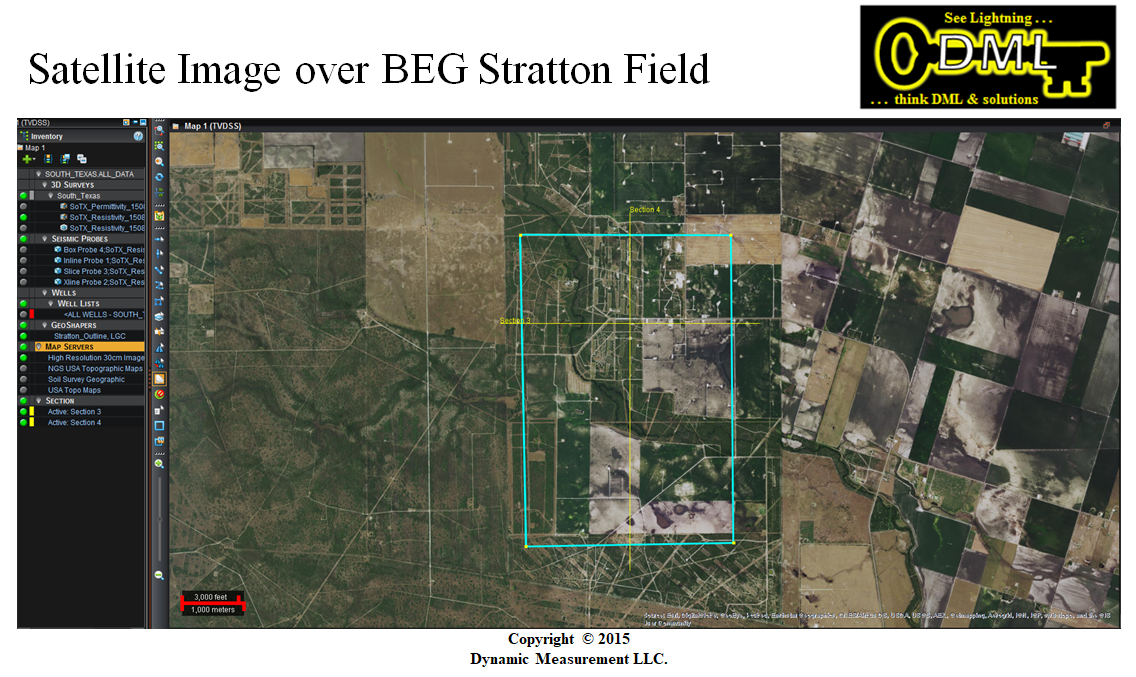
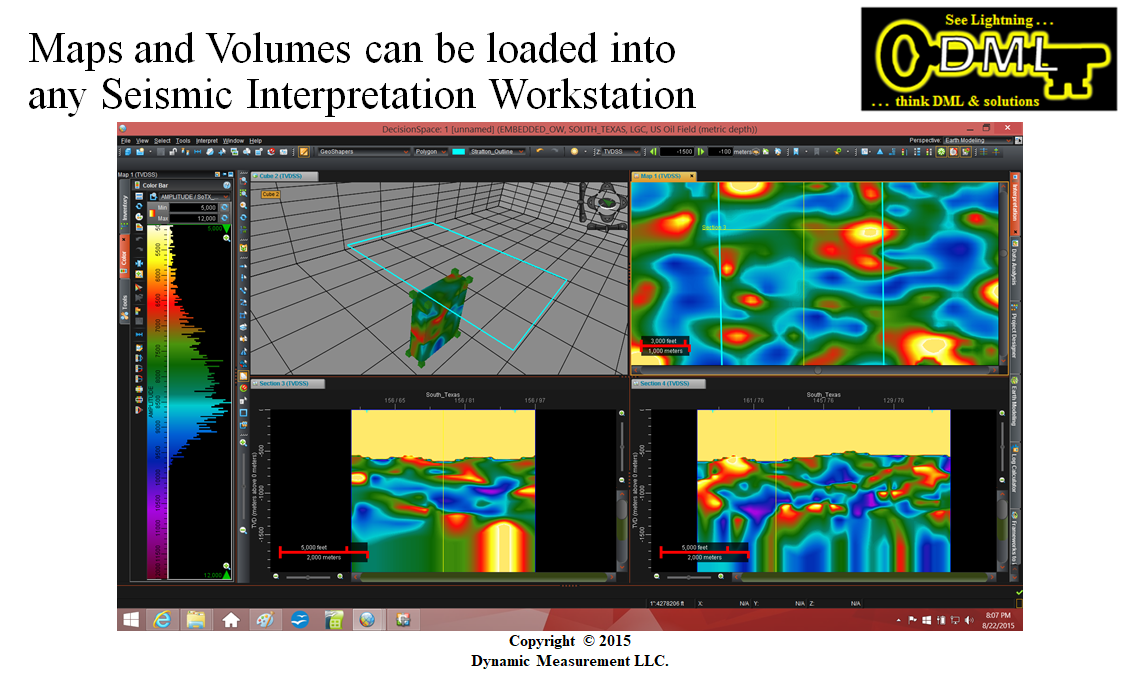
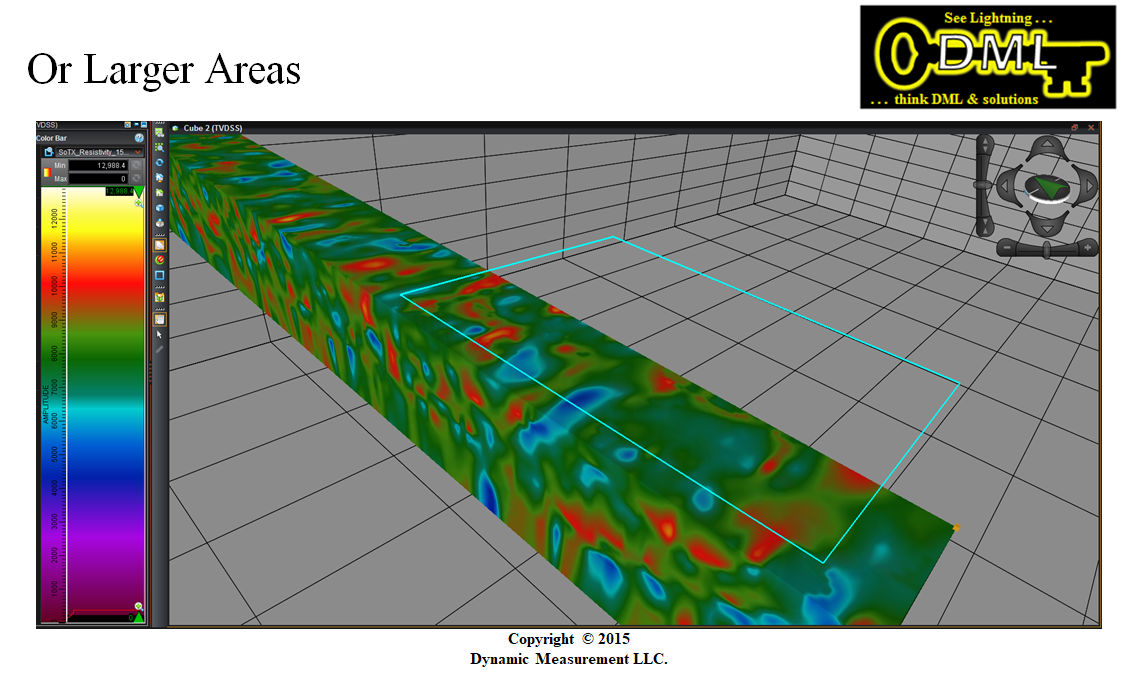
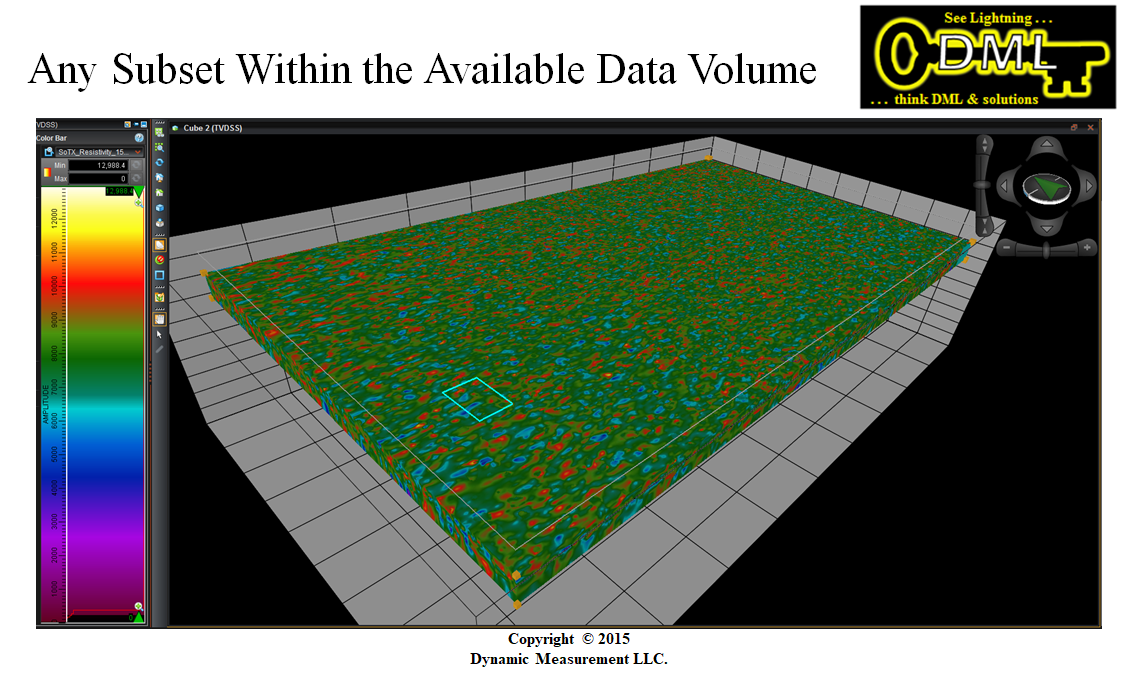
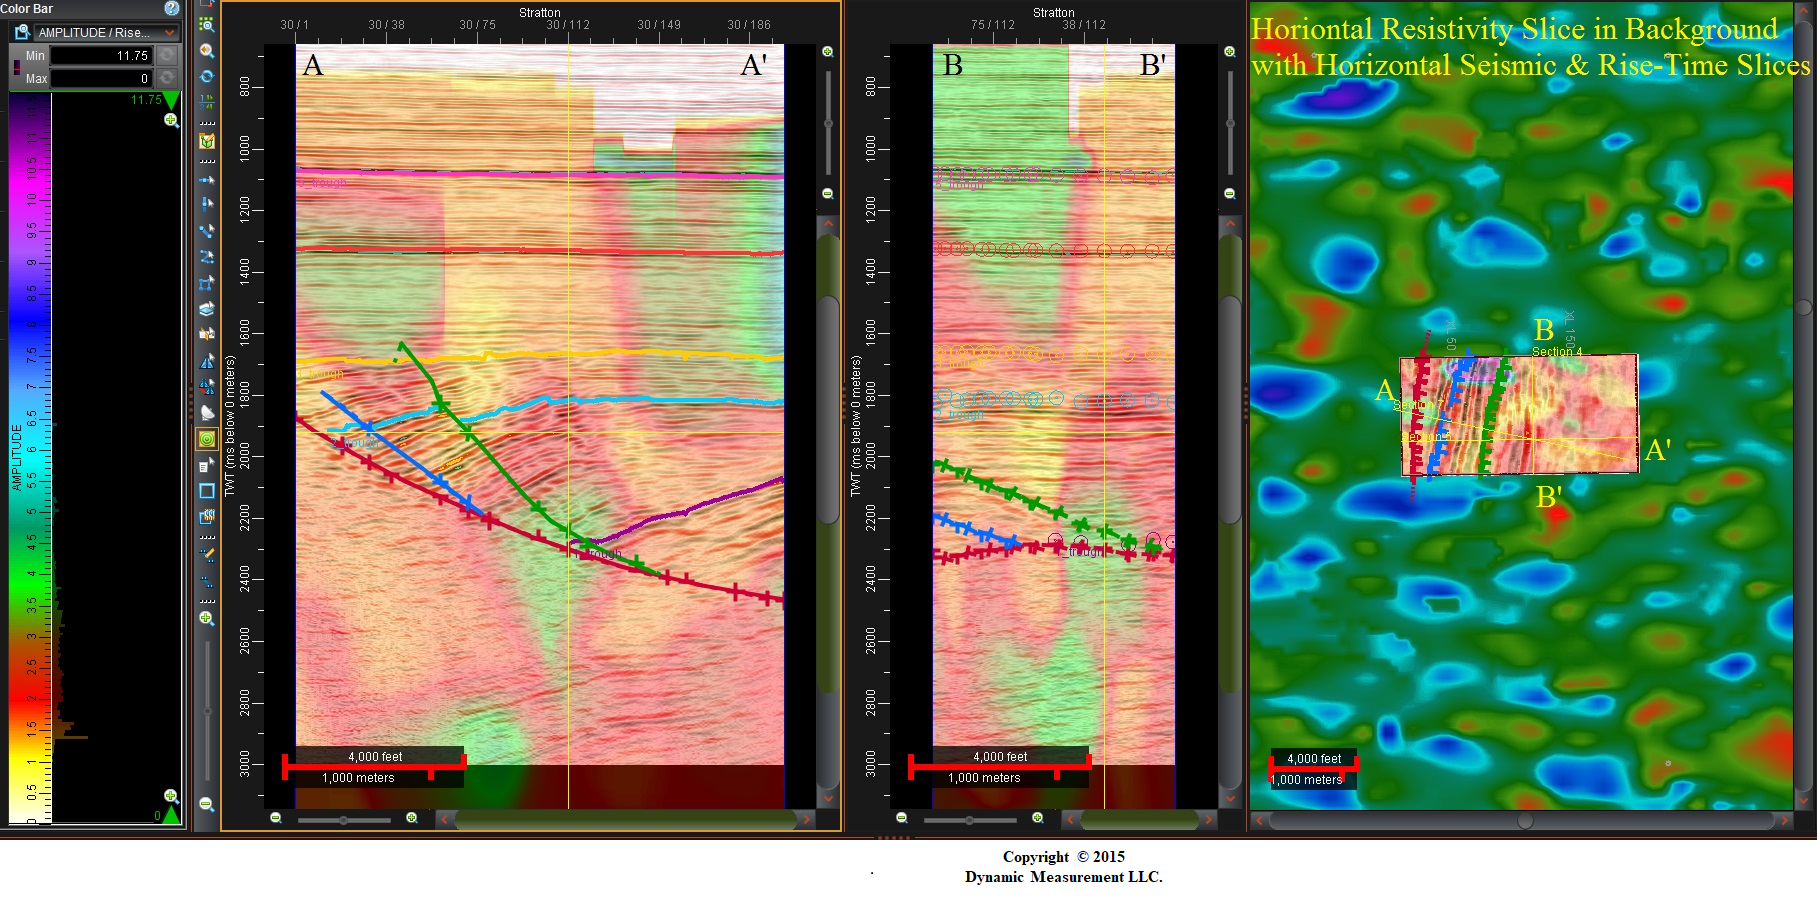
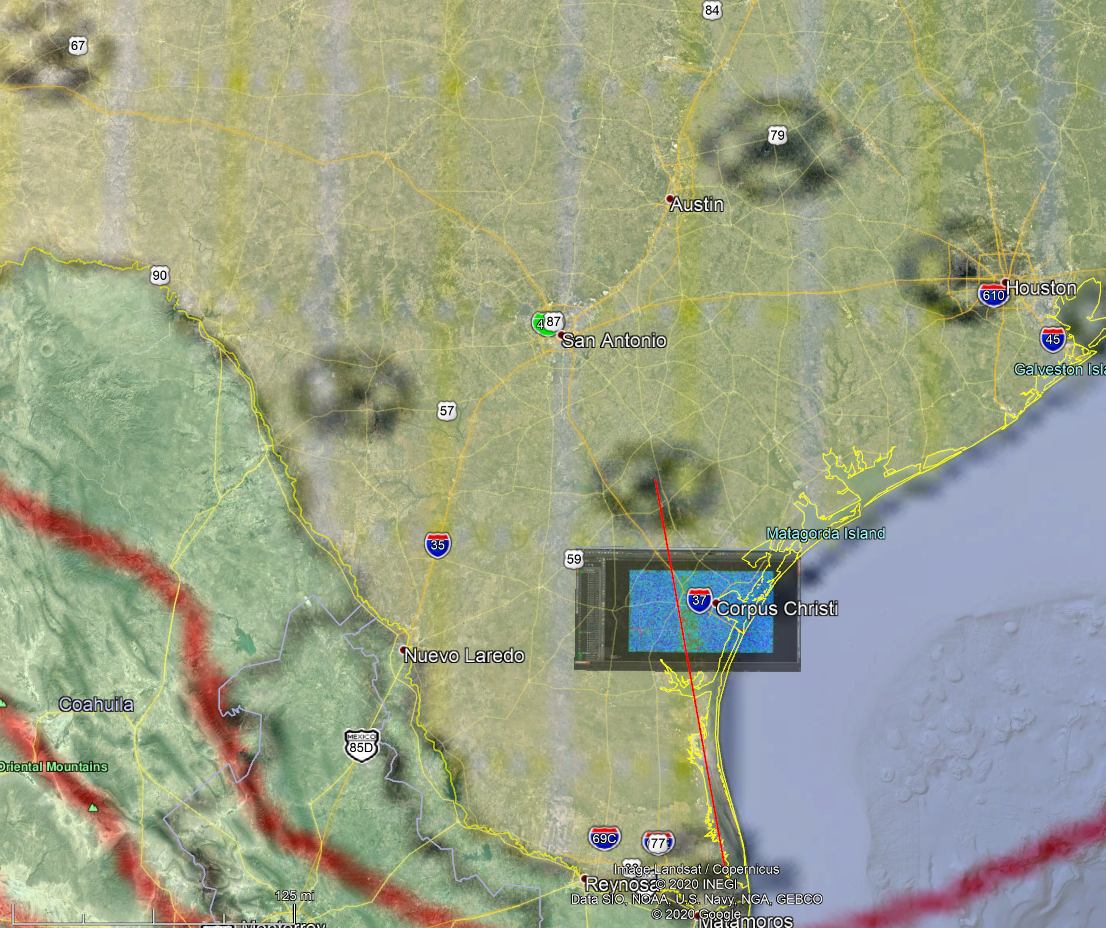
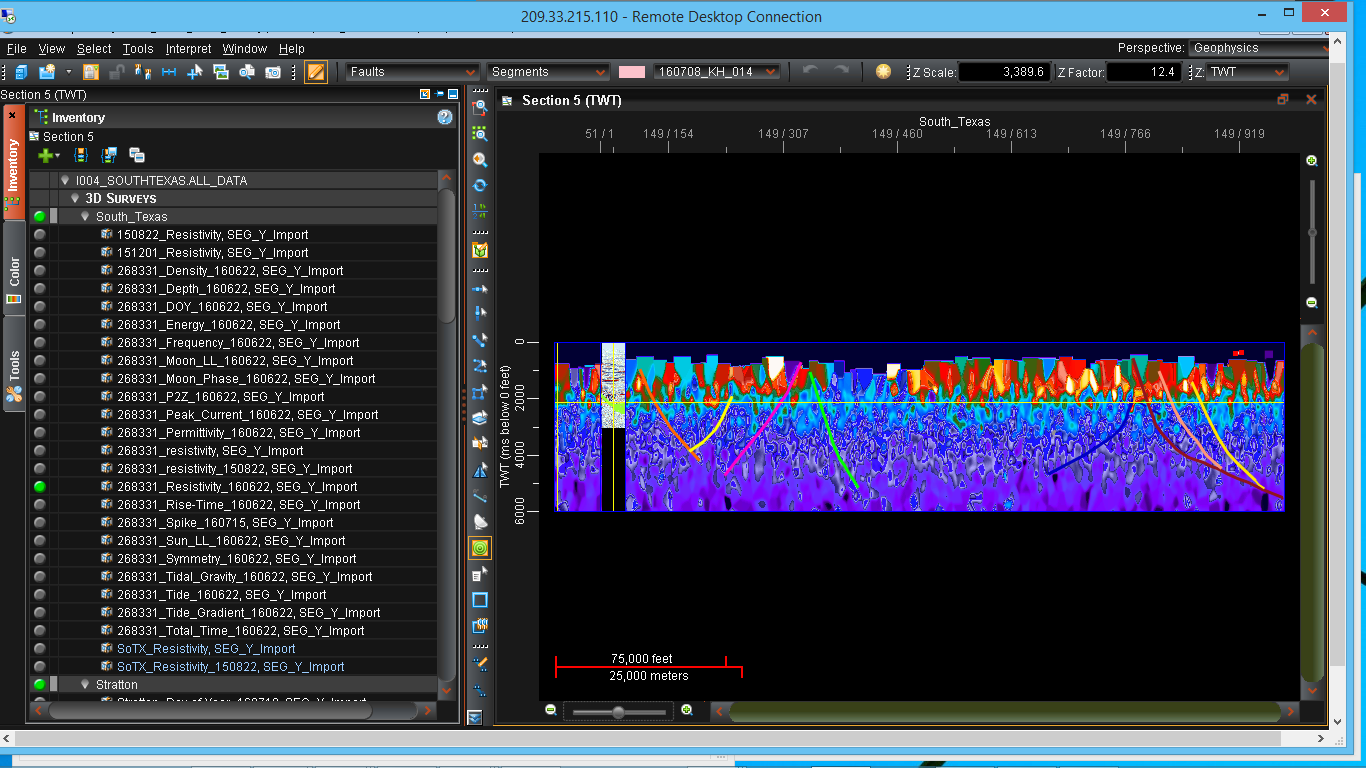
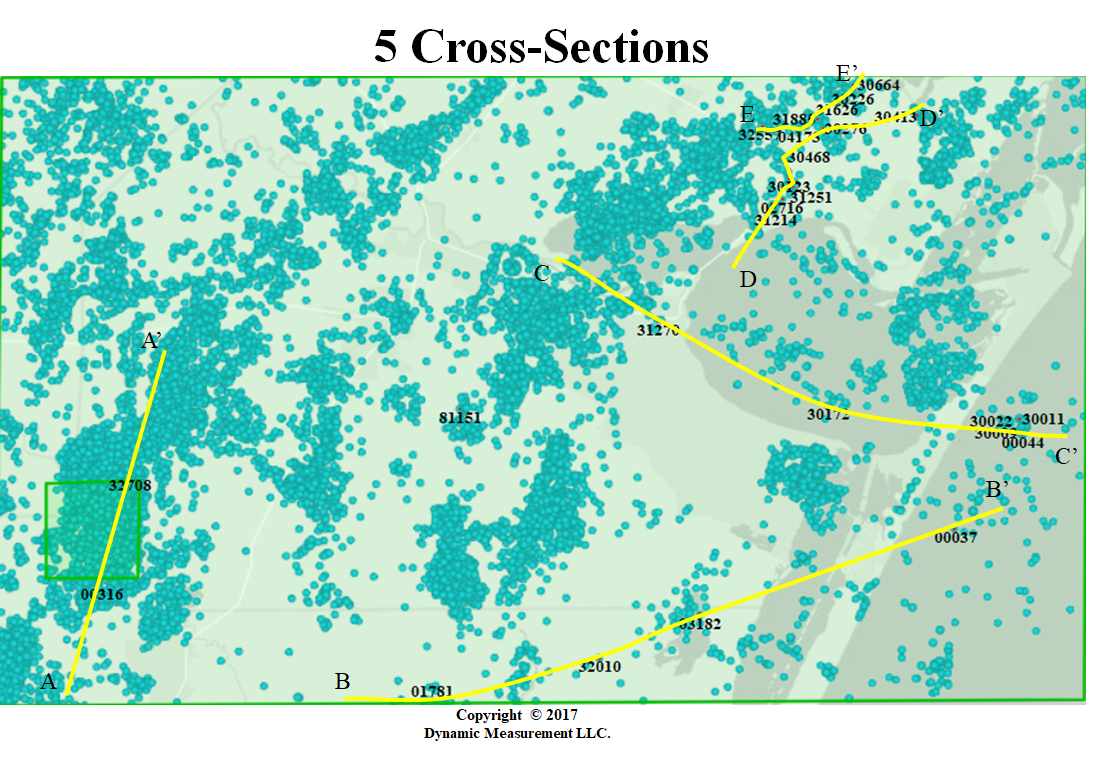
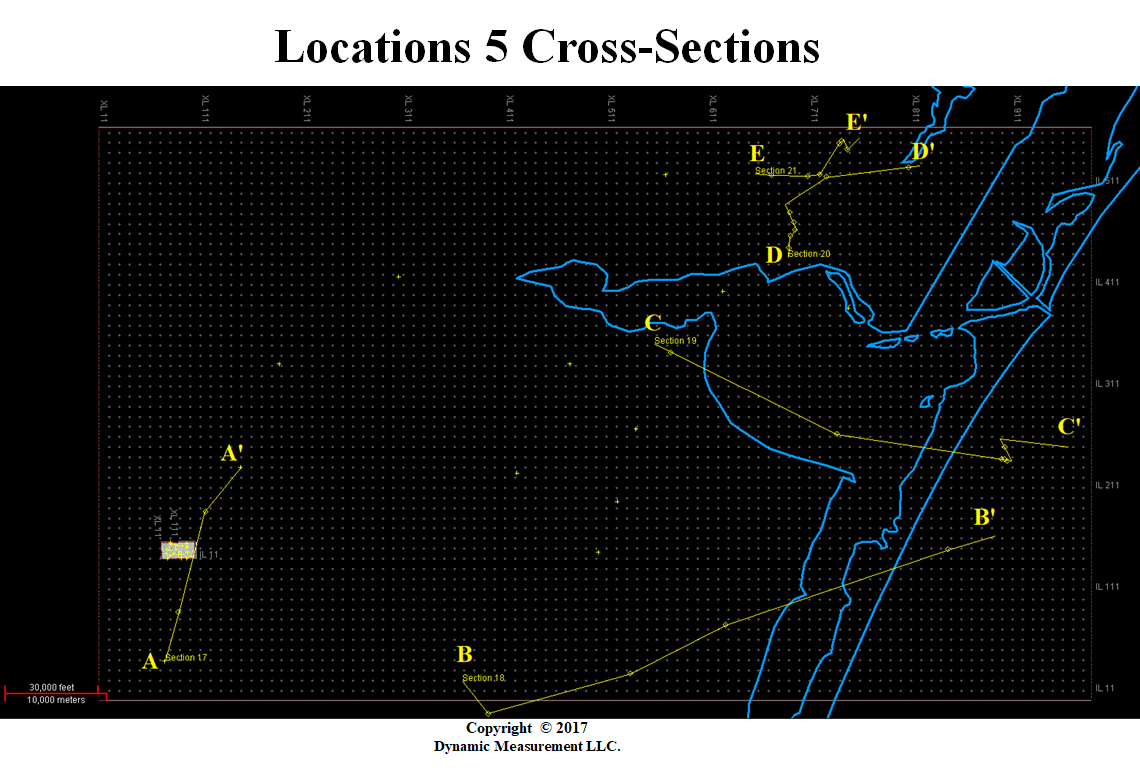
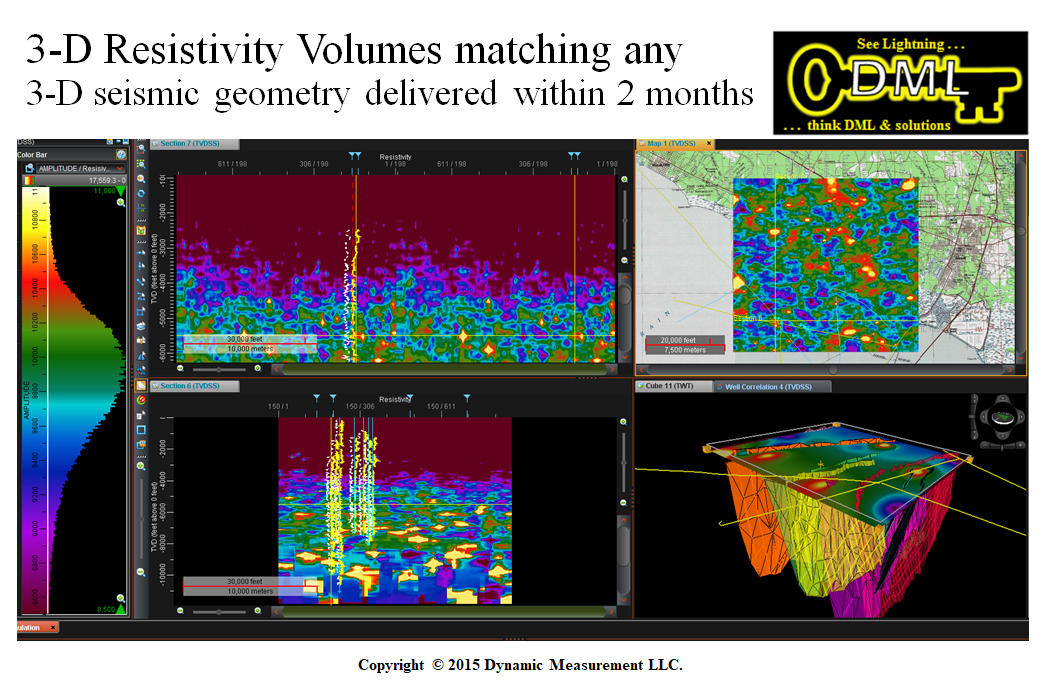
Satellite Image over BEG Stratton Field Data | Stratton probe cube, map, & cross-sections |
 |  |
 |  |
 |  |
 |  |
 |  |
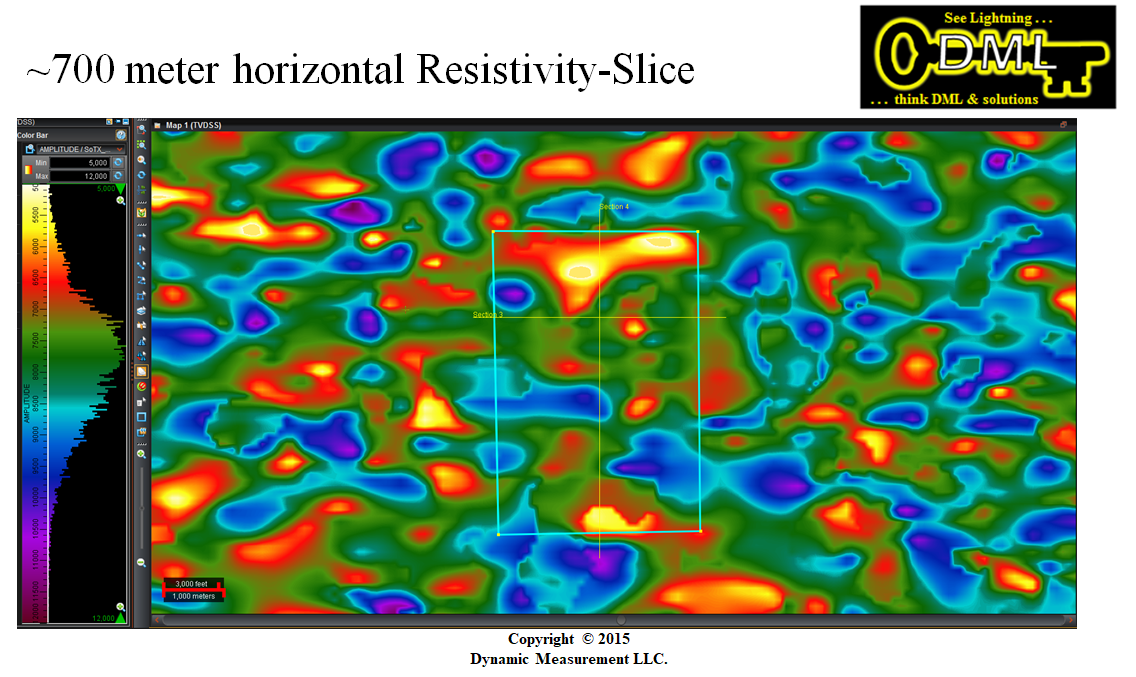
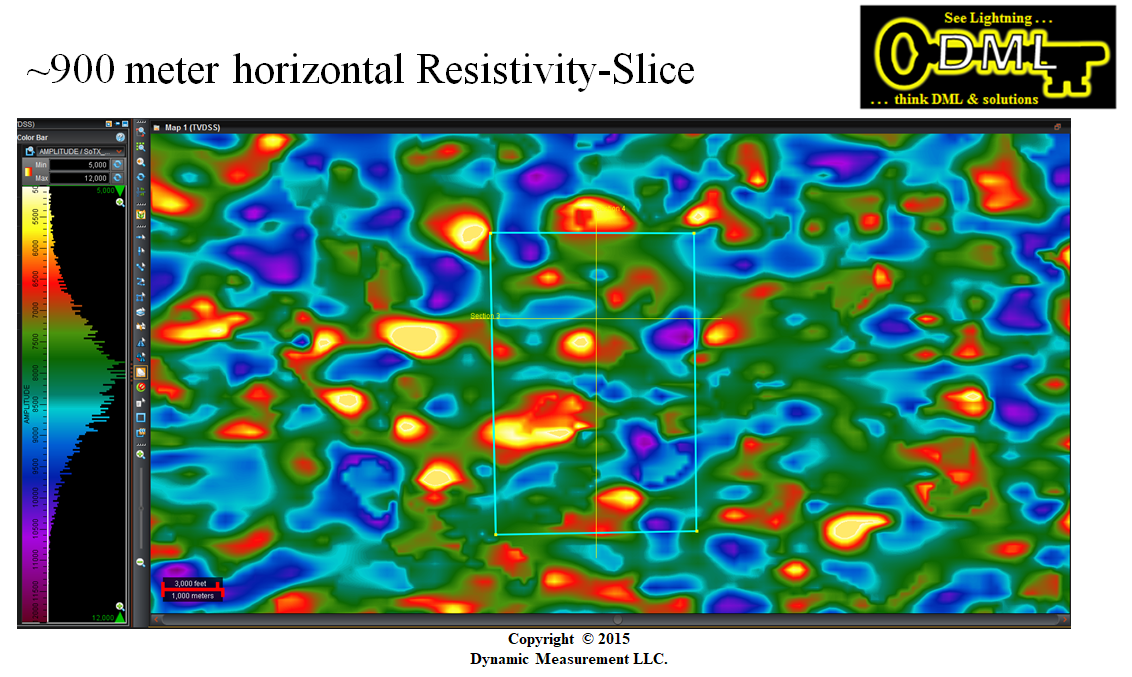
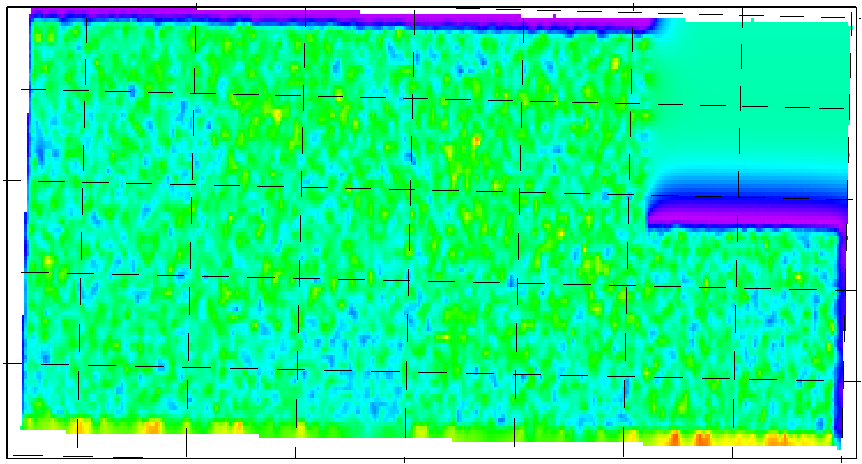
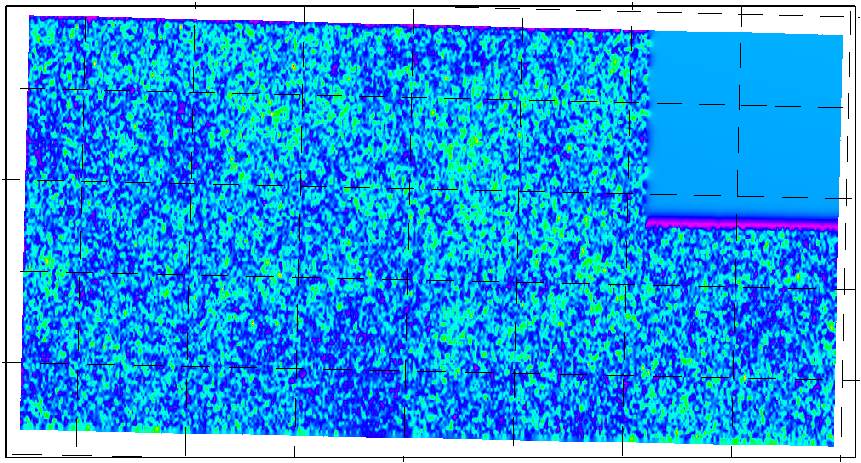
| ~700 meter Resistivity horizontal-slice | ~900 meter Resistivity horizontal-slice |
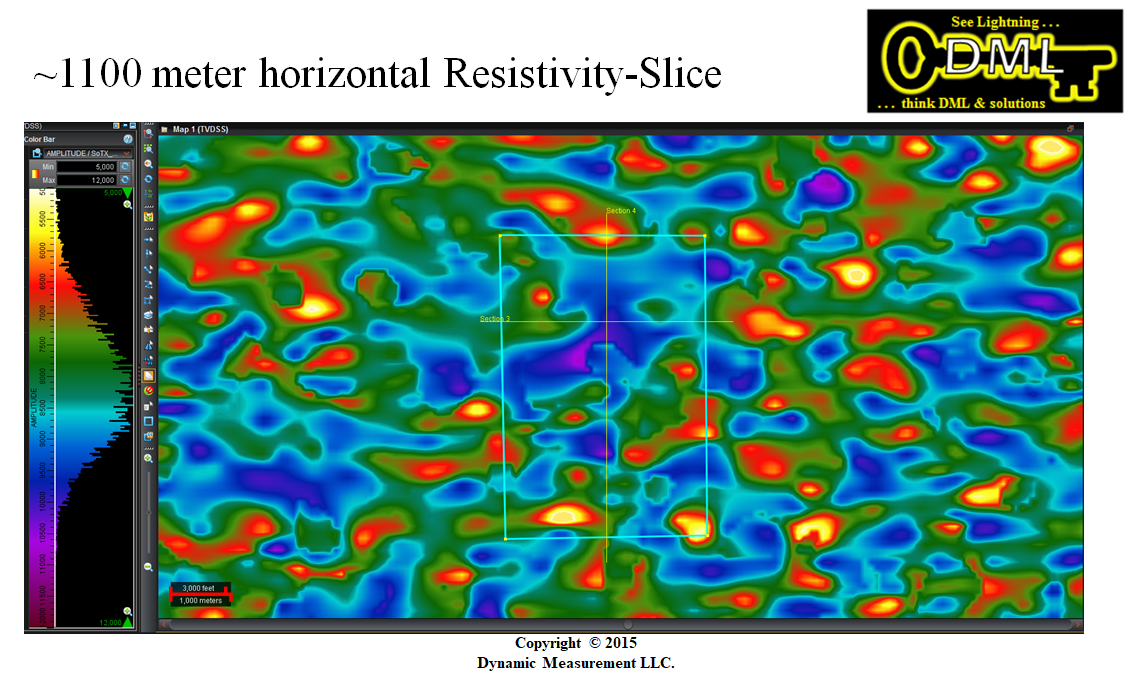
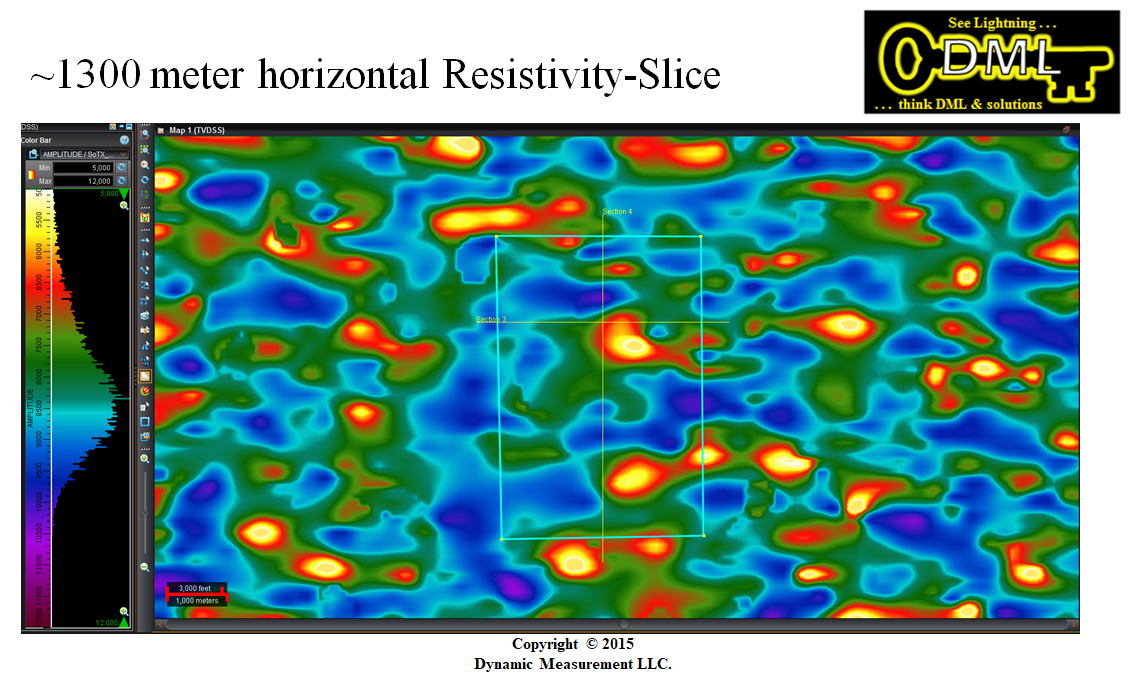
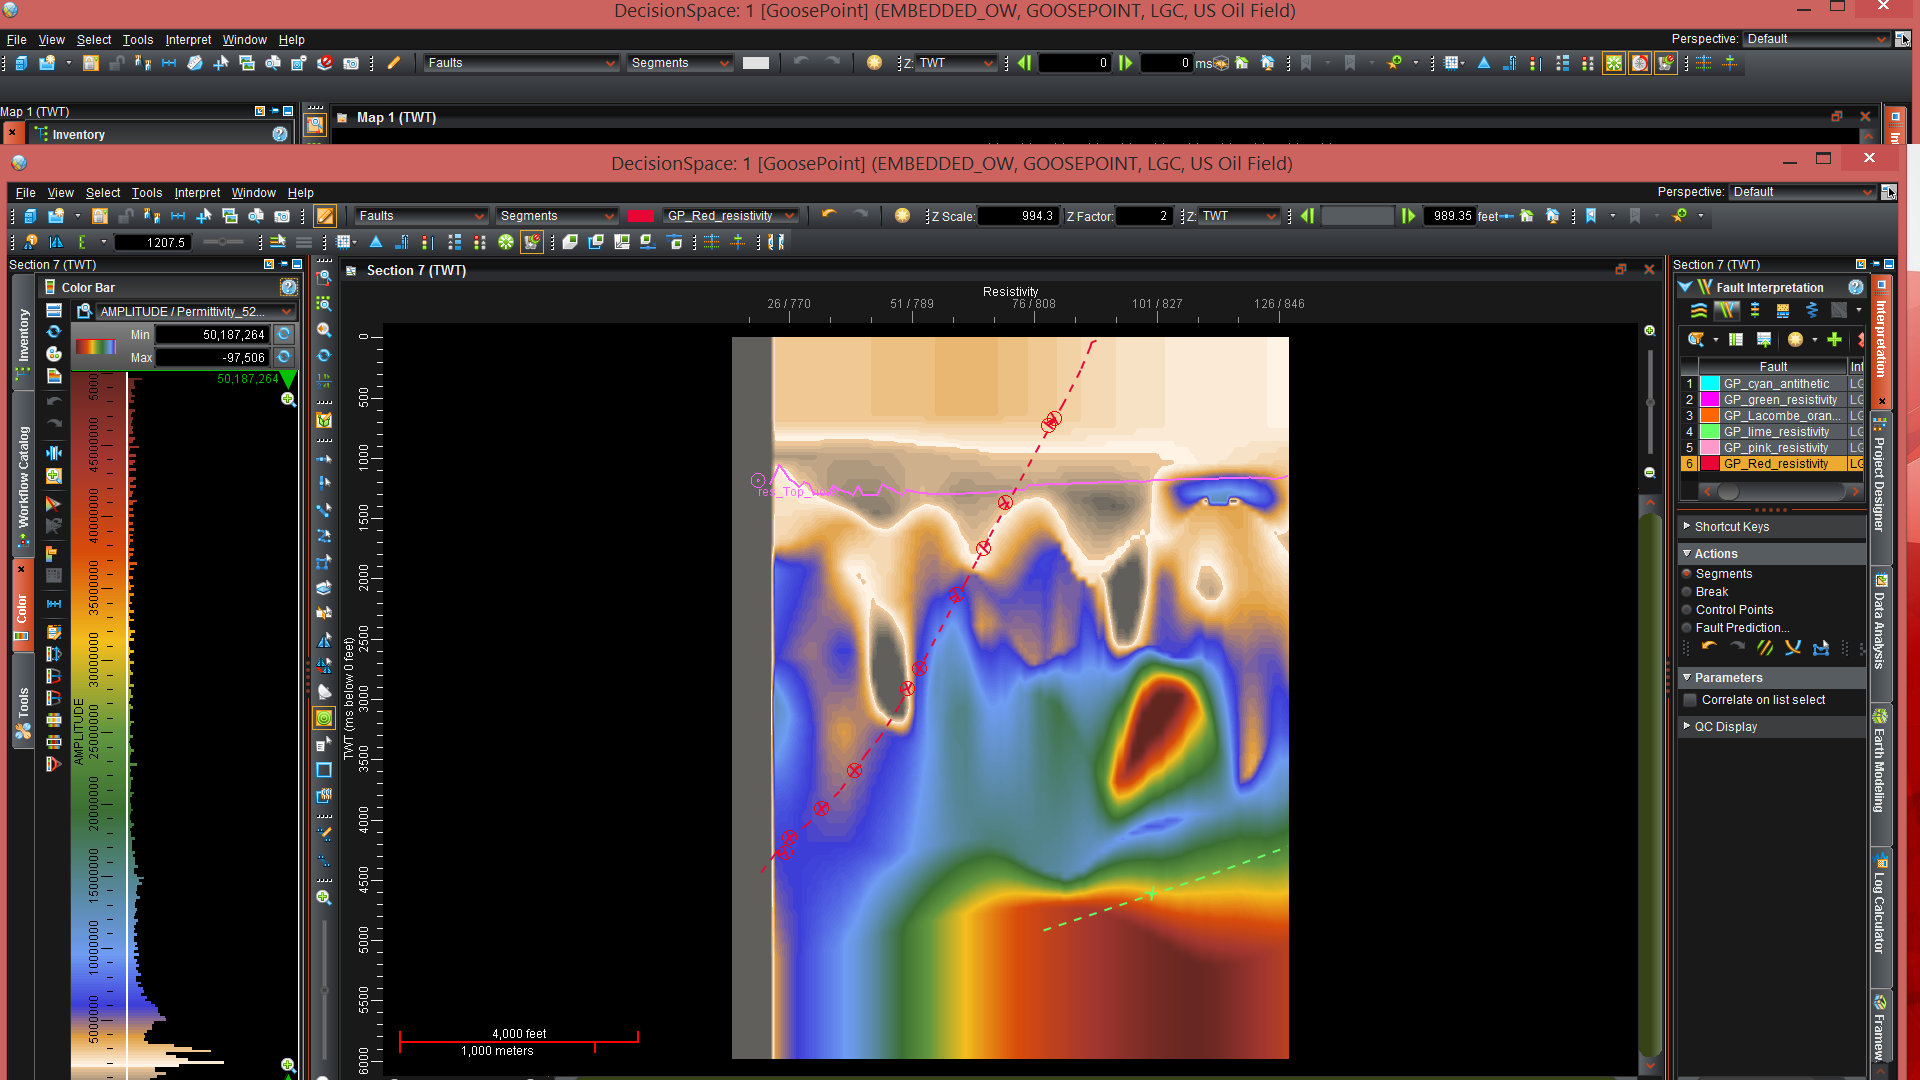
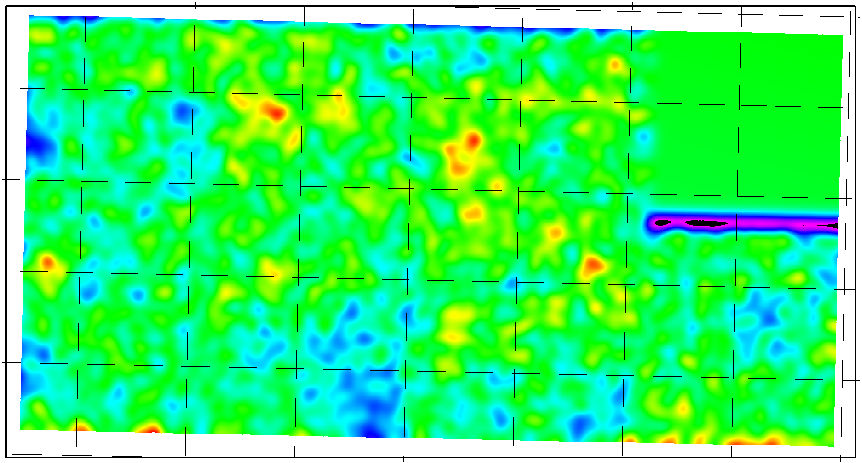
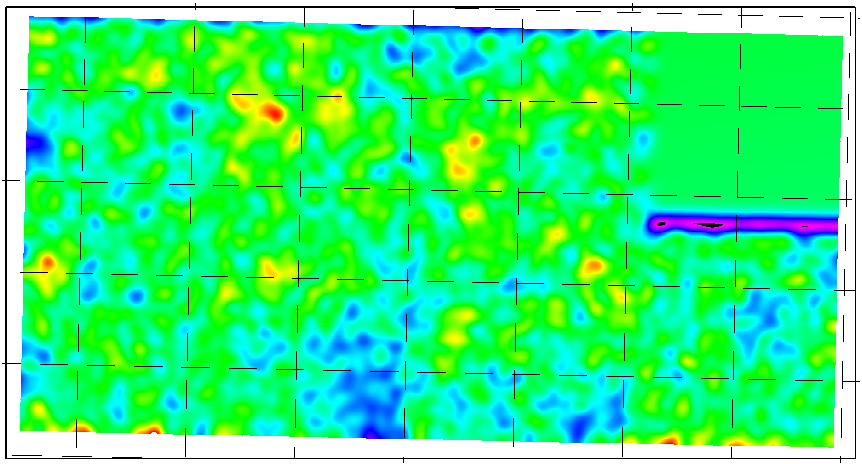
~1,100 meter Resistivity horizontal-slice | ~1,300 meter Resistivity horizontal-slice |
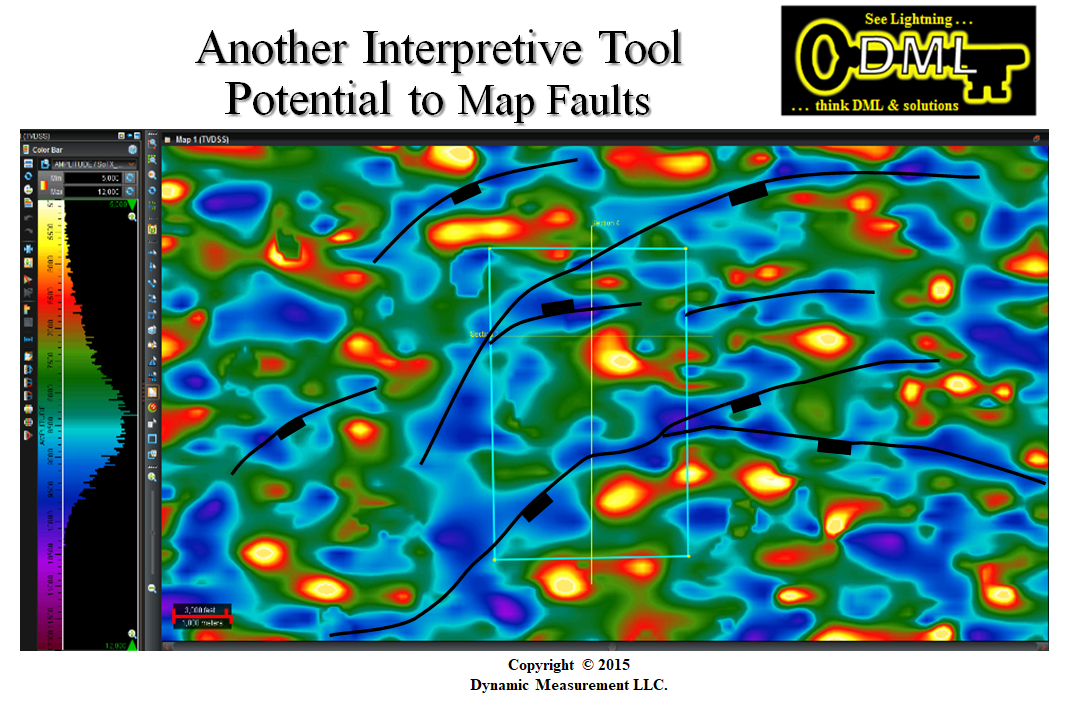
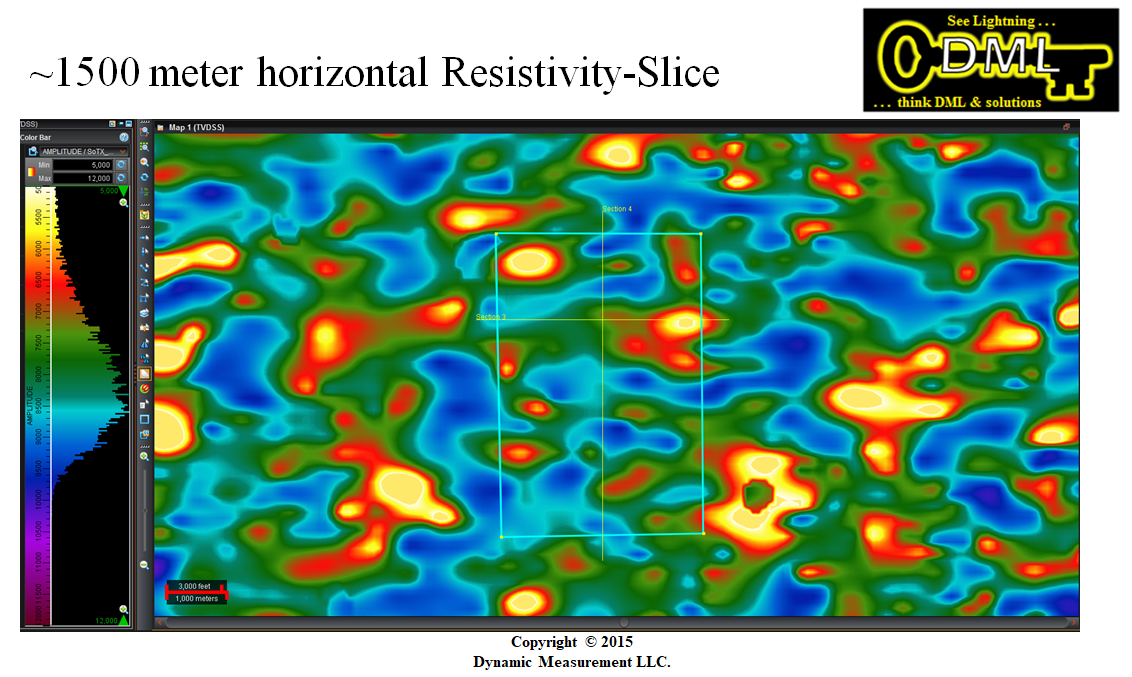
~1,300 meter possible fault interpretation | ~1,500 meter Resistivity horizontal-slice |
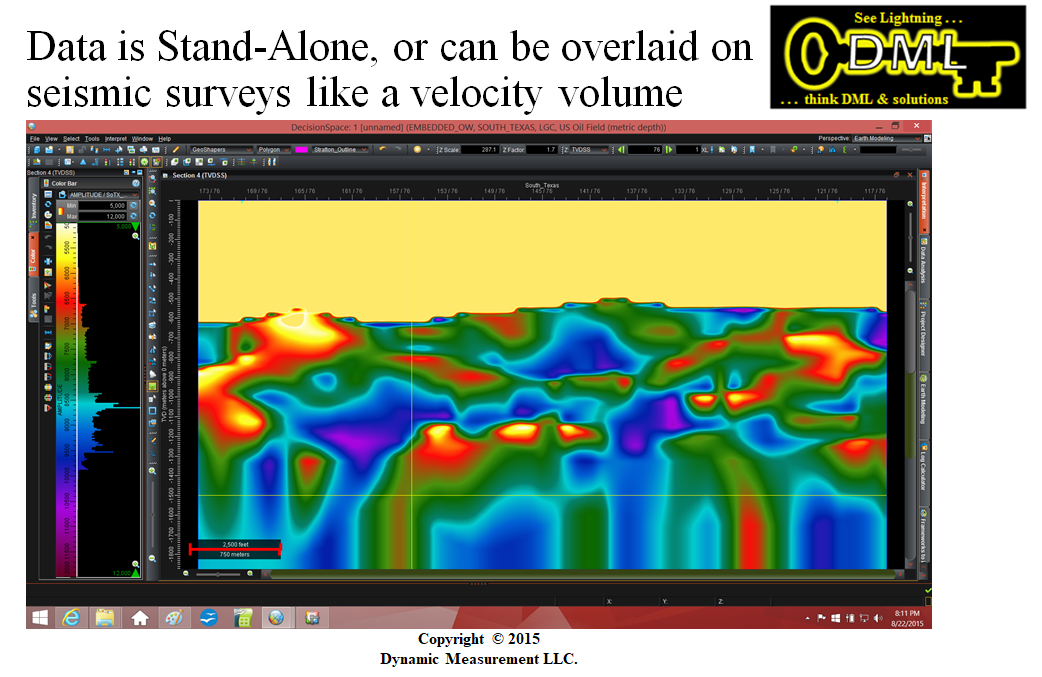
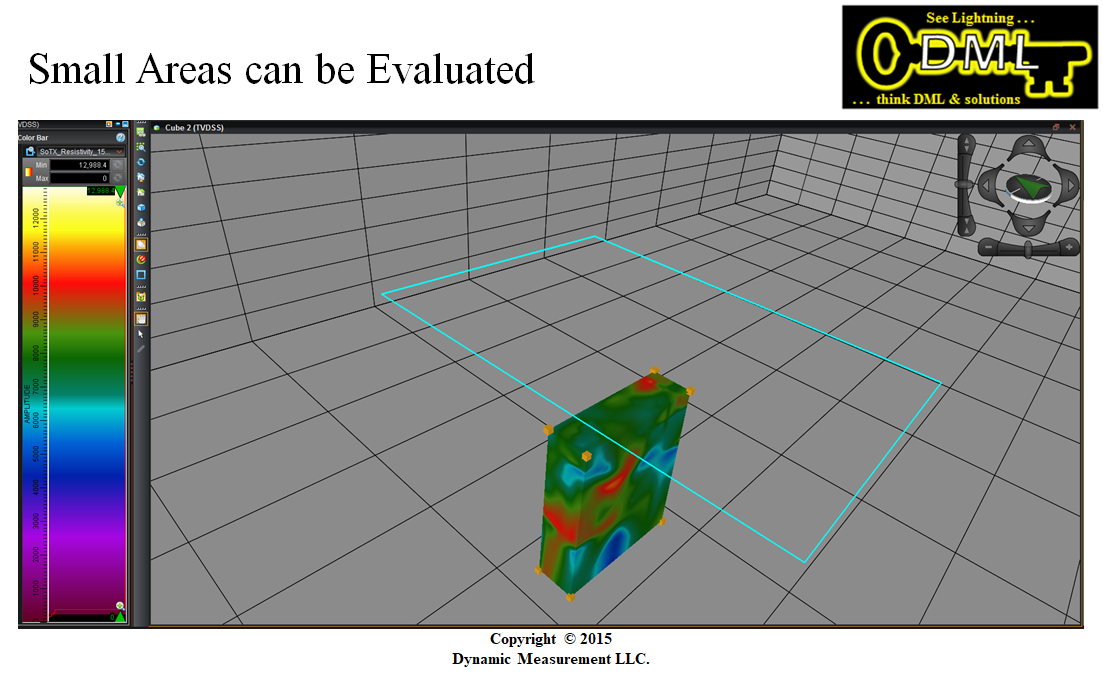
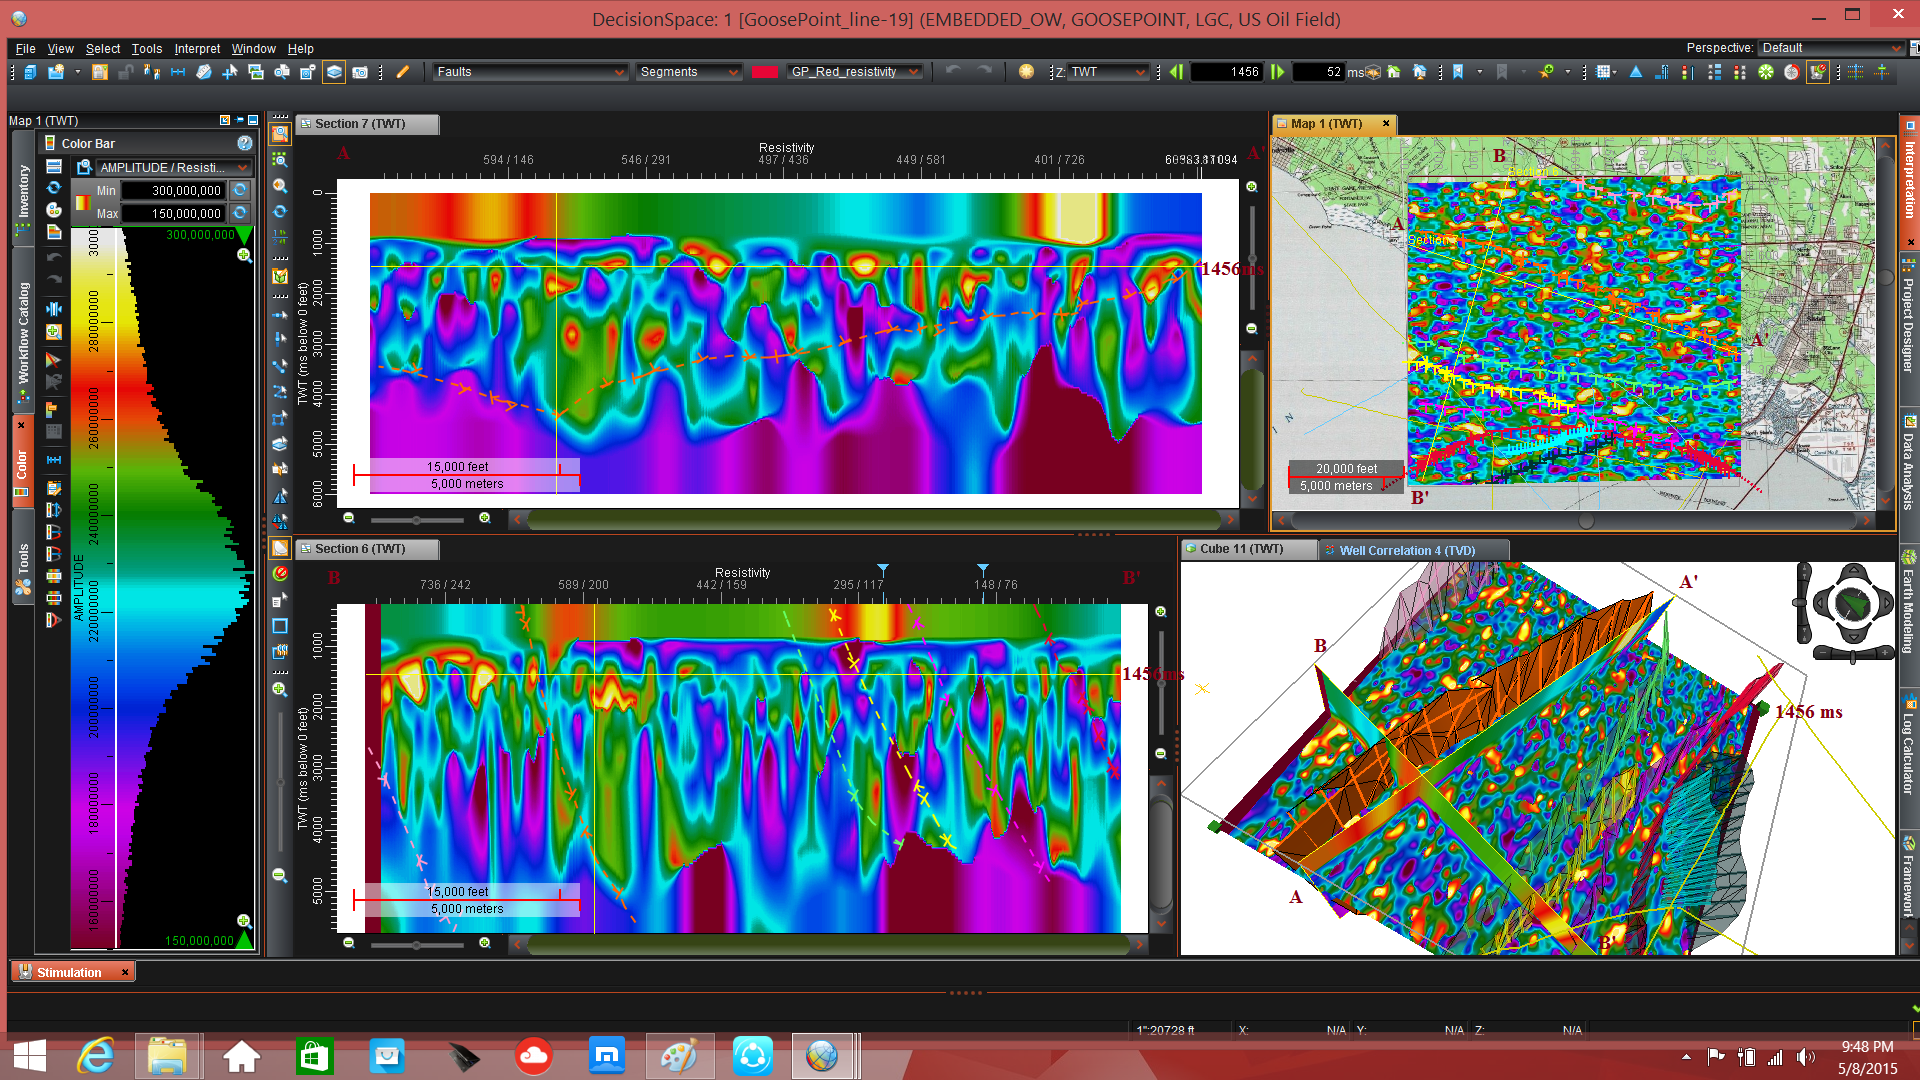
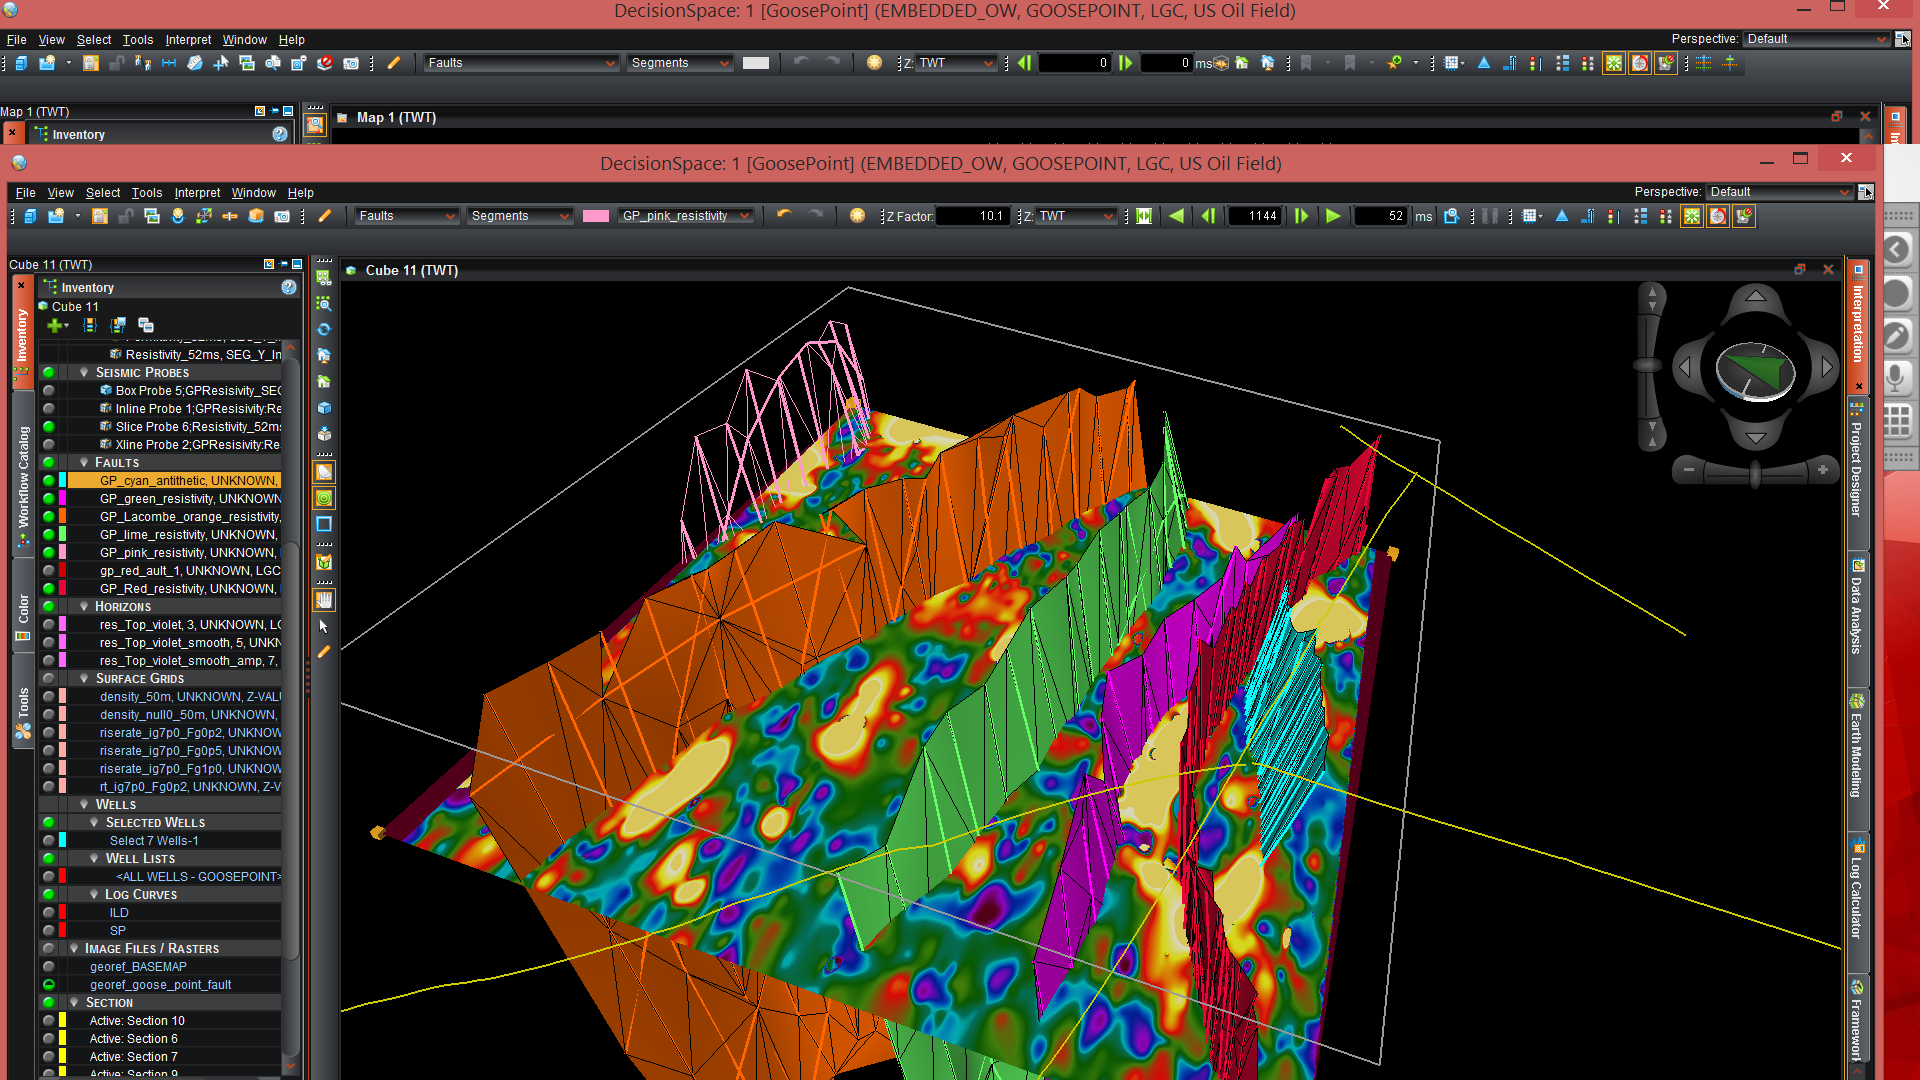
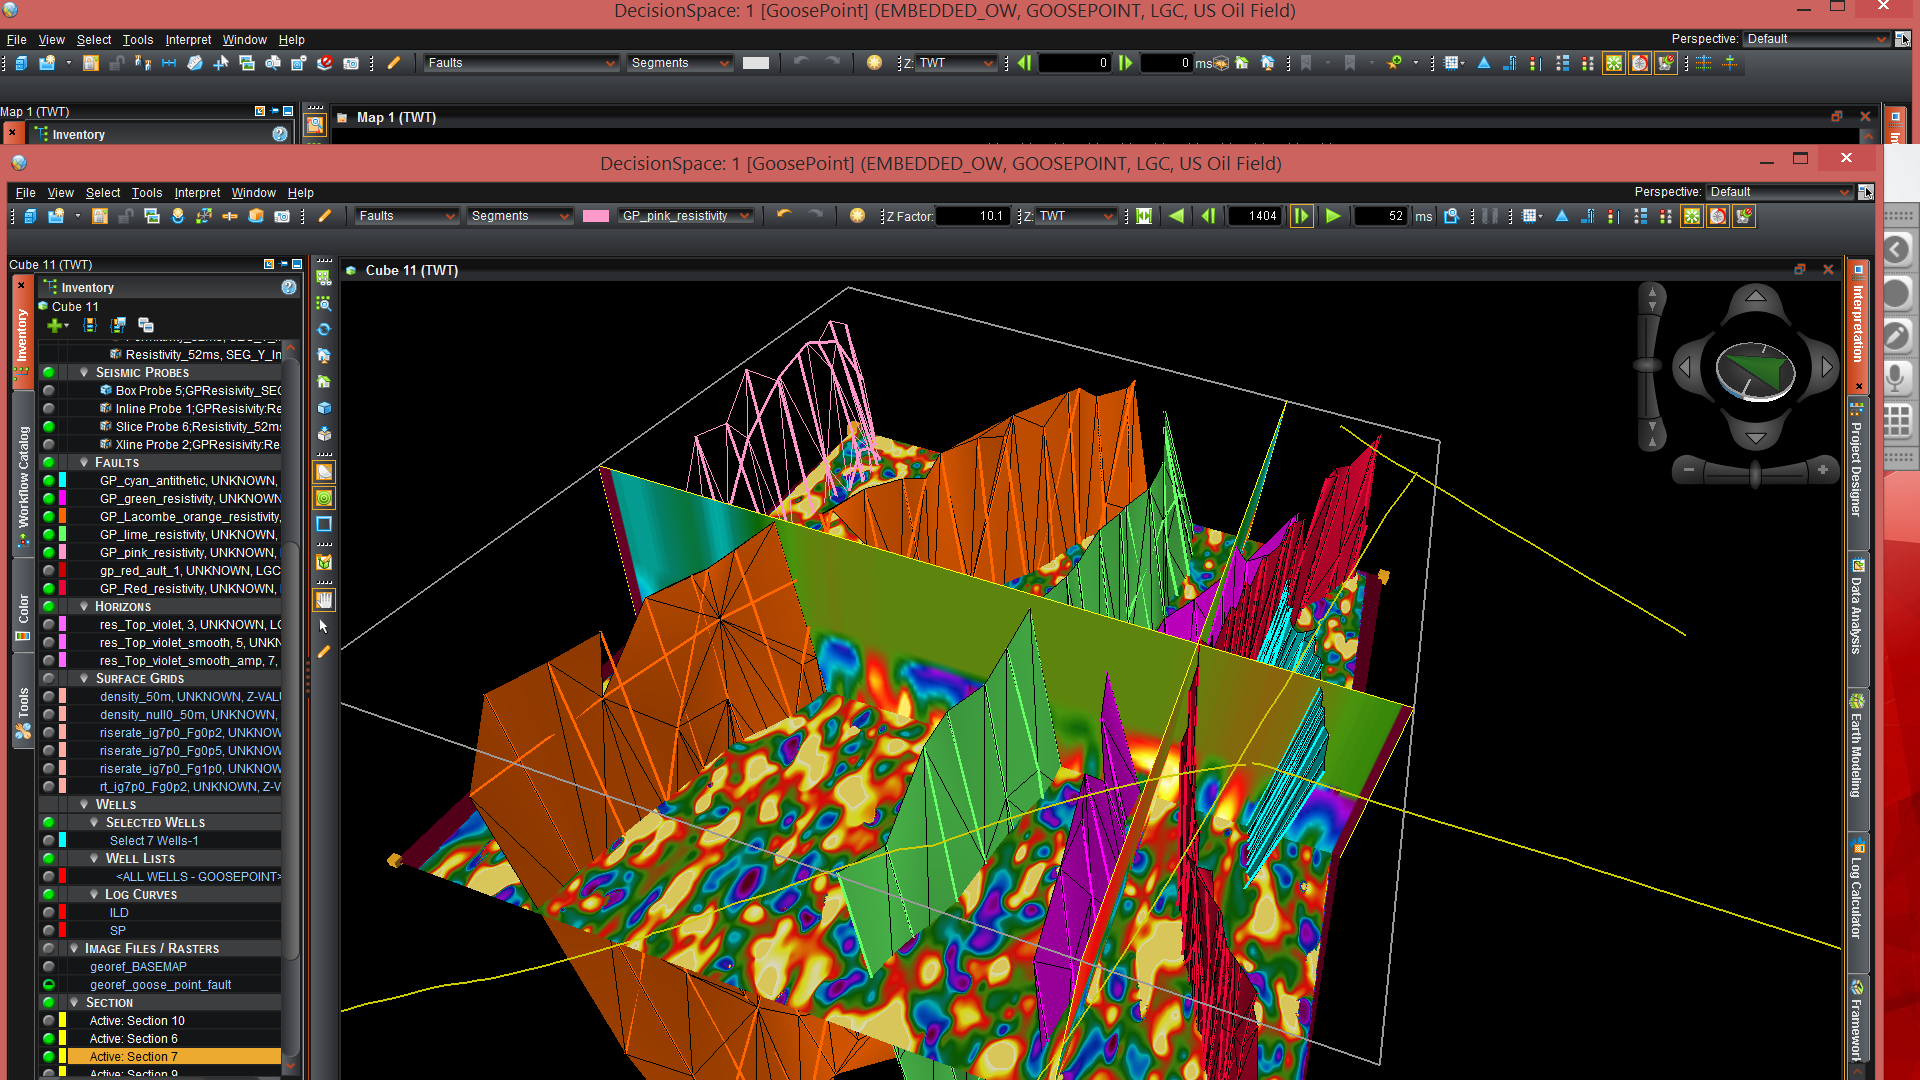
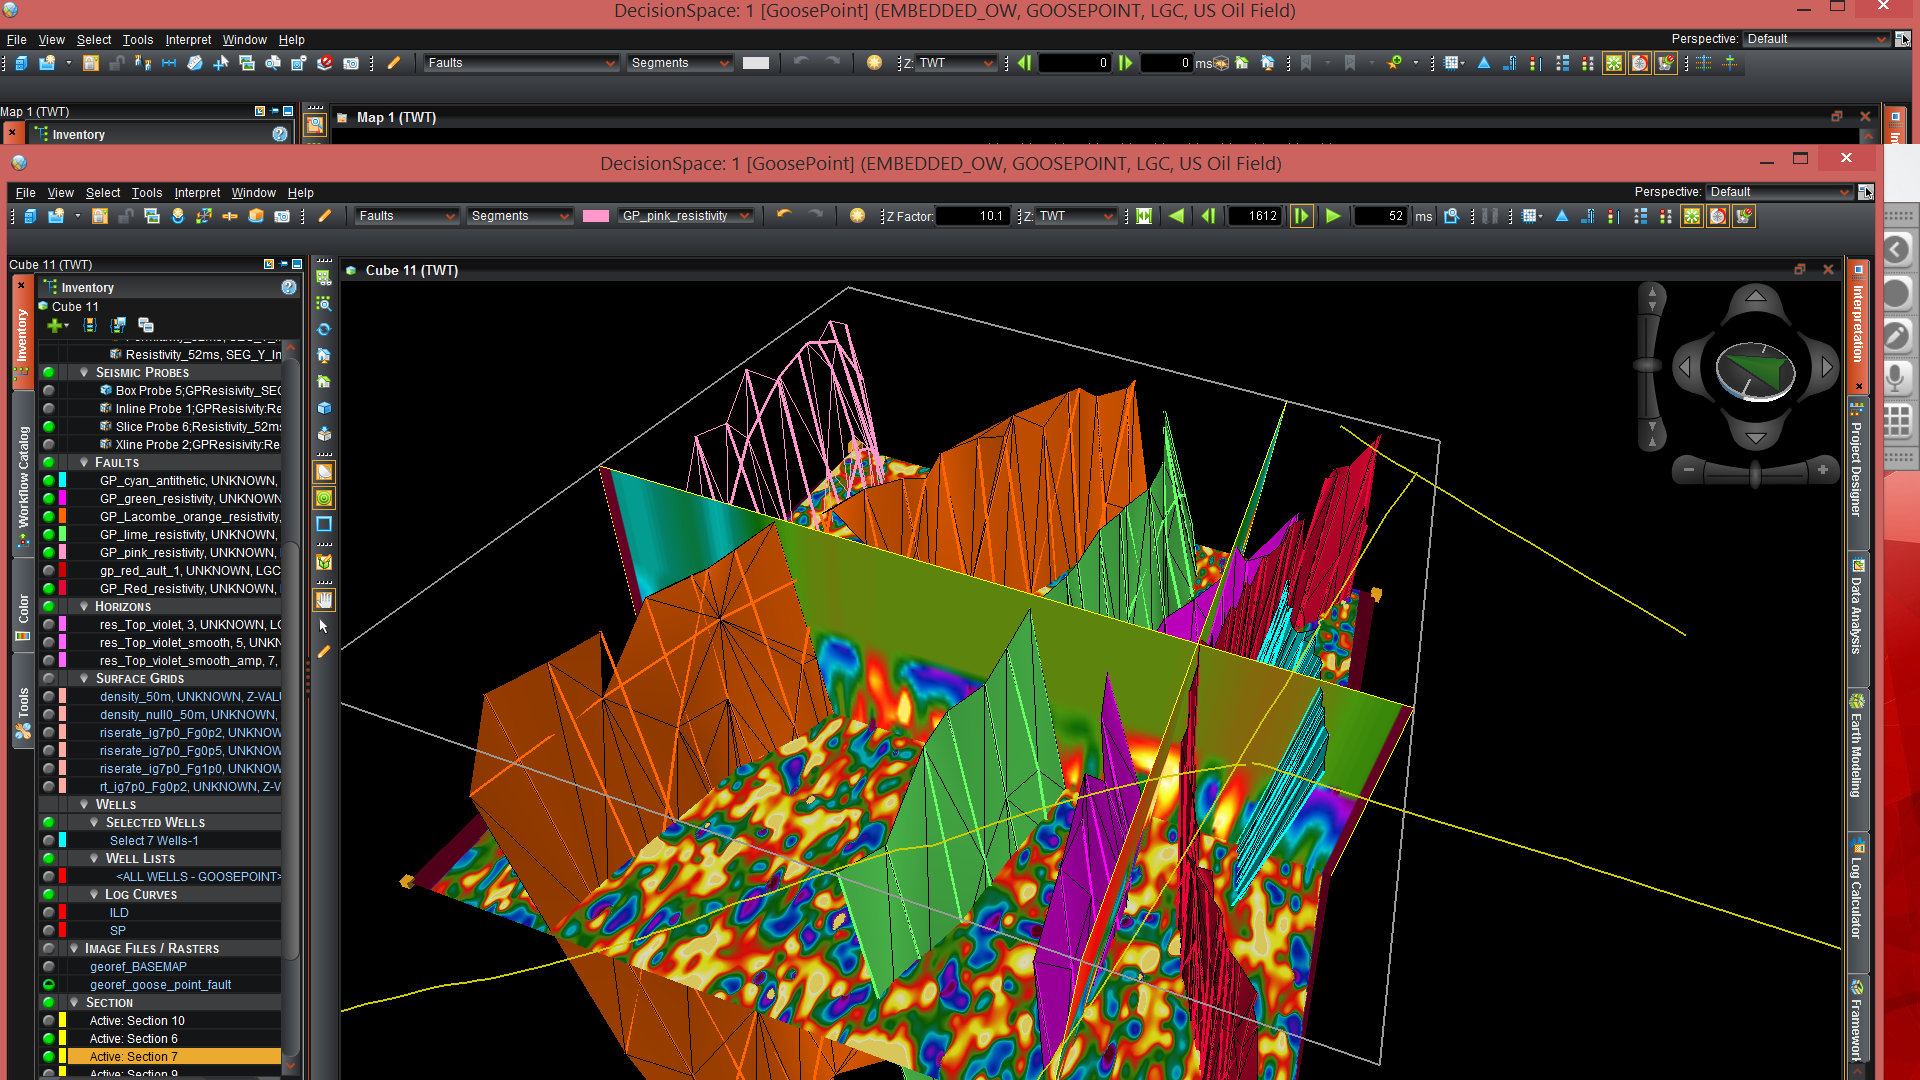
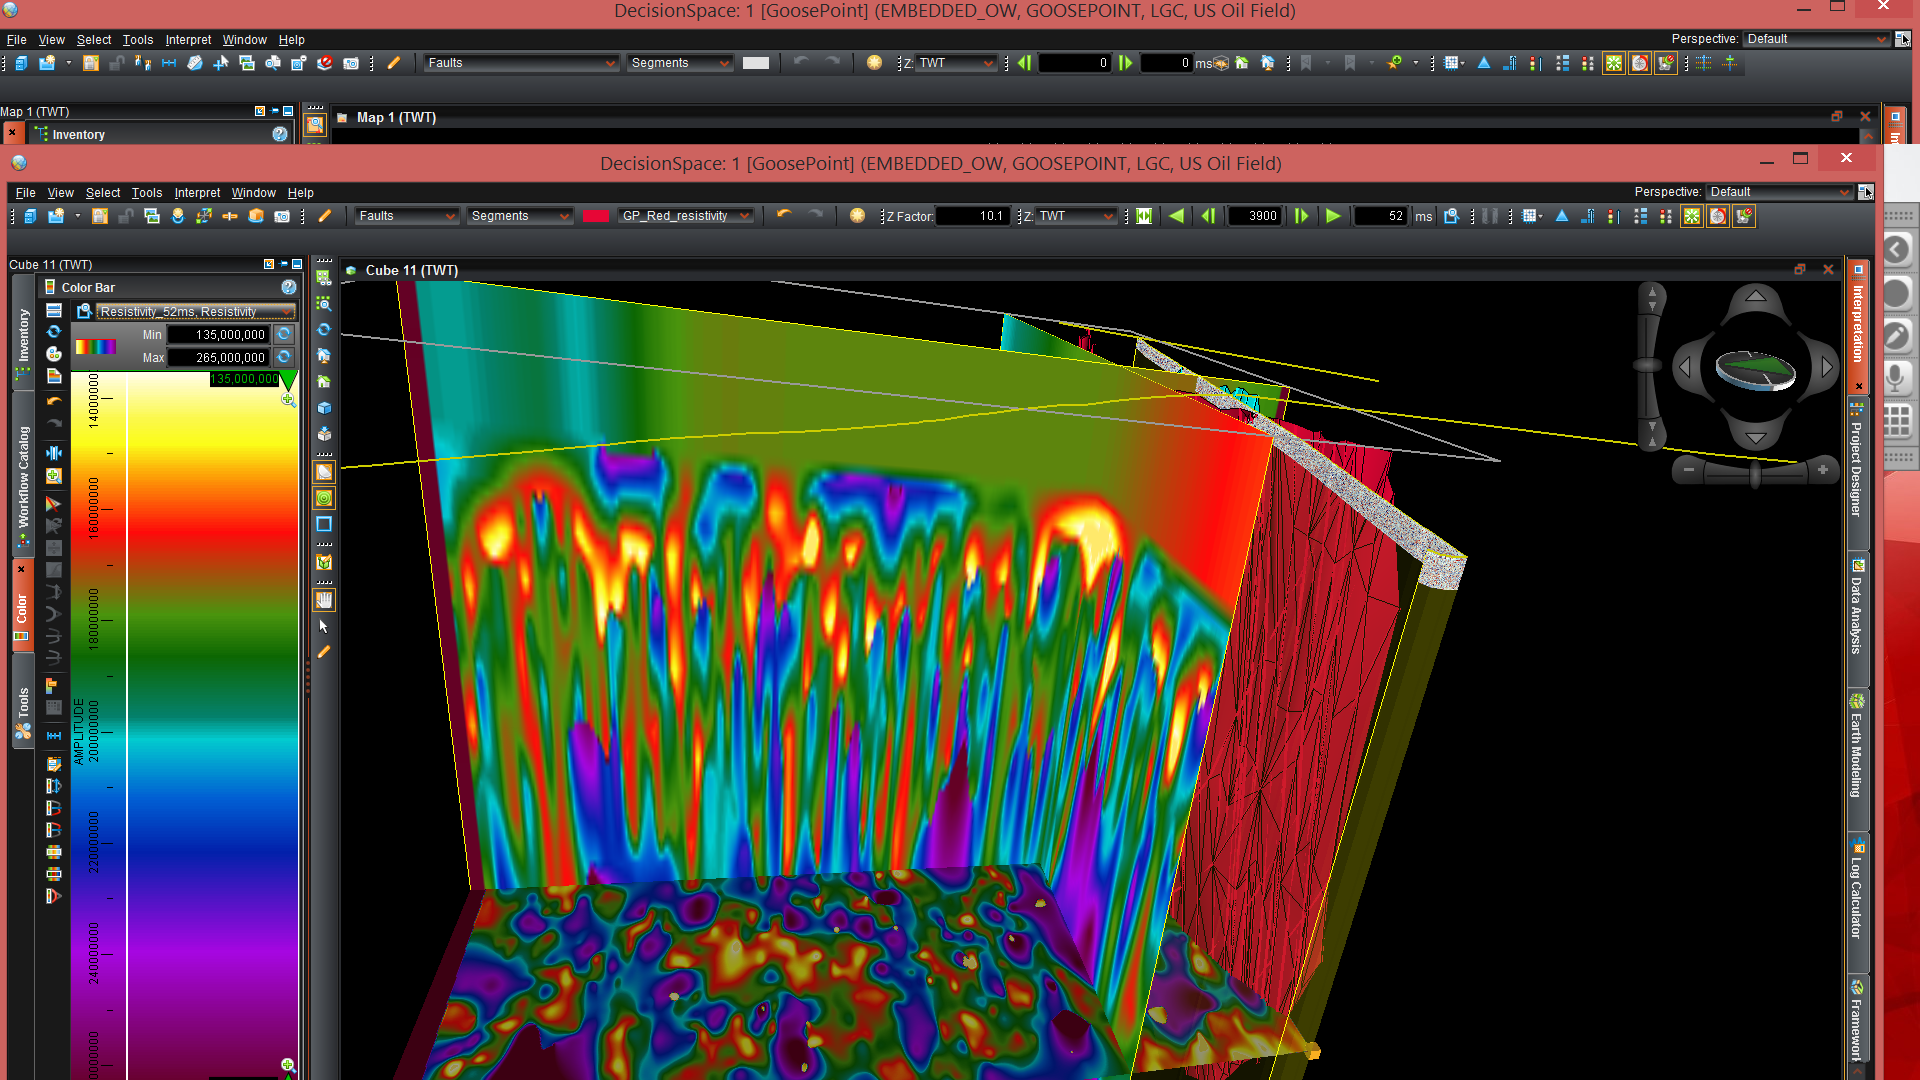
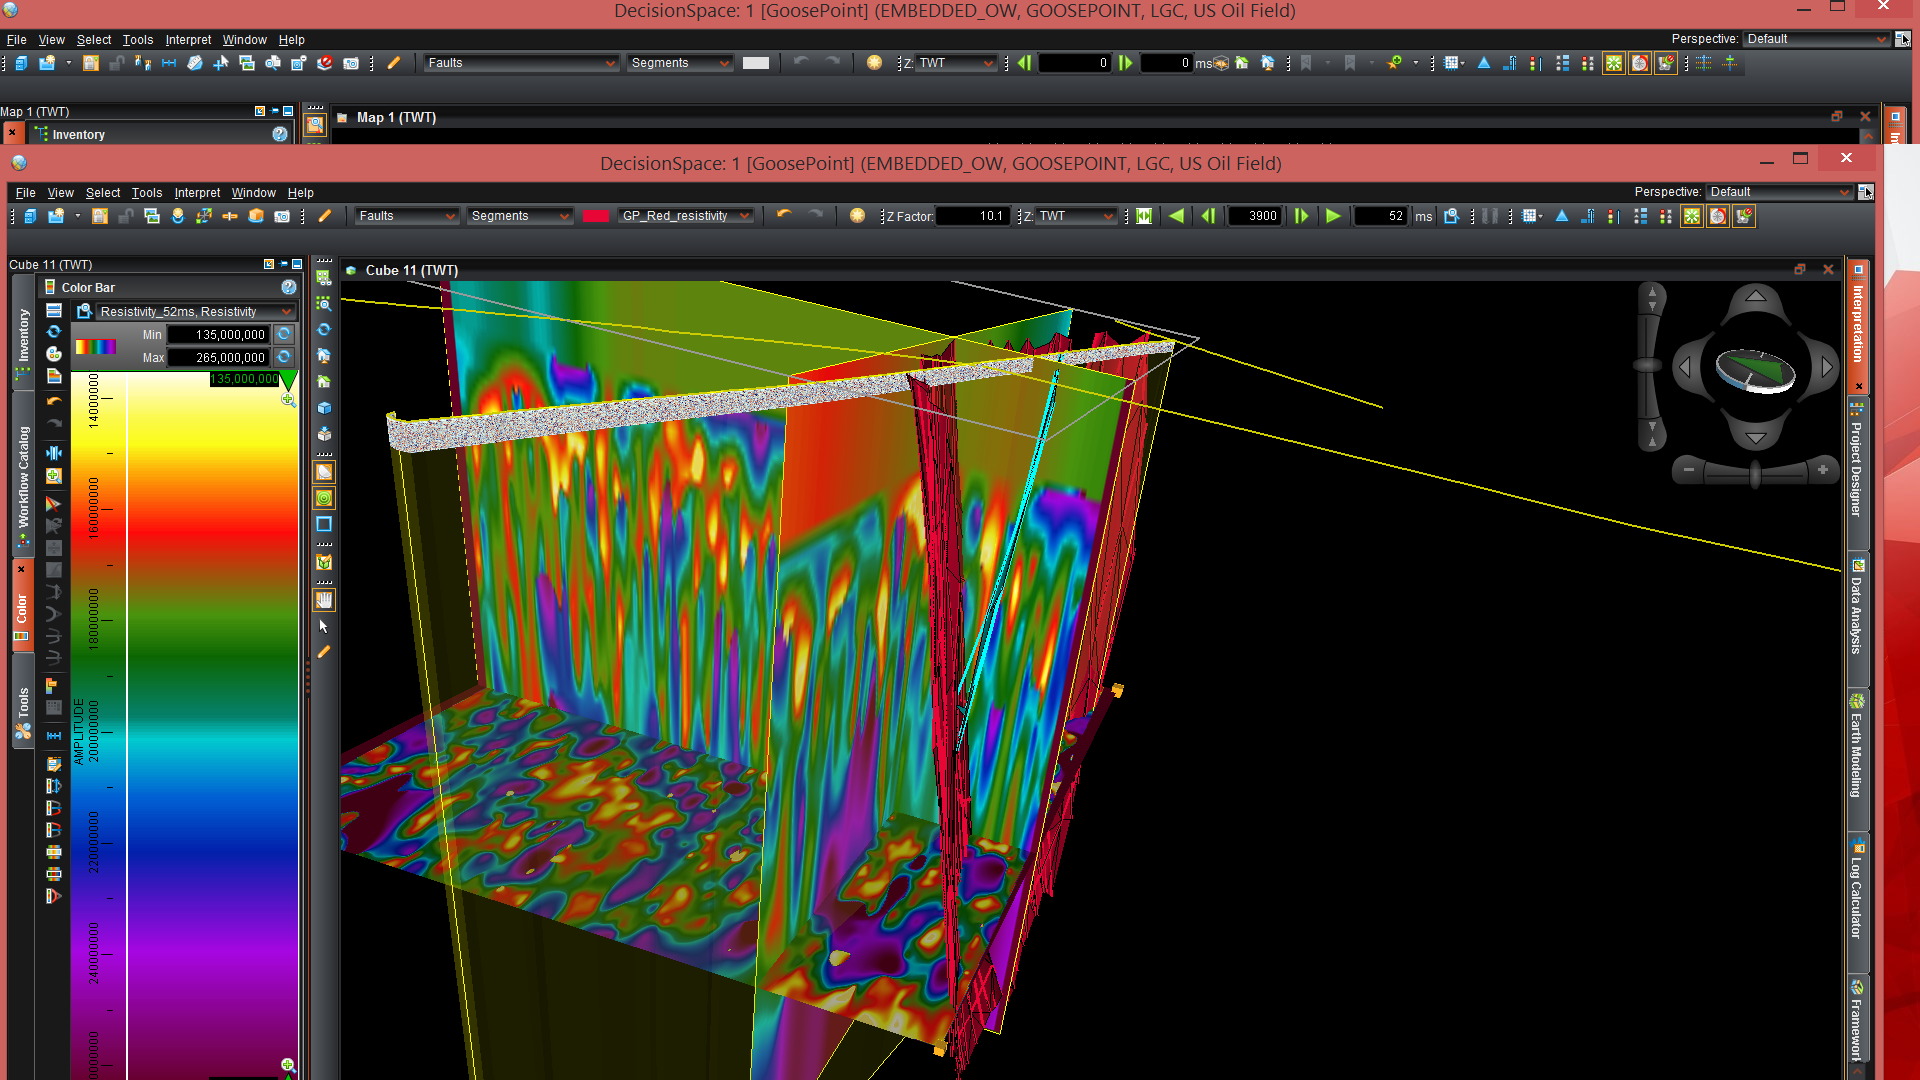
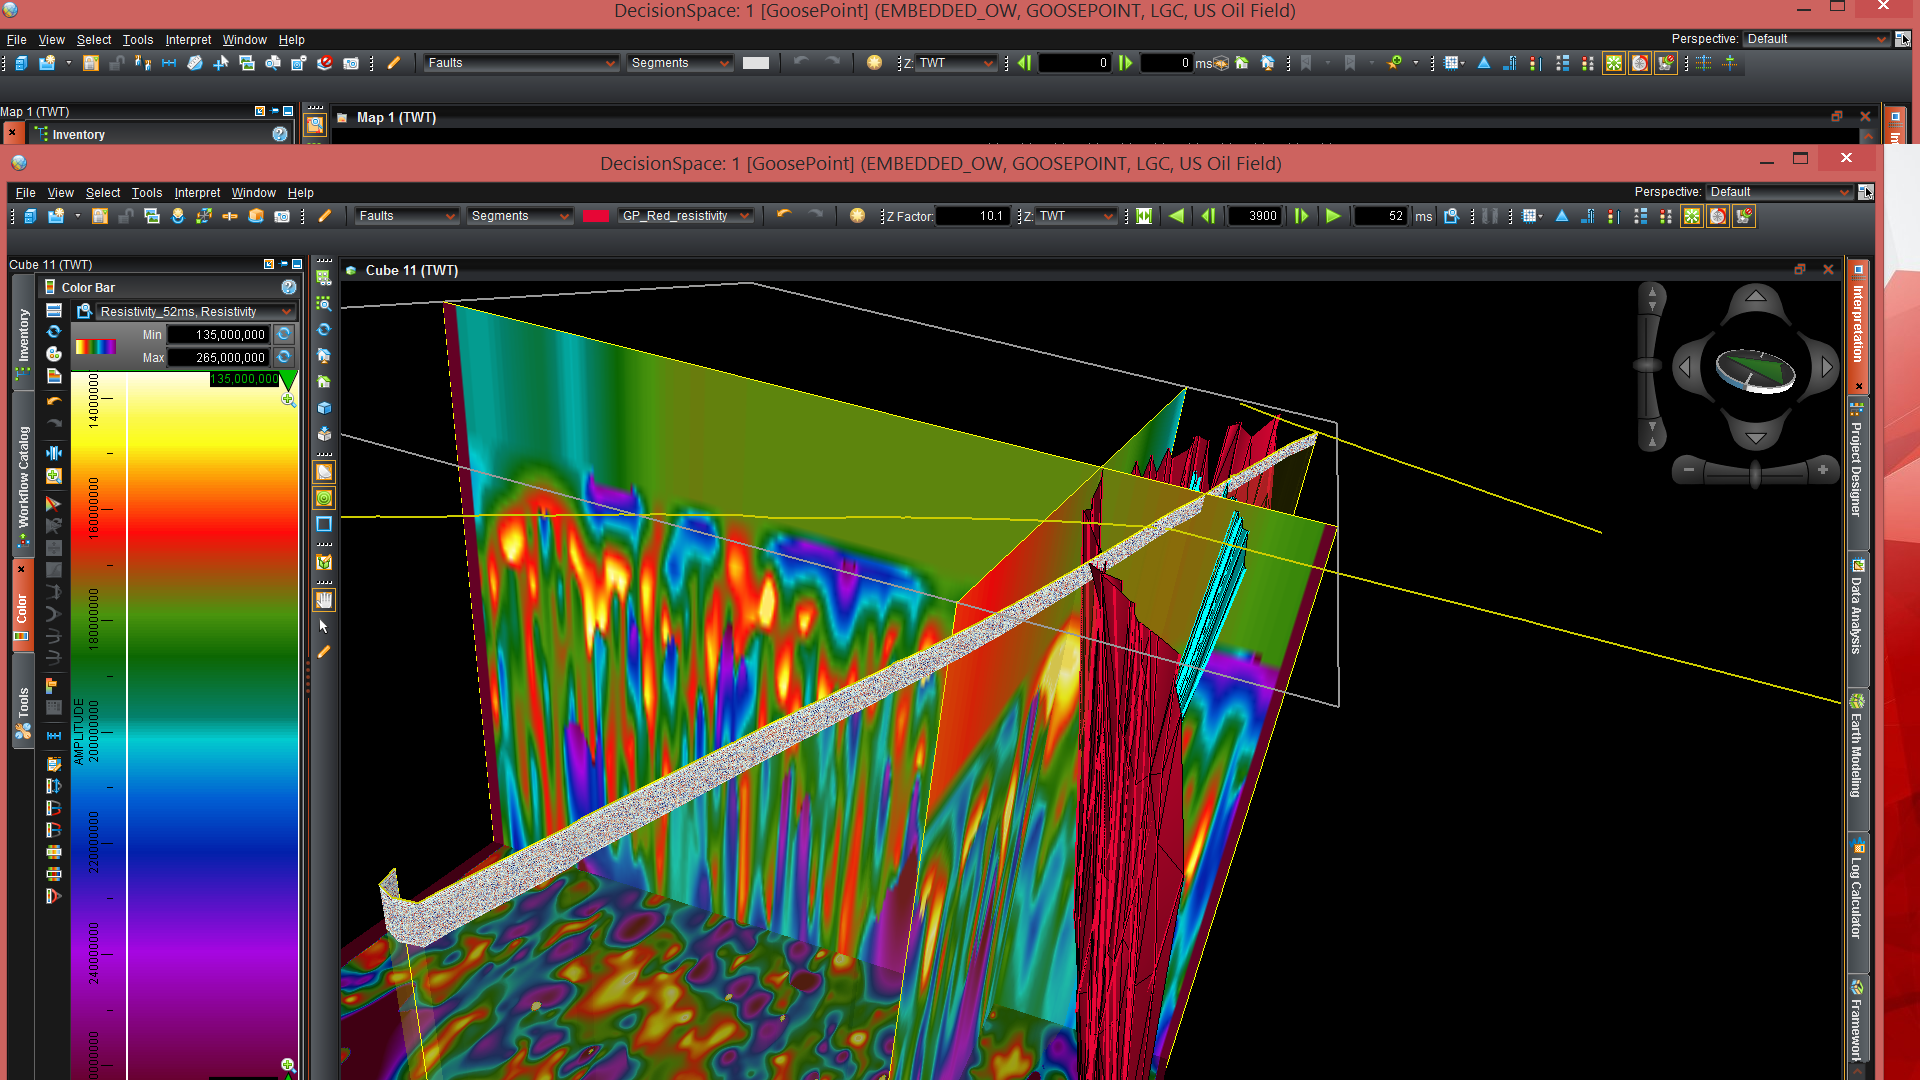
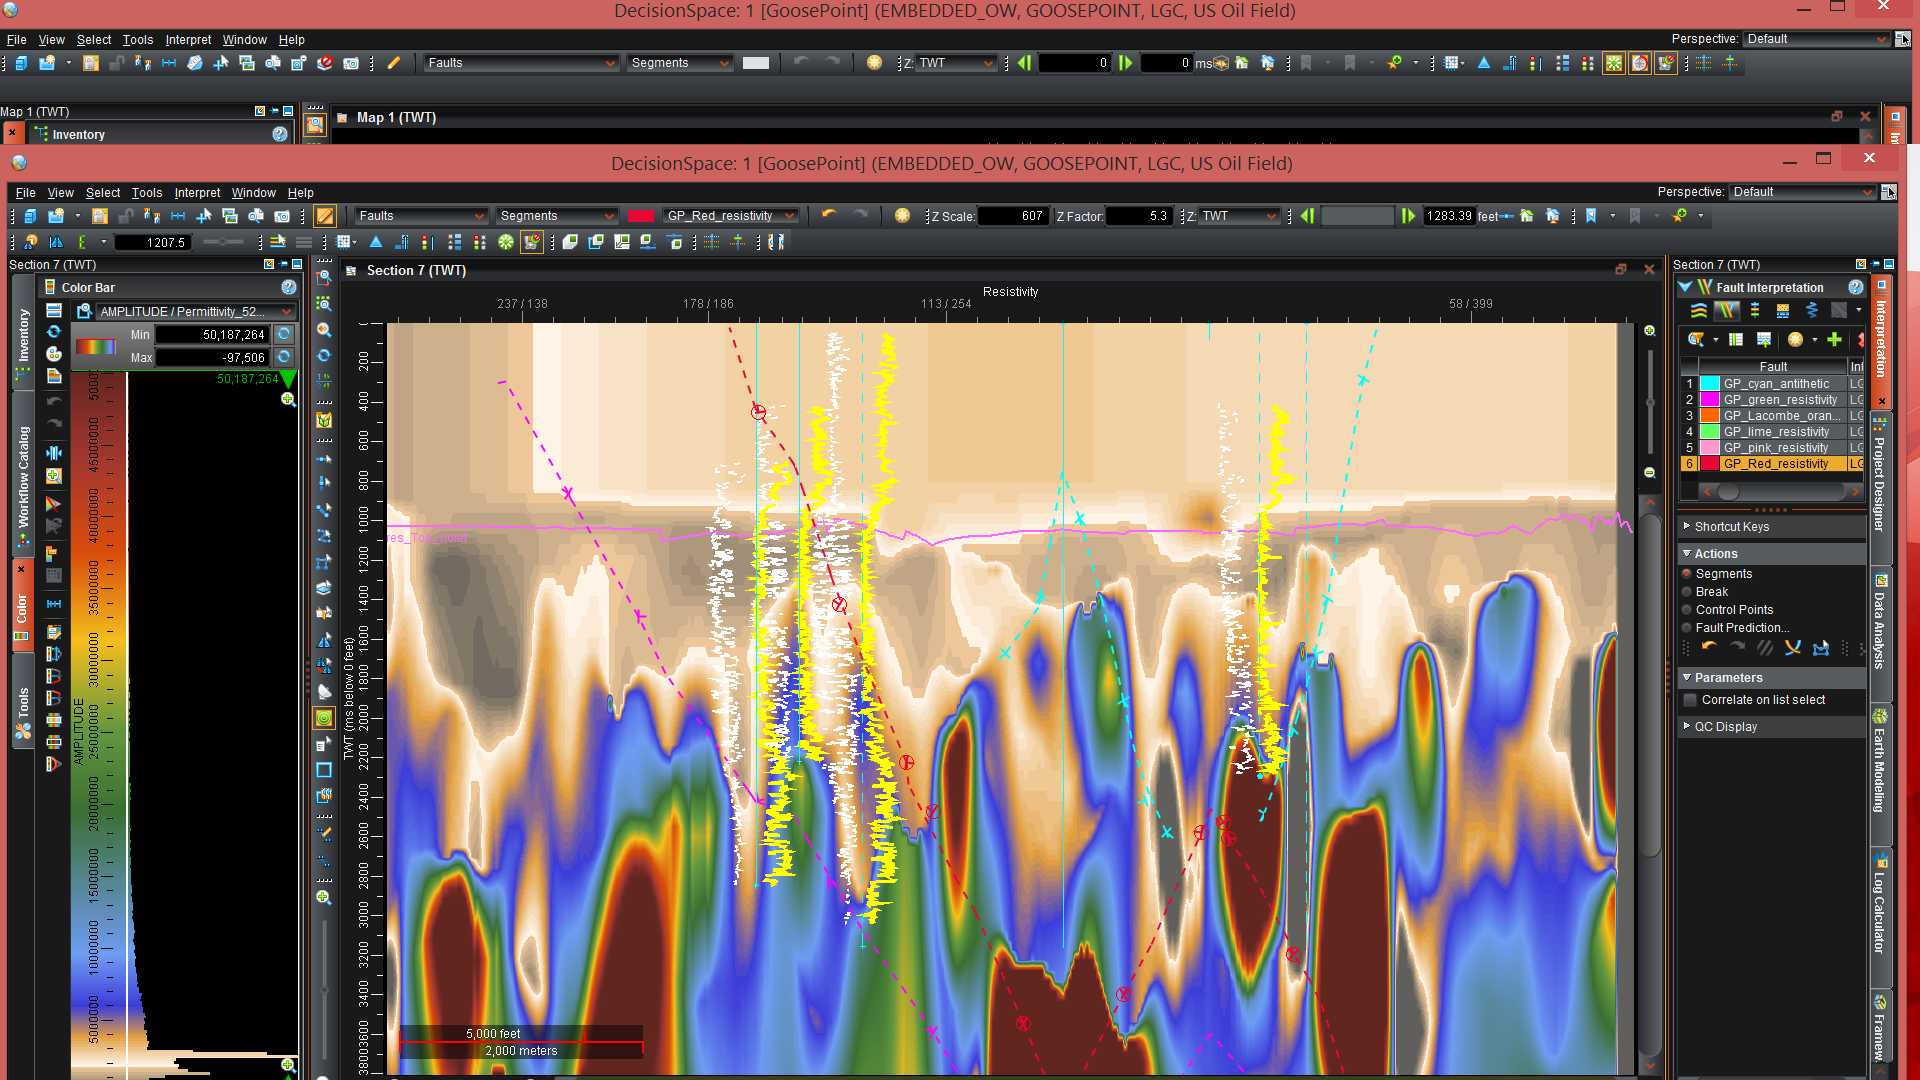
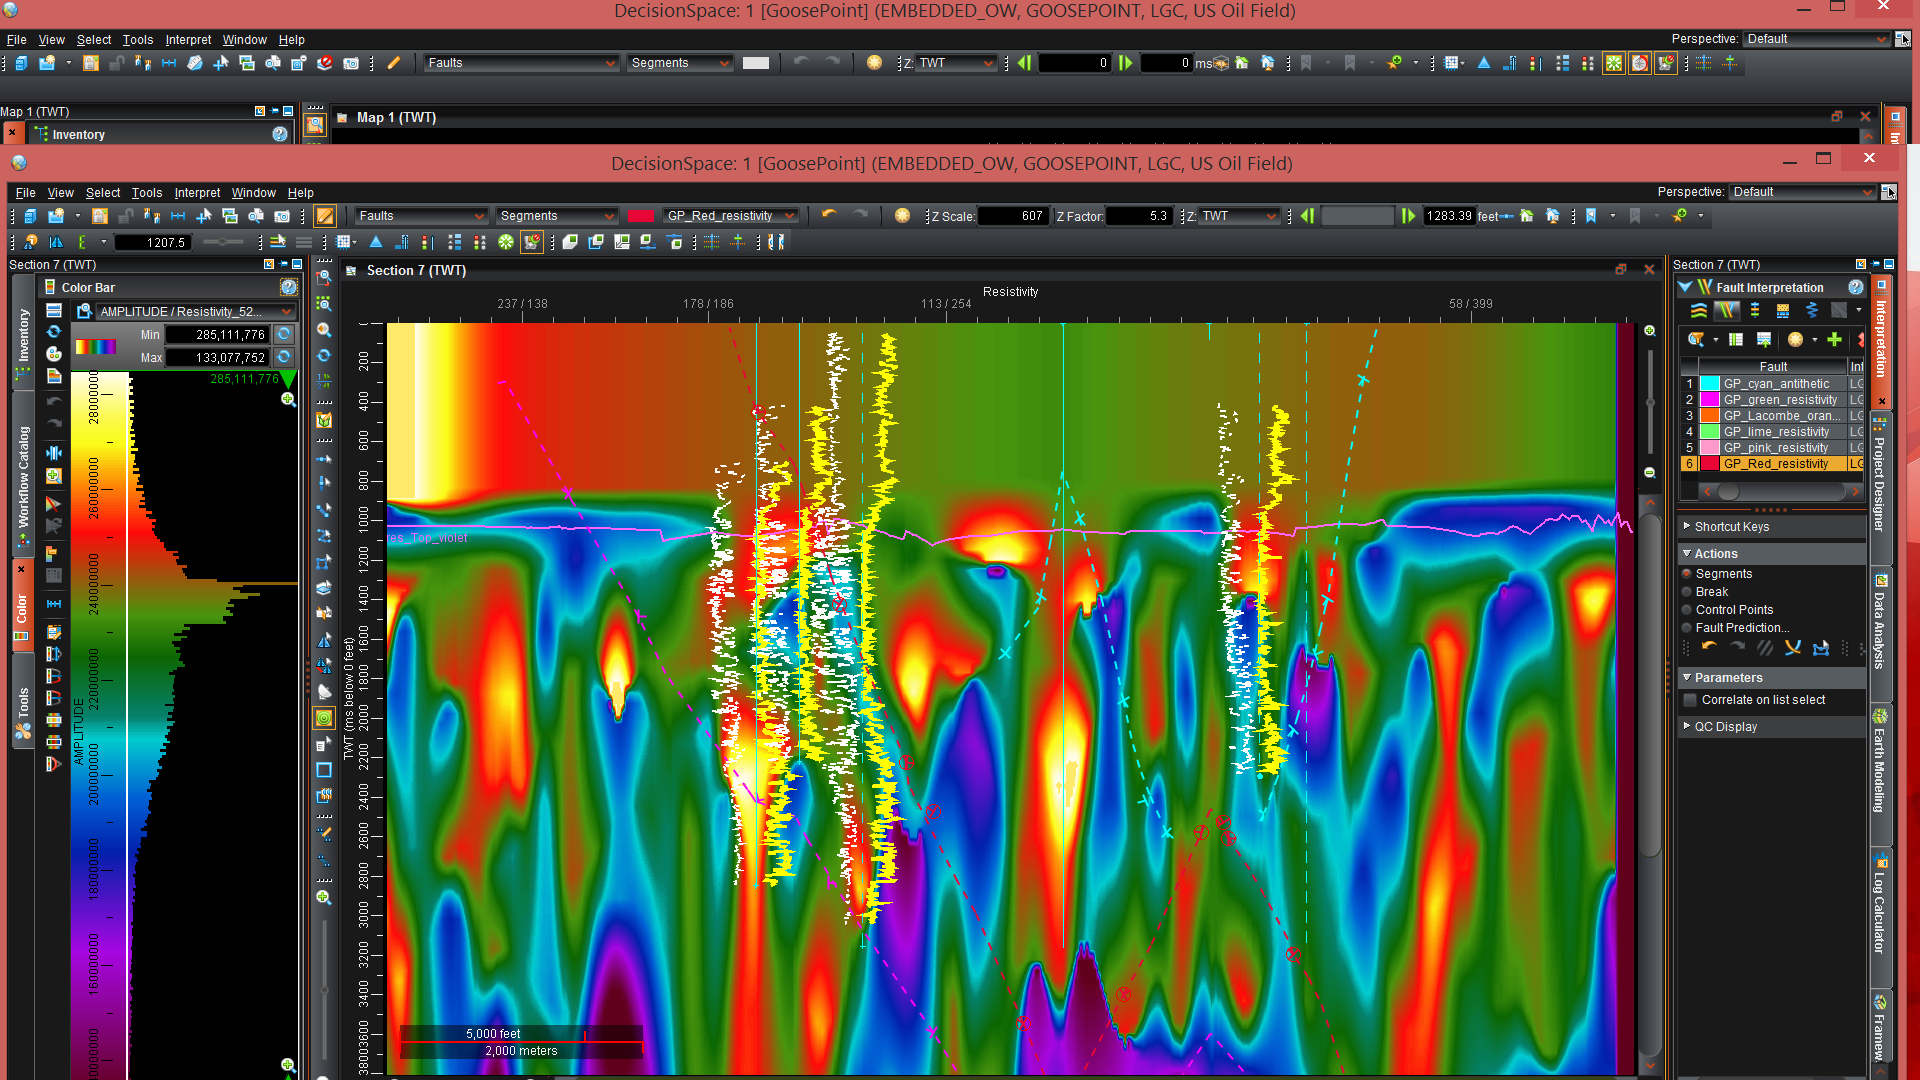
South-to-North Muted Resistivity Cross-Section | Small Apparent Resistivity Probe DecisionSpacetm |
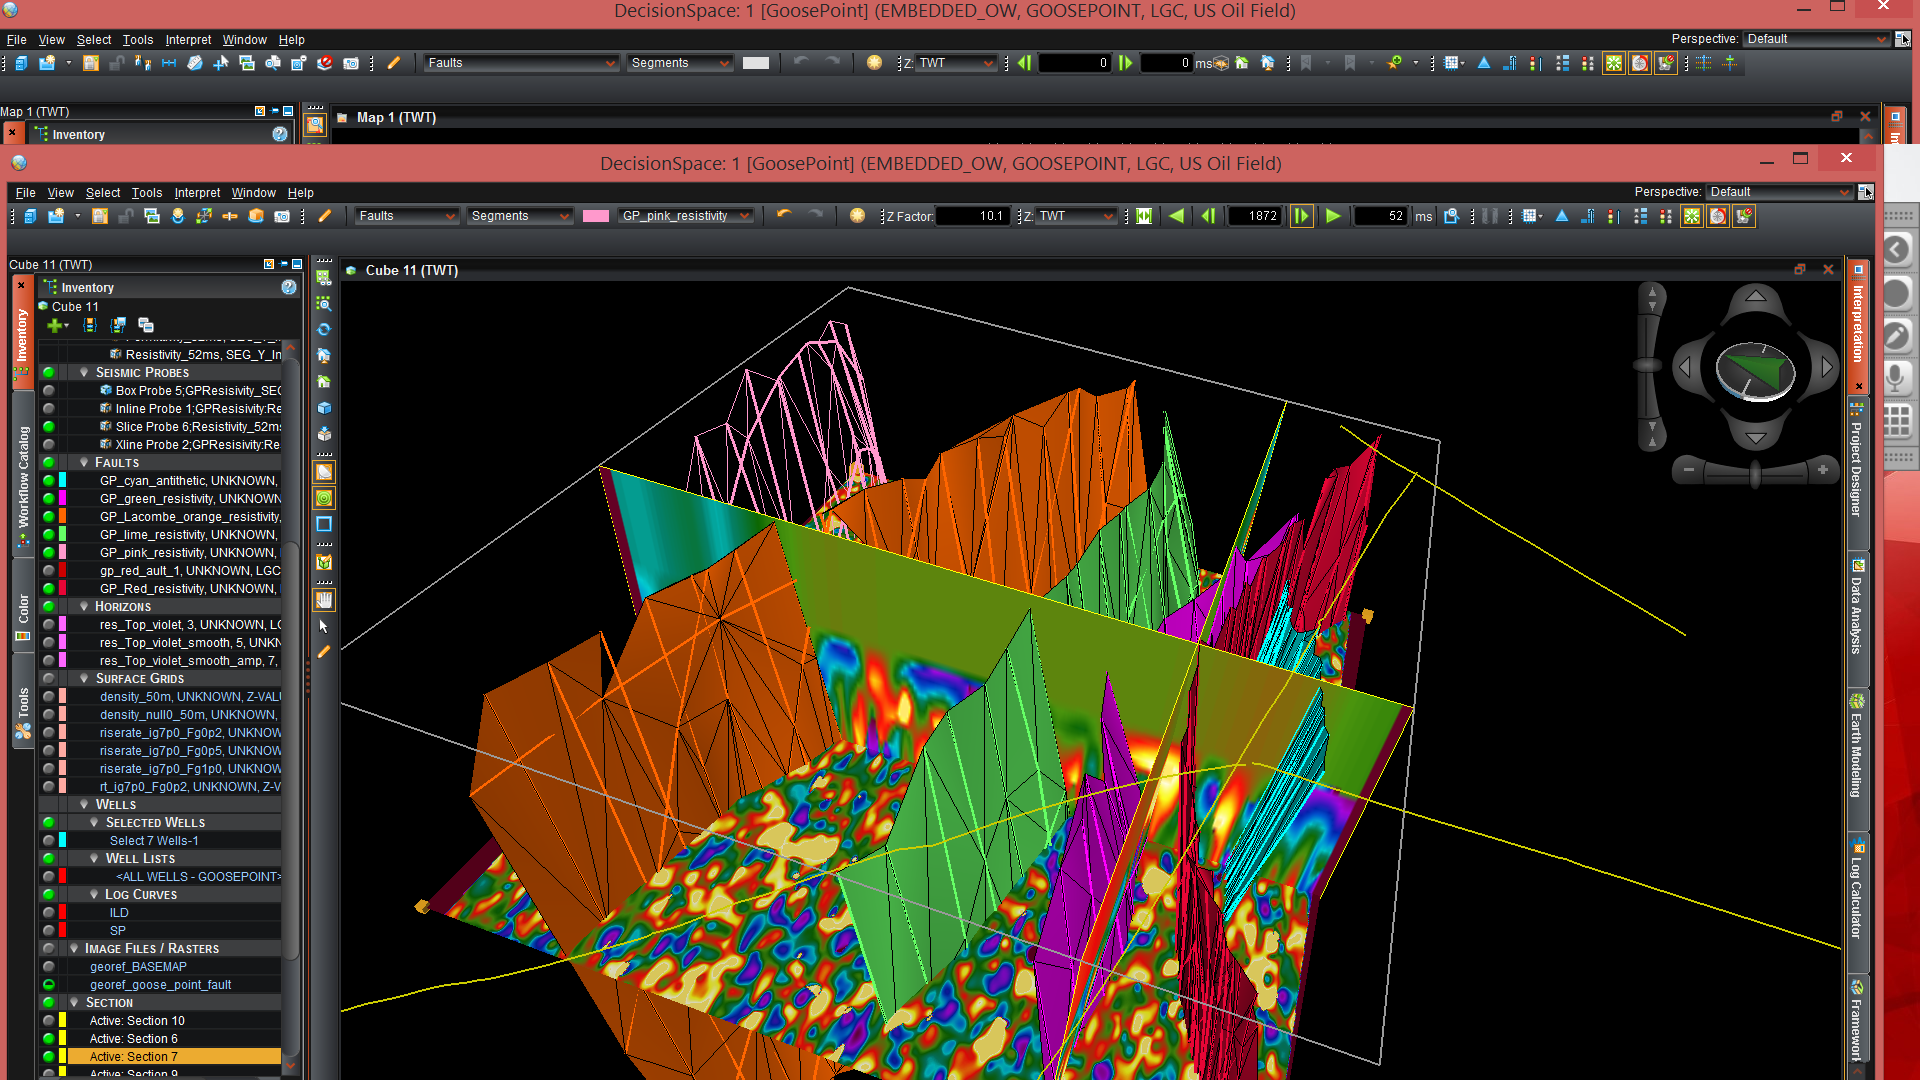
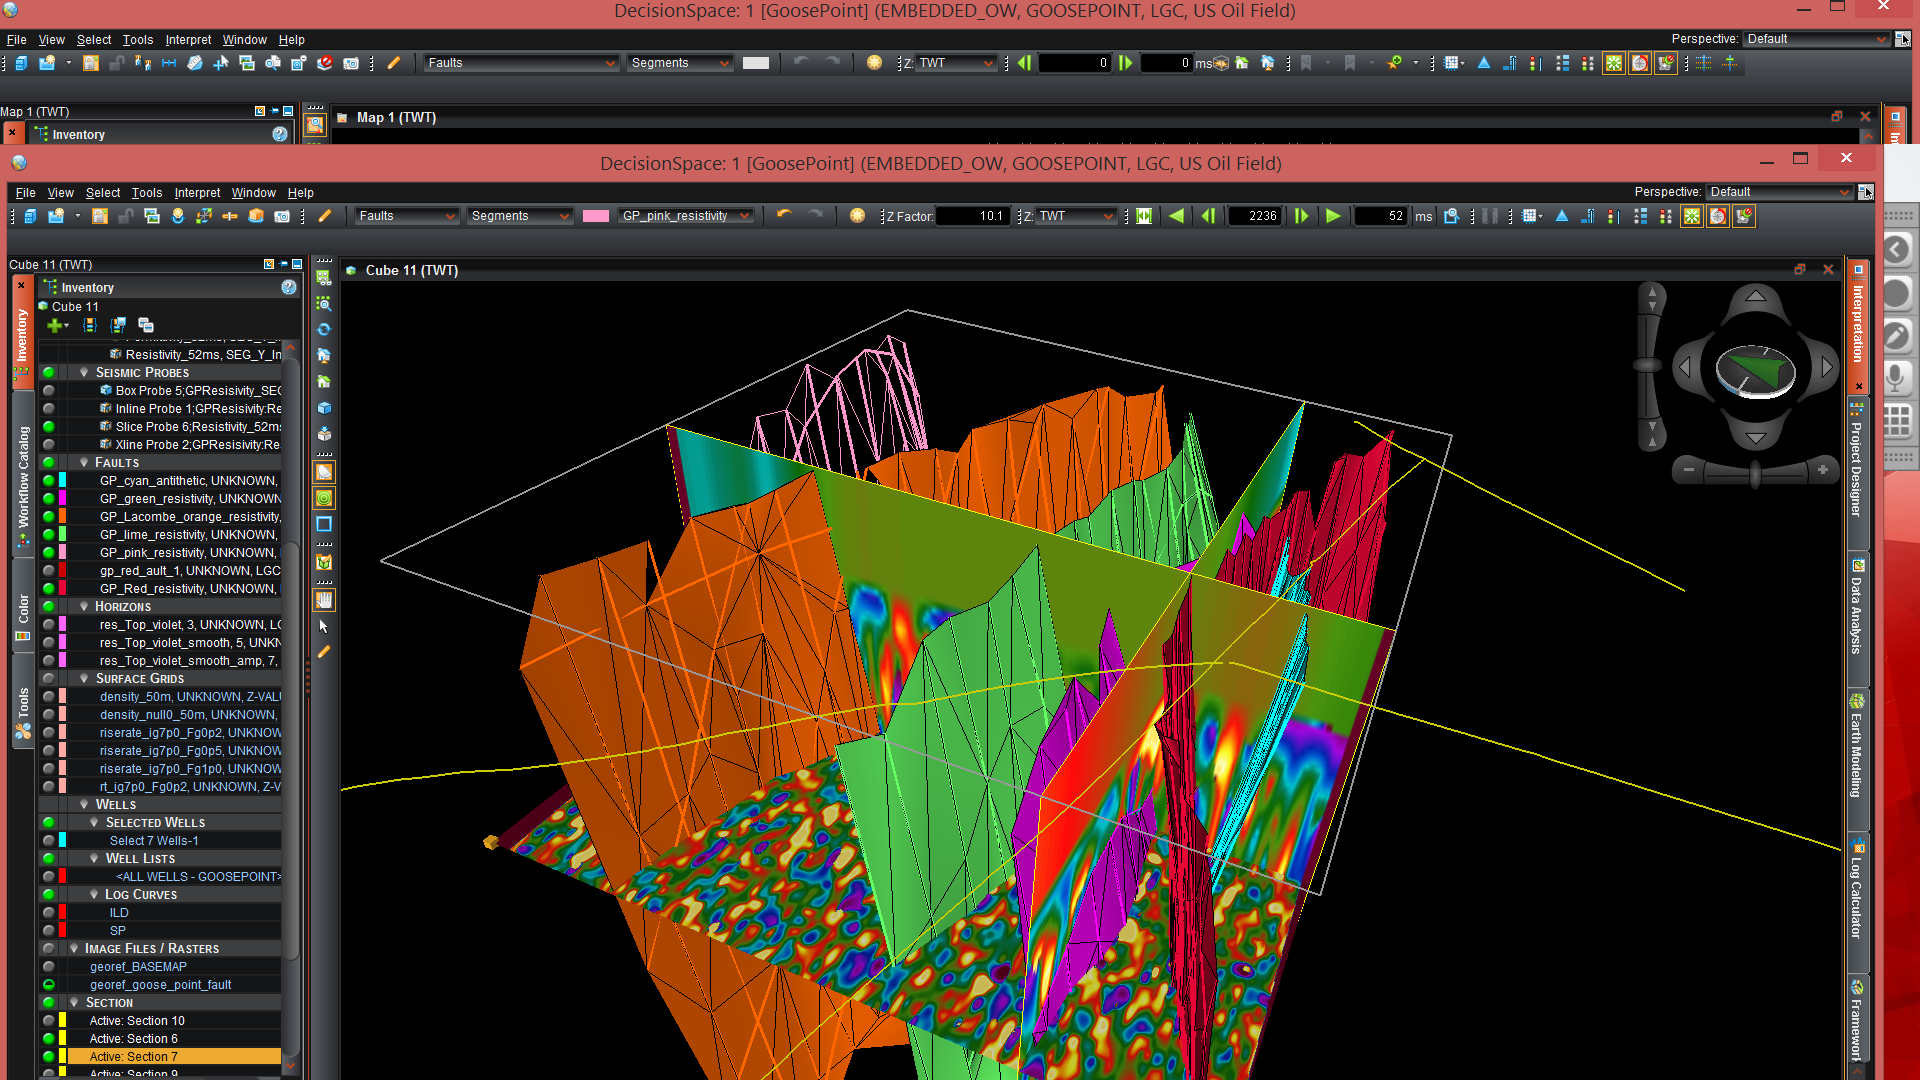
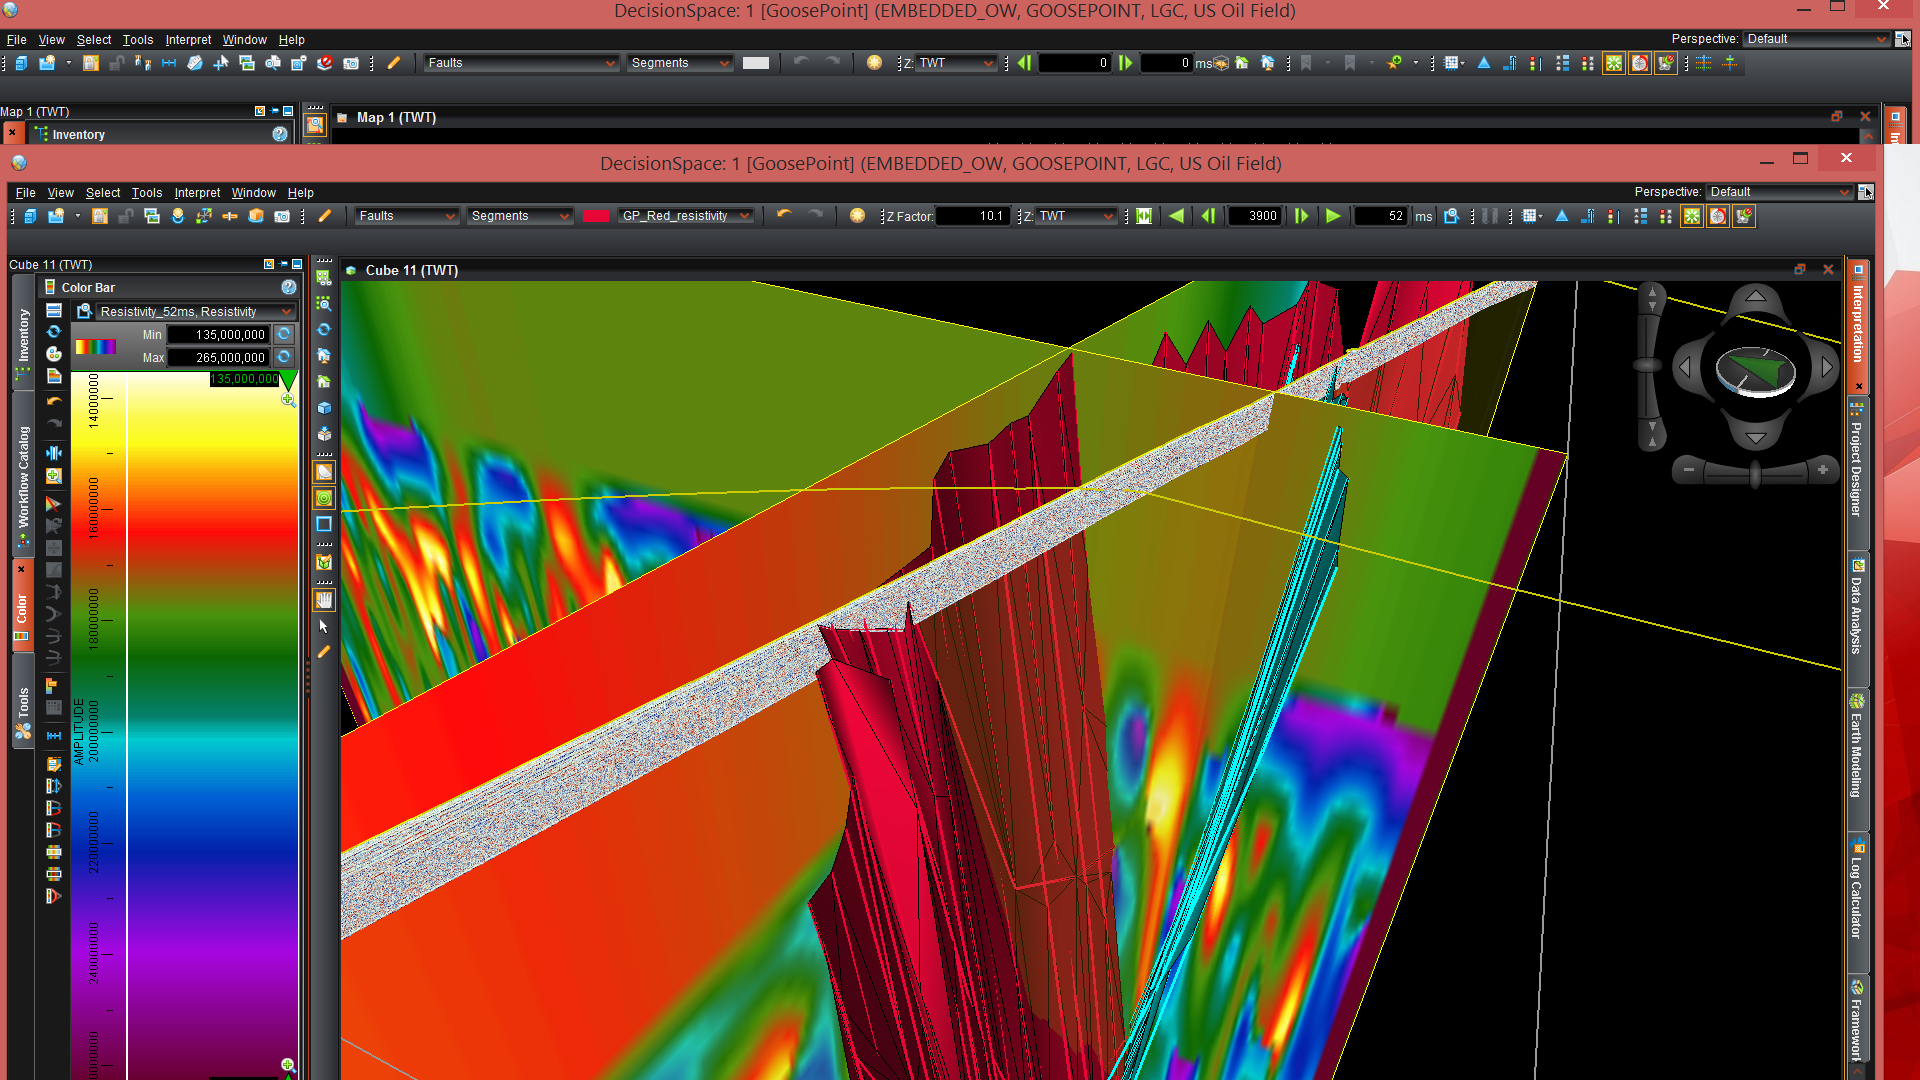
Larger Apparent Resistivity Probe DecisionSpacetm | Large Apparent Resistivity Probe DecisionSpacetm |
 |  |
 |  |
 |  |
 |  |
 |  |
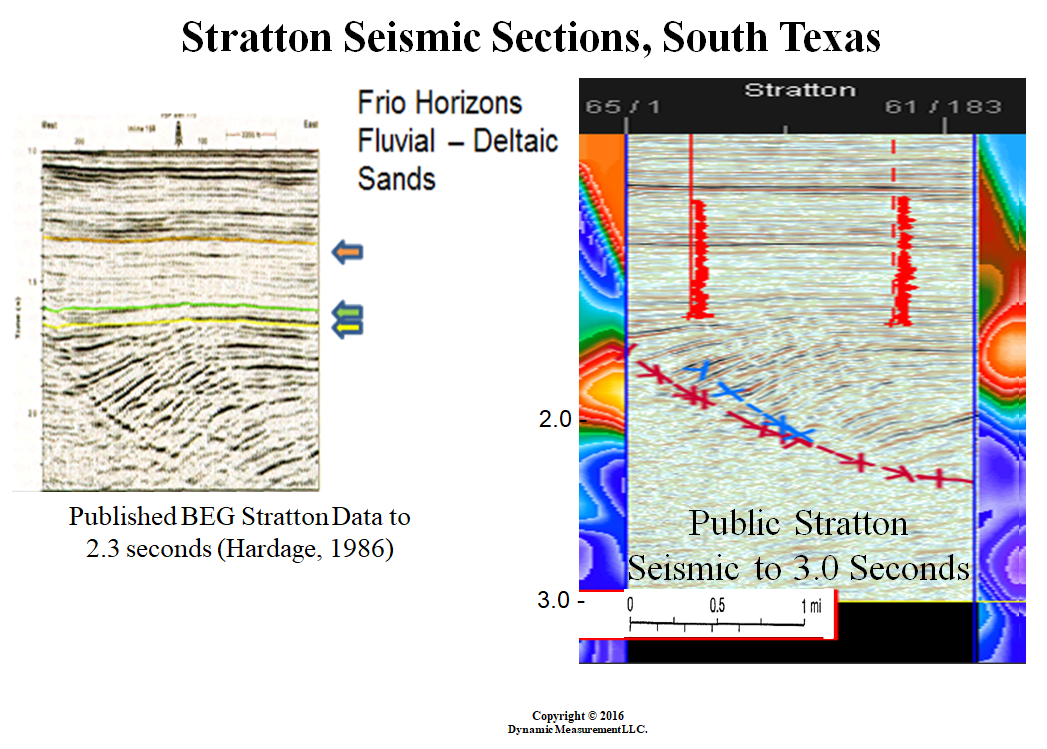
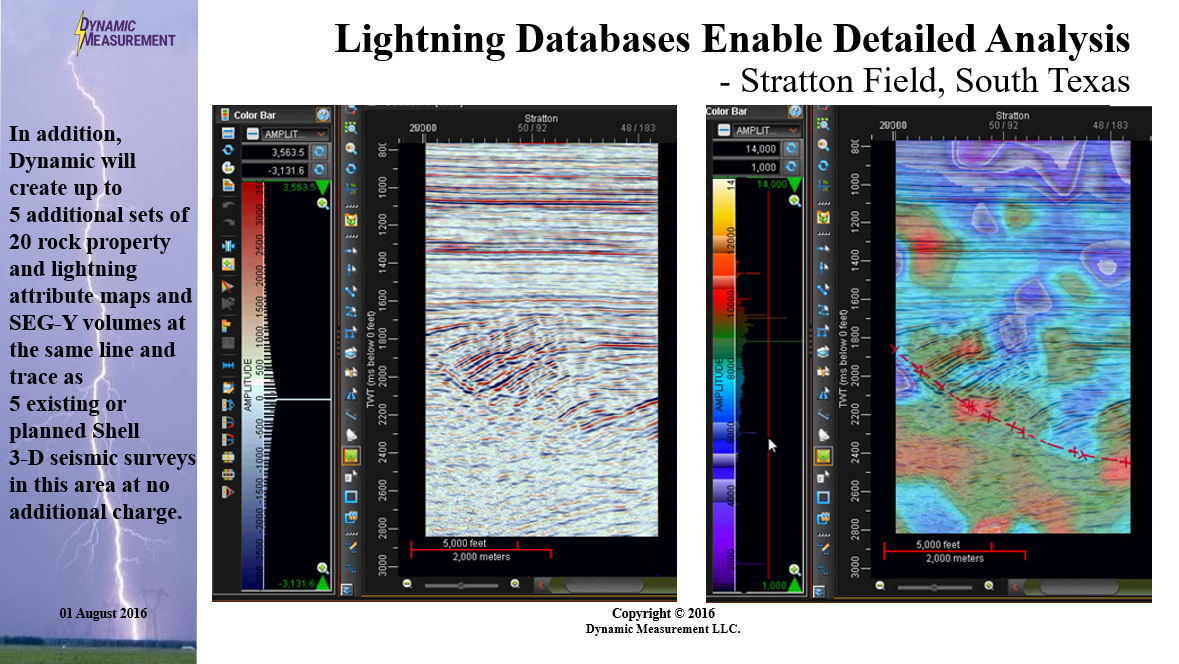
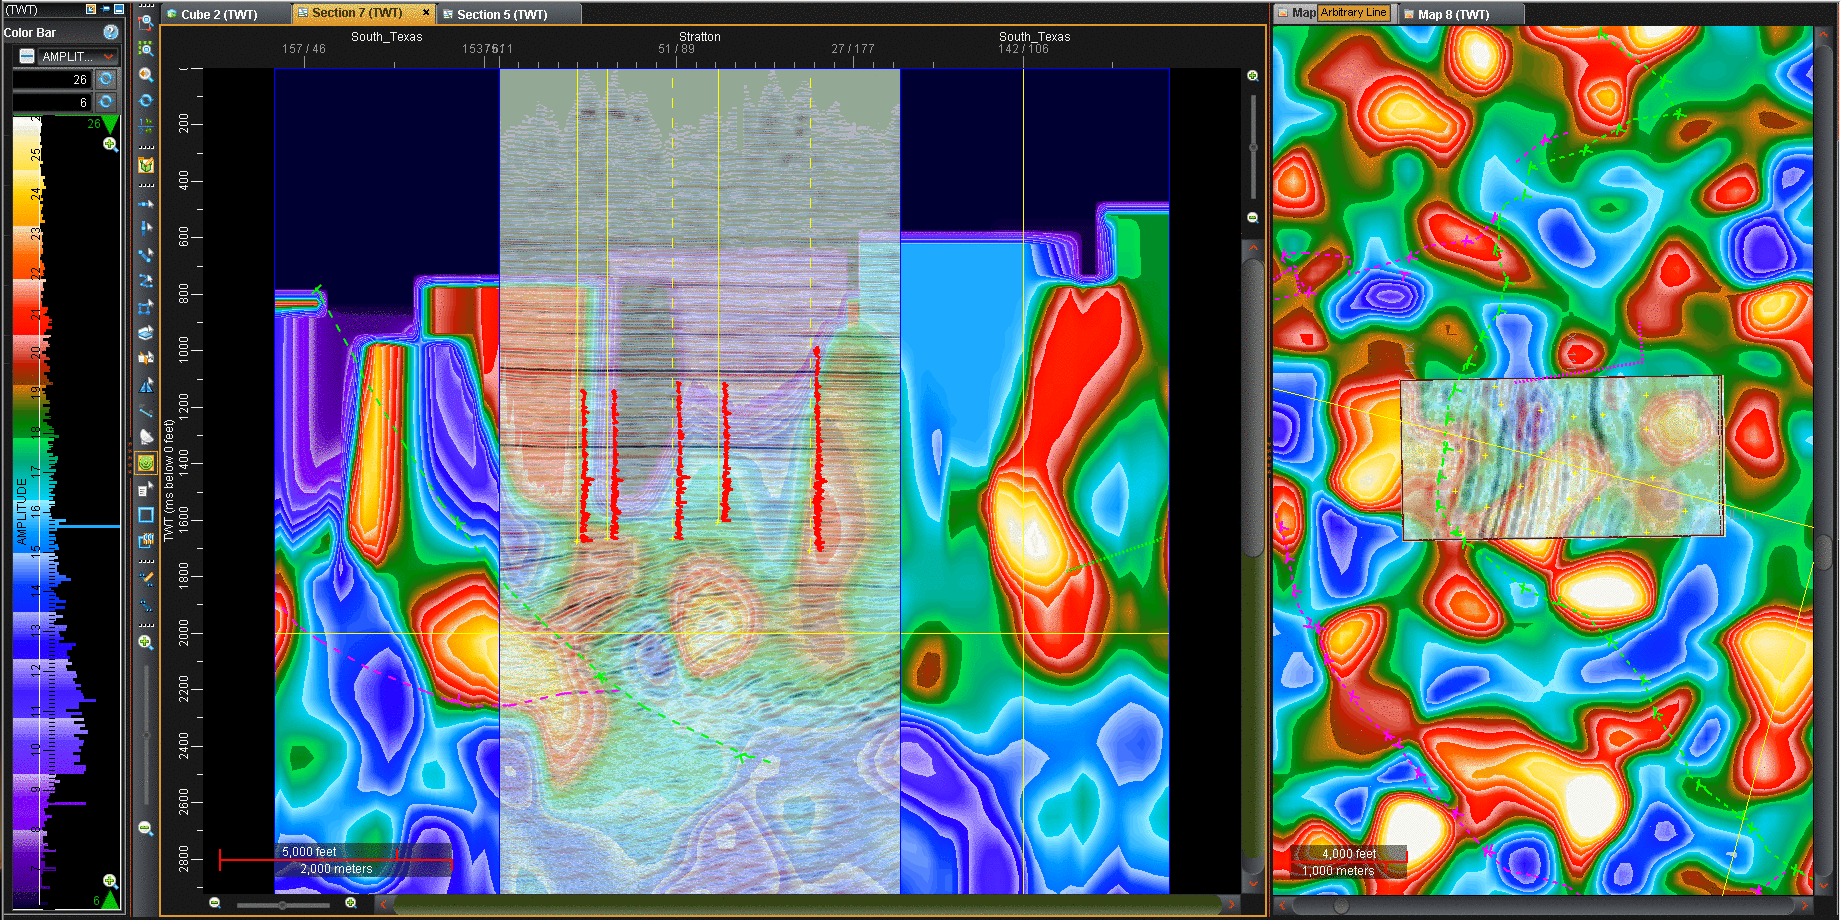
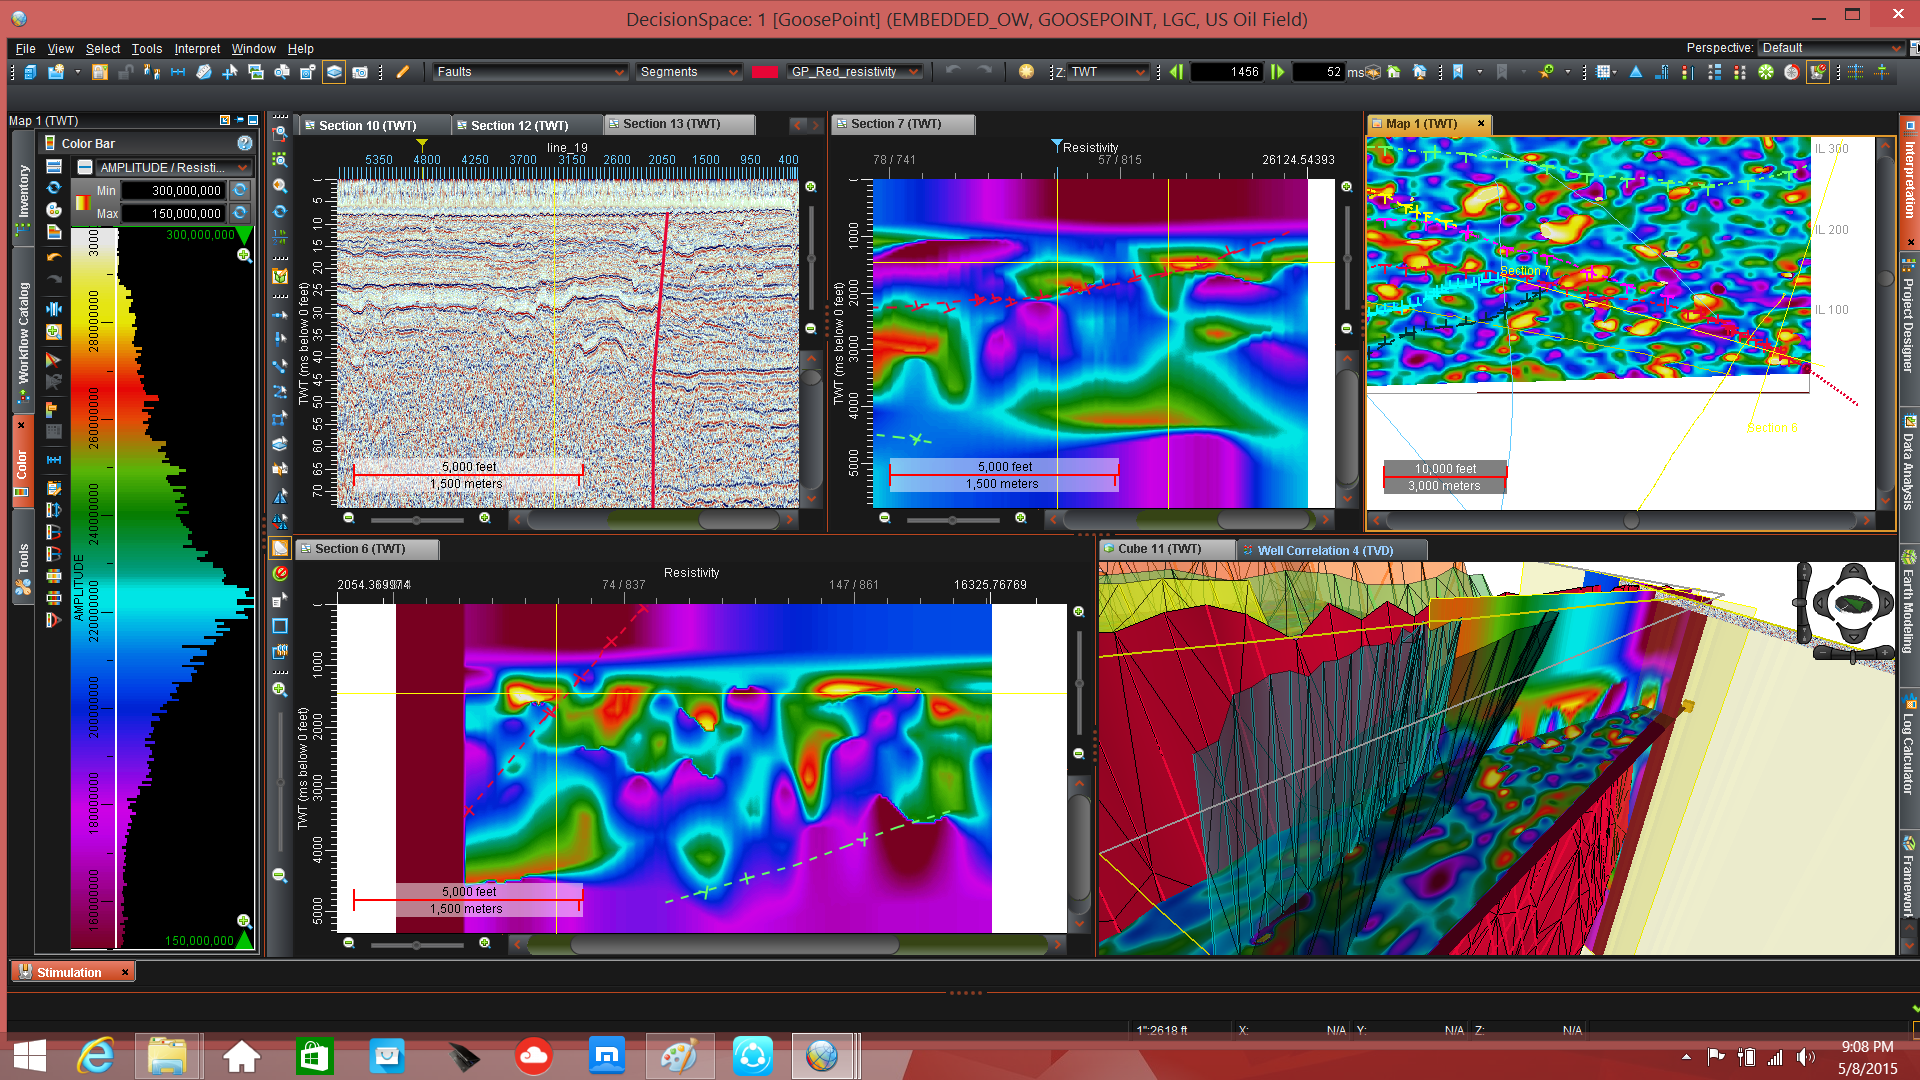
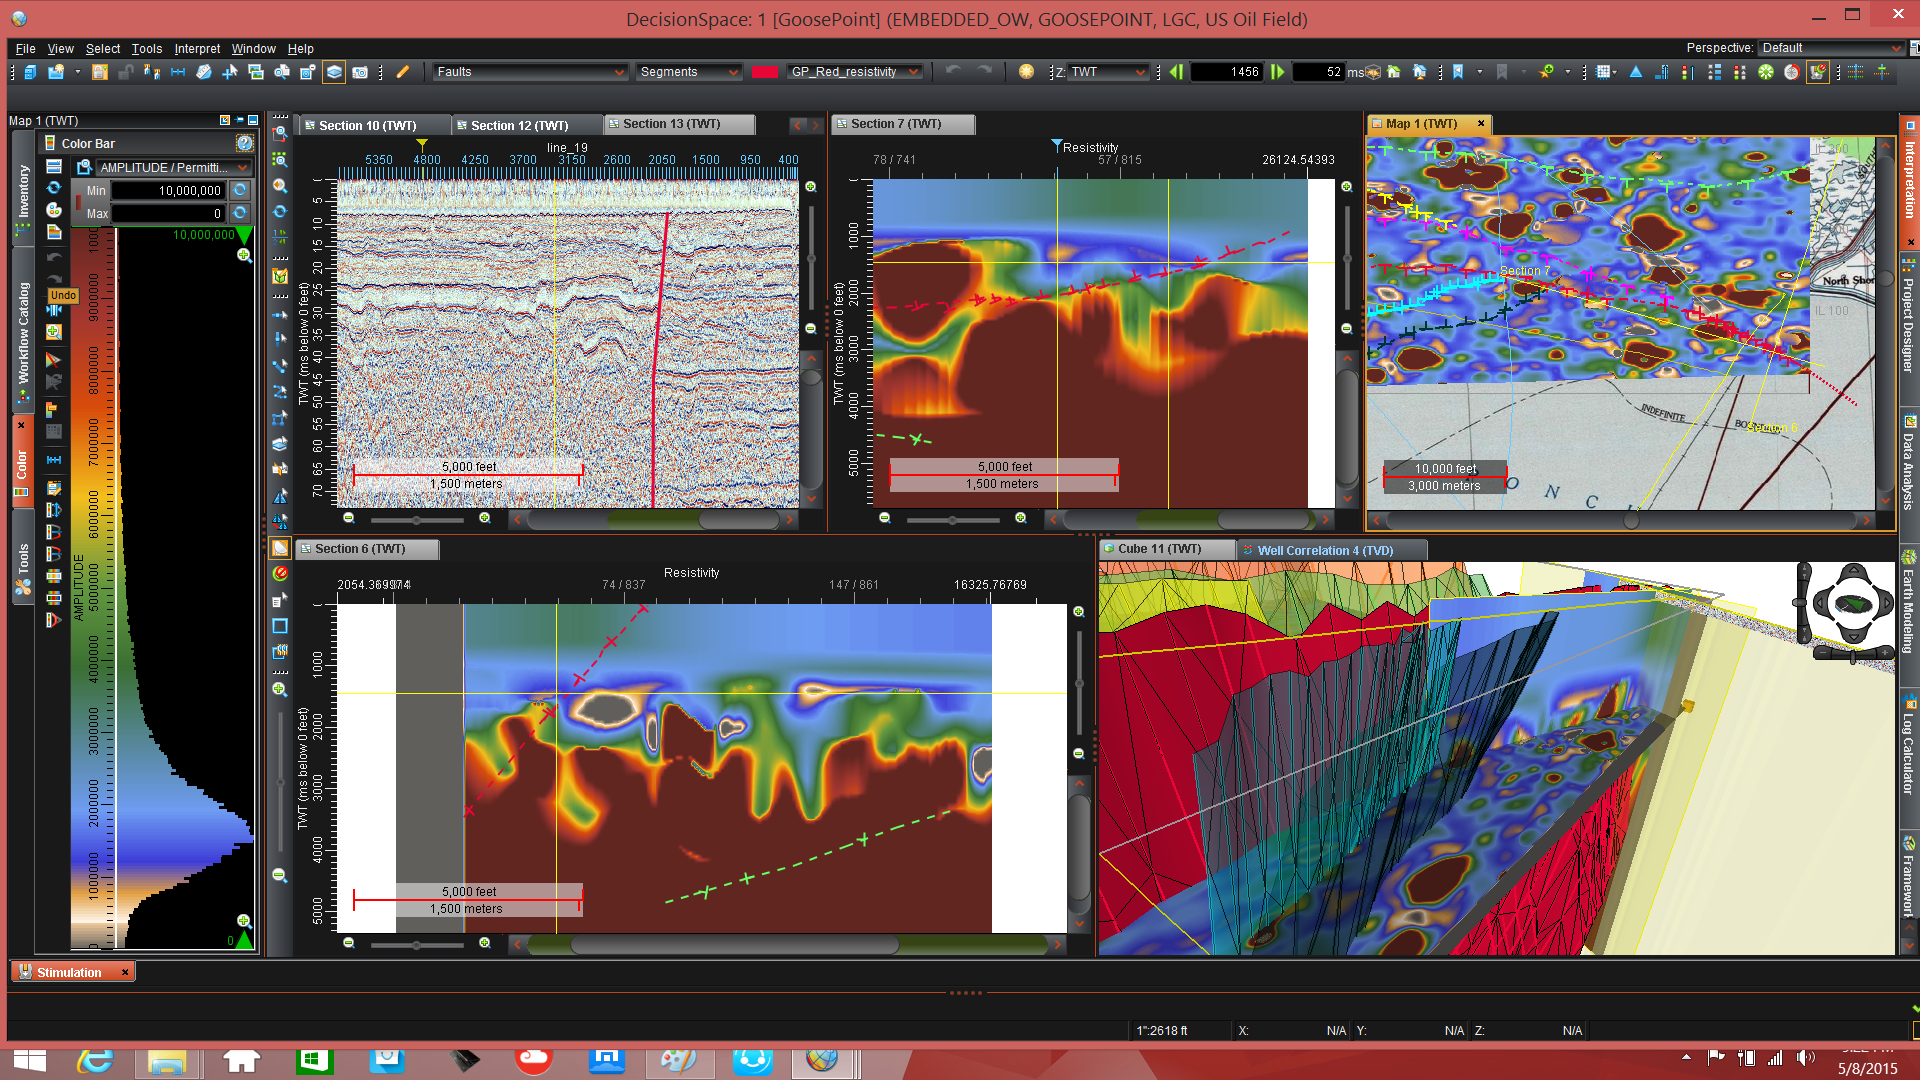
| BEG Released Seismic in front of Resistivity | BEG Seismic and Ω Overlay DecisionSpacetm |
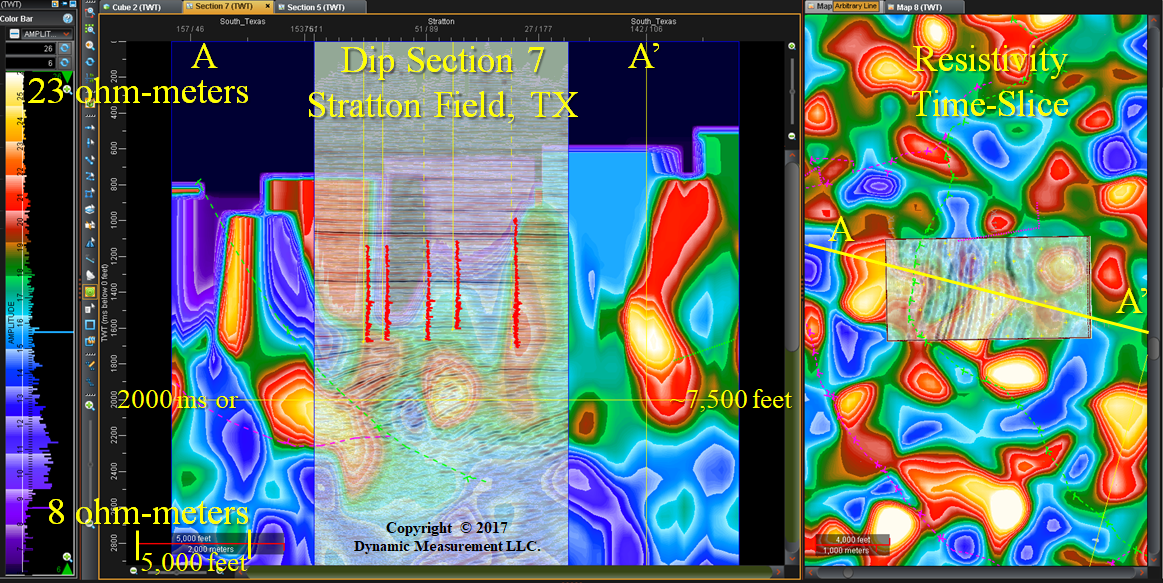
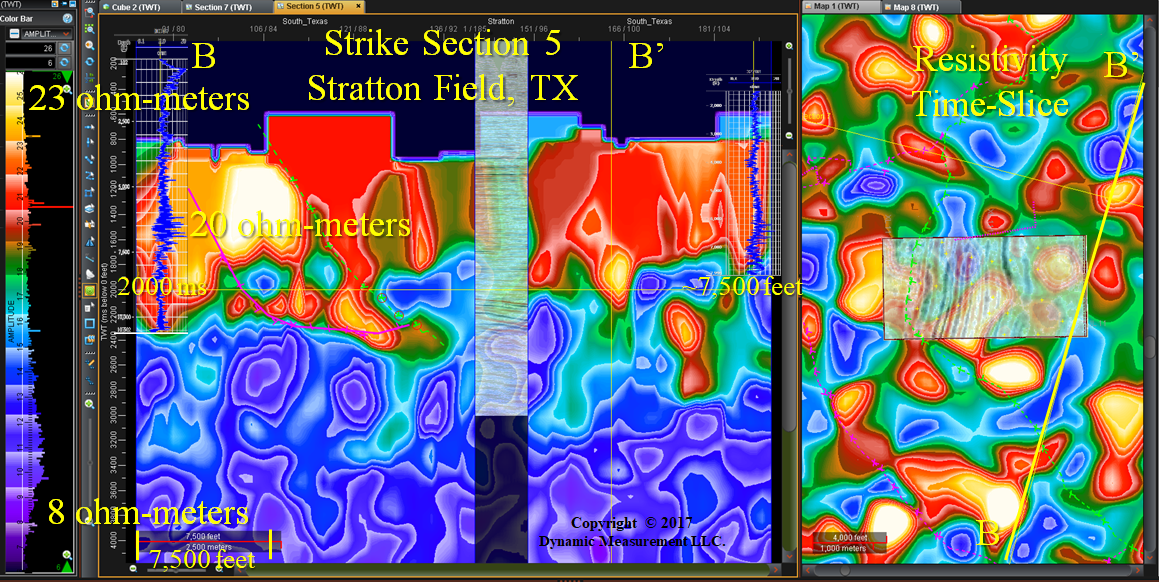
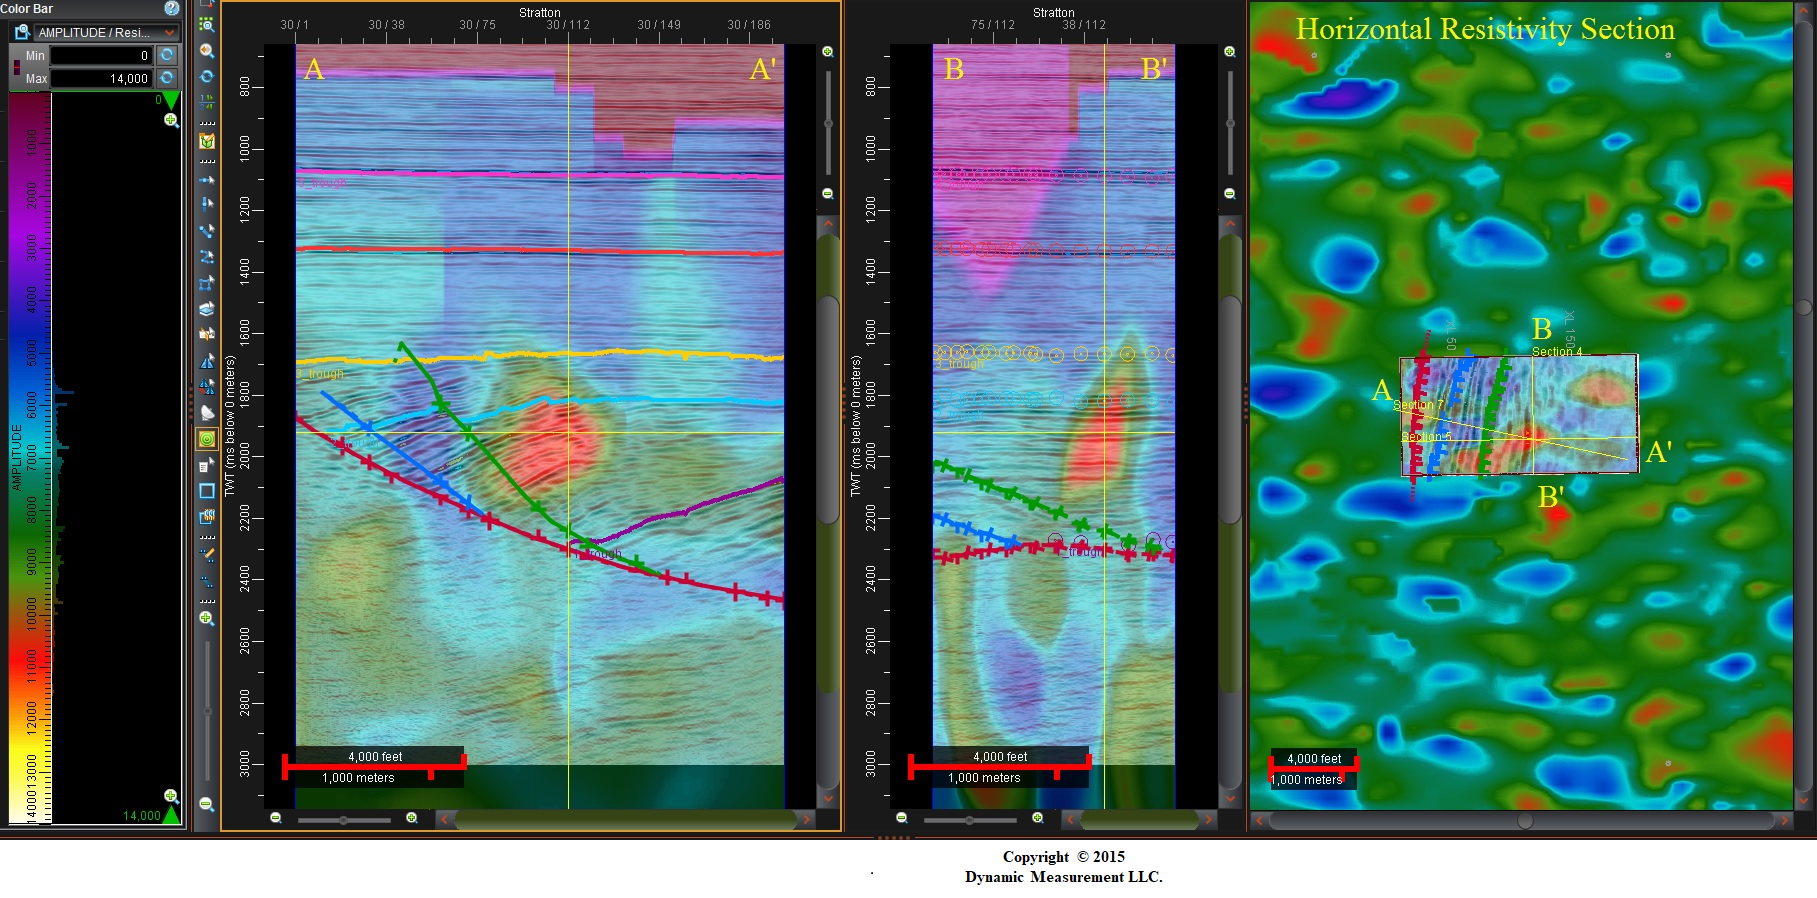
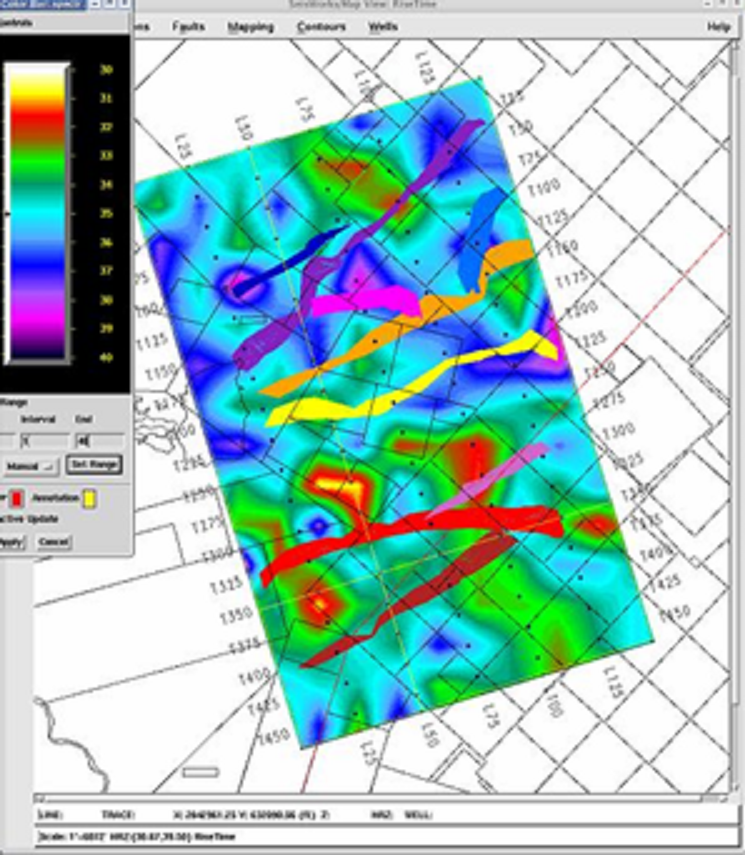
Seismic + Logs Ω Cross-Section & Horizontal-Slice | Dip & Strike Animation Stratton Field |
Log & Lightning Resistivity Tie Cross-Section | Dip & Strike Seismic with Ω Anomaly |
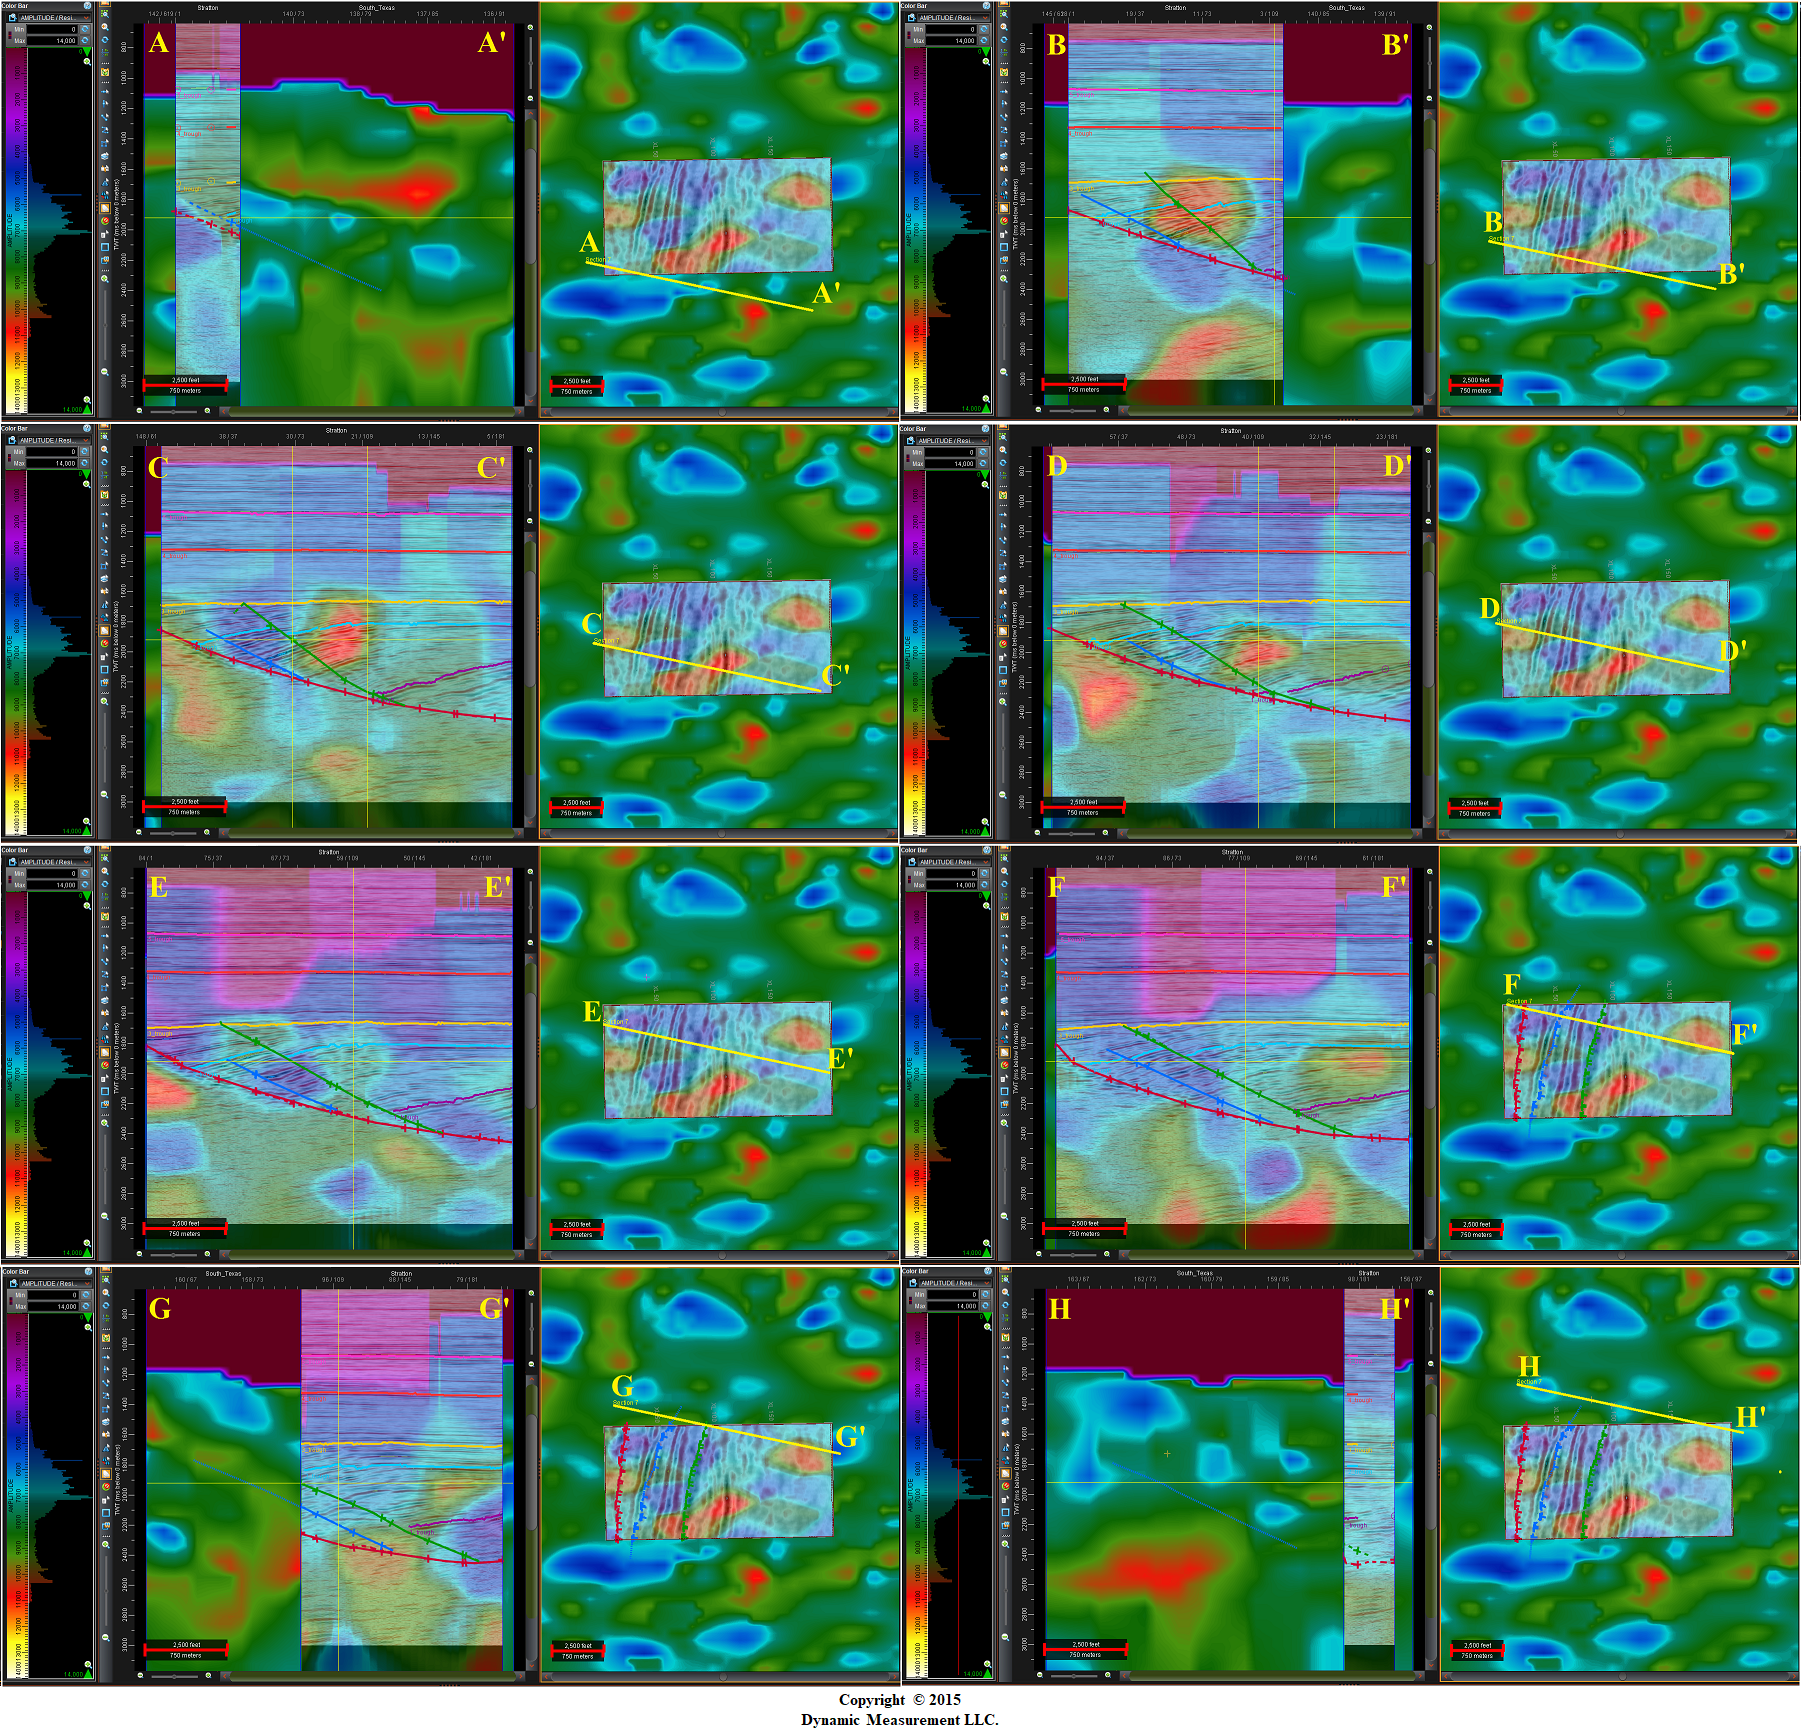
Lightning Rise-Time Overlay on Cross-Sections | A-A'-H-H' Dip Cross-Sections Stratton Field |
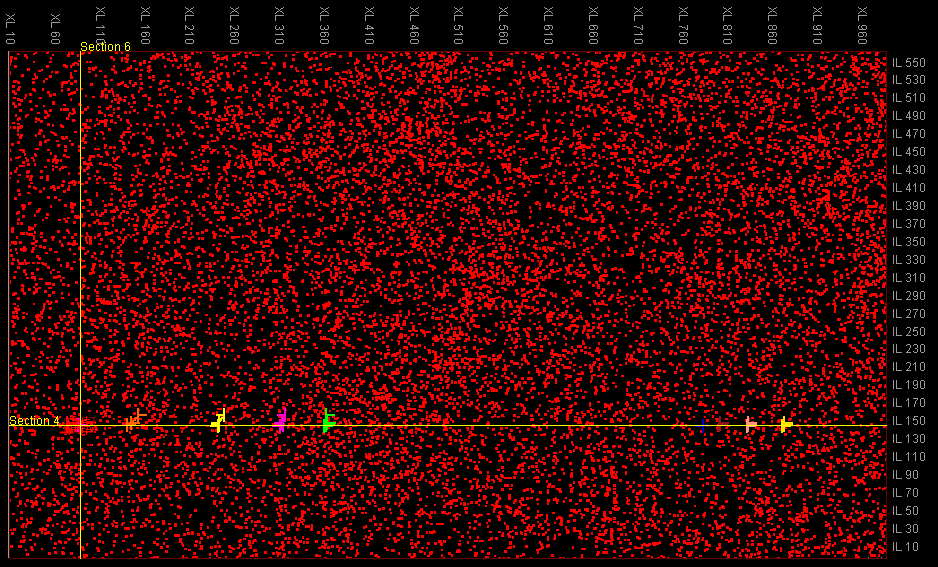
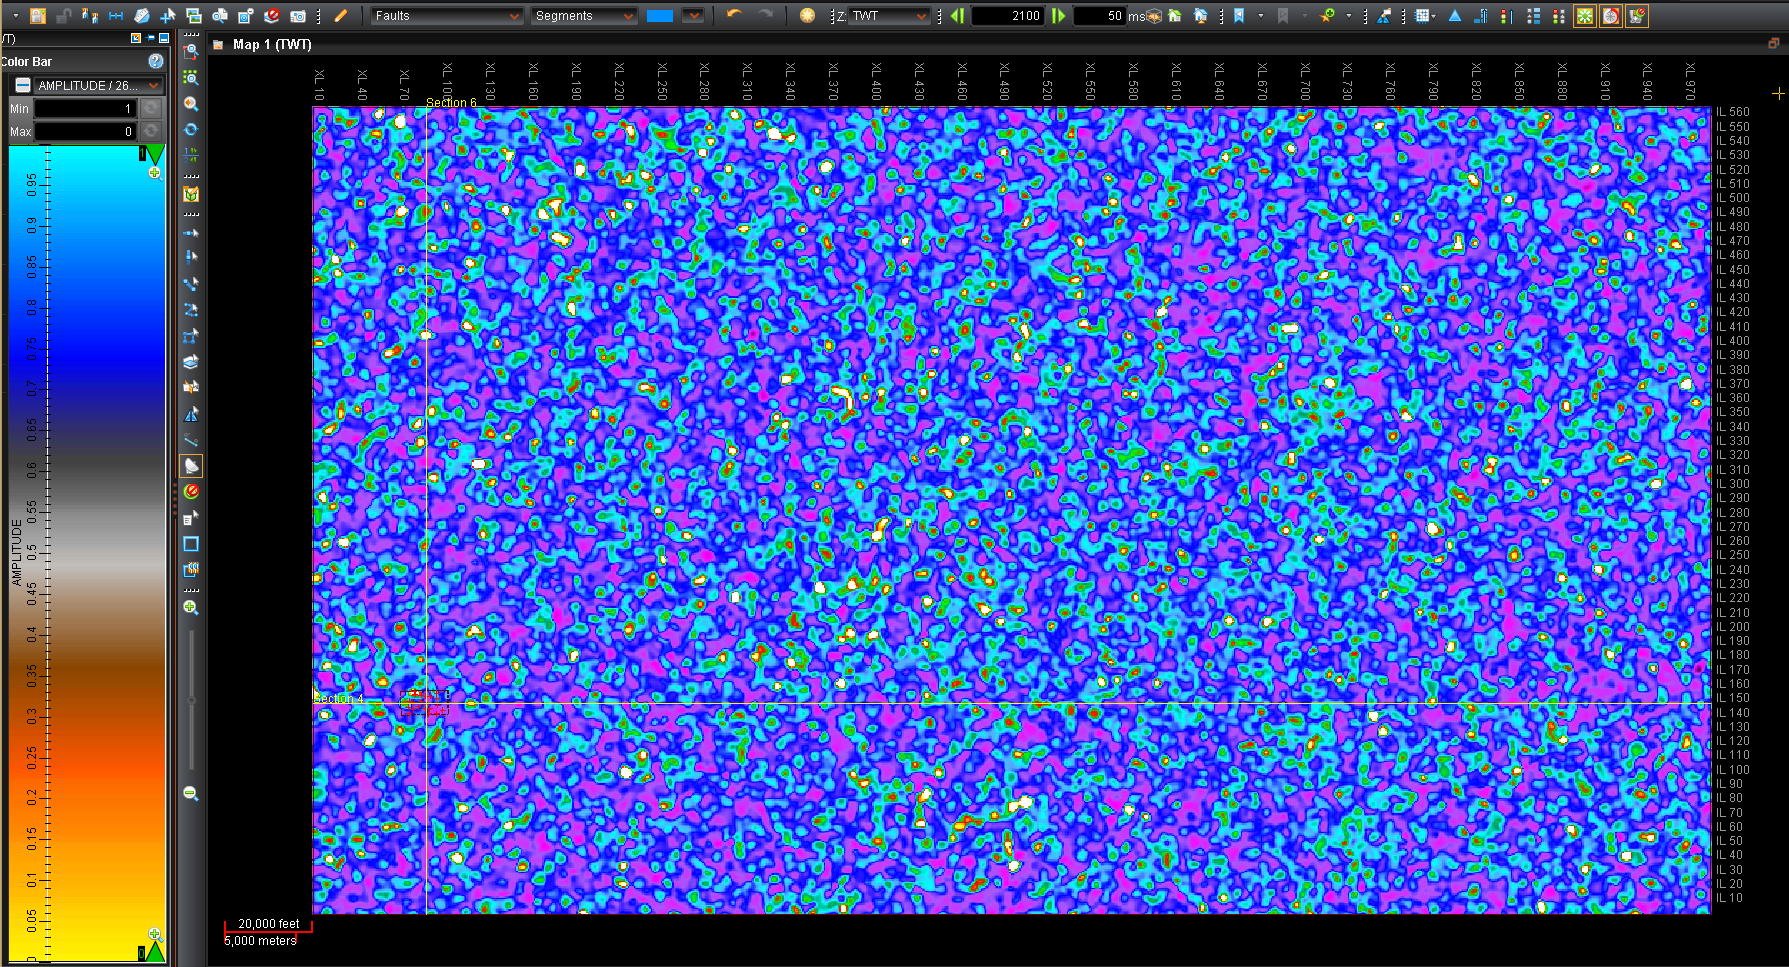
Lightning Stike Locations (Spike) 26833111-88 | Lightning Strike Rise-Time 26833111-88 |
 |  |
 |  |
 |  |
 |  |
 |  |
| Lightning Sensors Texas with Red Feedback Line | Low Amplitude Sensor Feedback right green fault |
Feedback Data Loss Early Processing Slice | Feedback Data Loss Later Processing Slice |
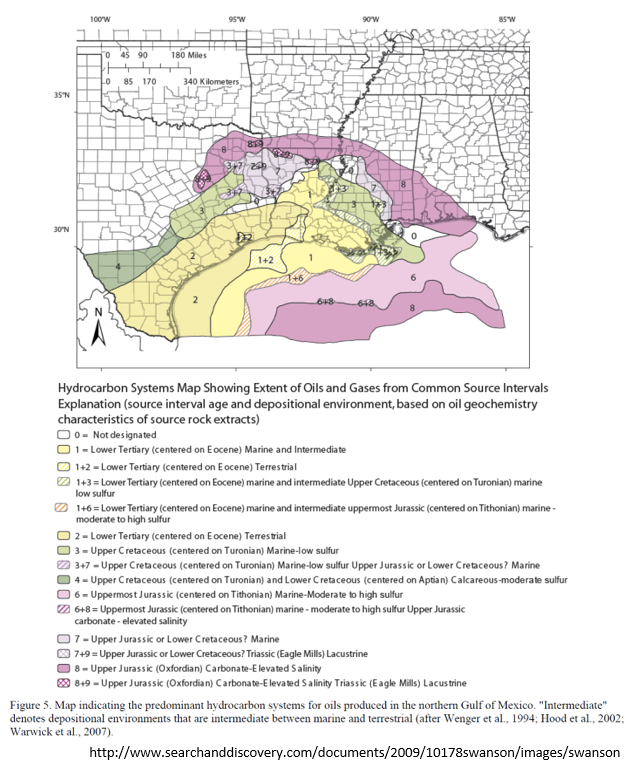
Interpretation with Sensor Feedback Data Loss | Hydrocarbon Systems Map Gulf of Mexico |
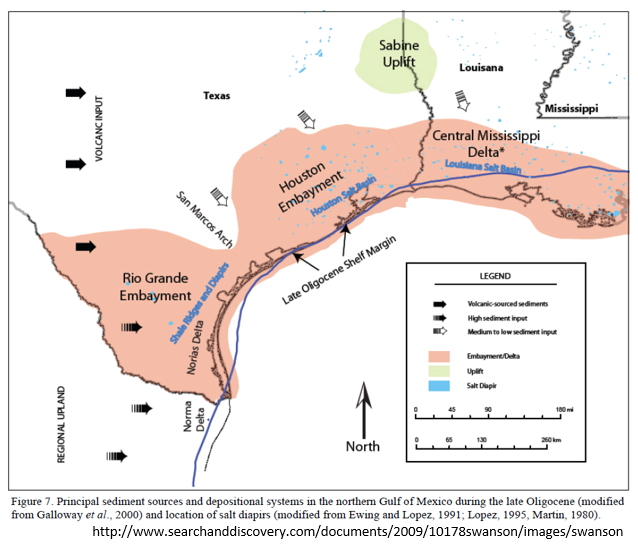
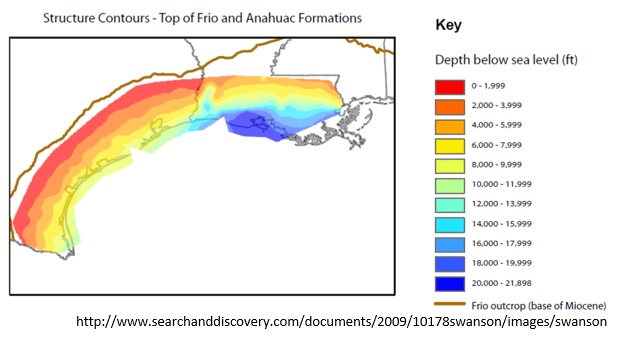
Sediment Sources Gulf of Mexico Onshore | Structure Map Top Frio & Anahuac |
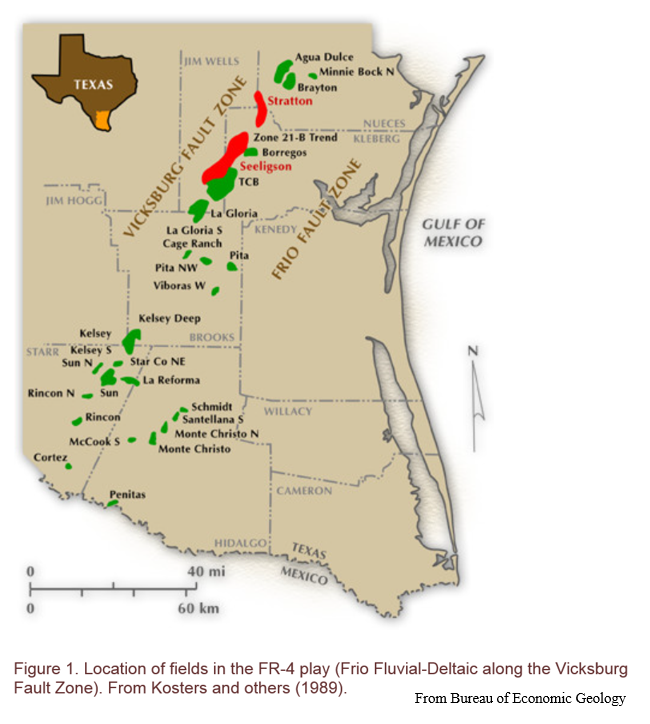
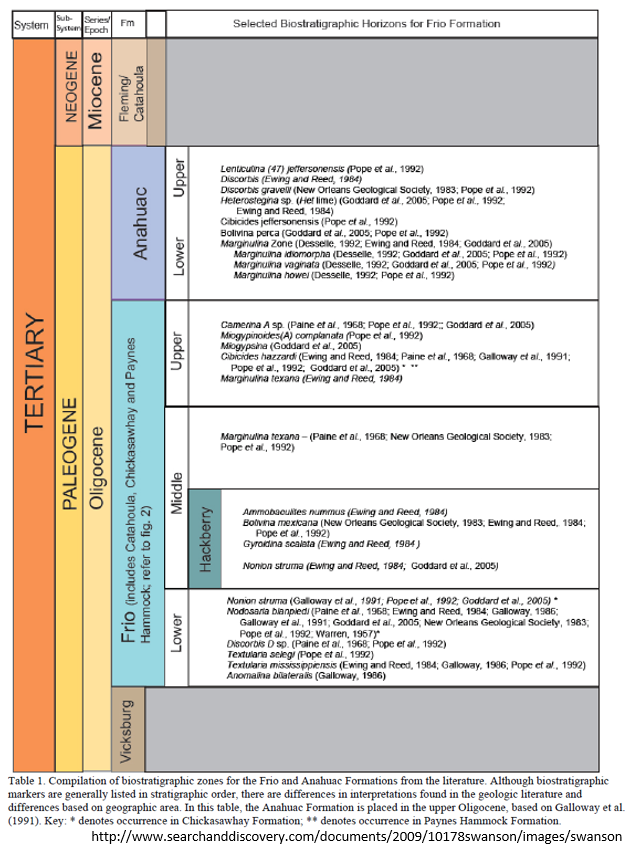
Fields in the Vicksburg to Frio Fault Zone | Biostratigrahic Horizons for Frio Formation |
 |  |
 |  |
 |  |
 |  |
 |  |
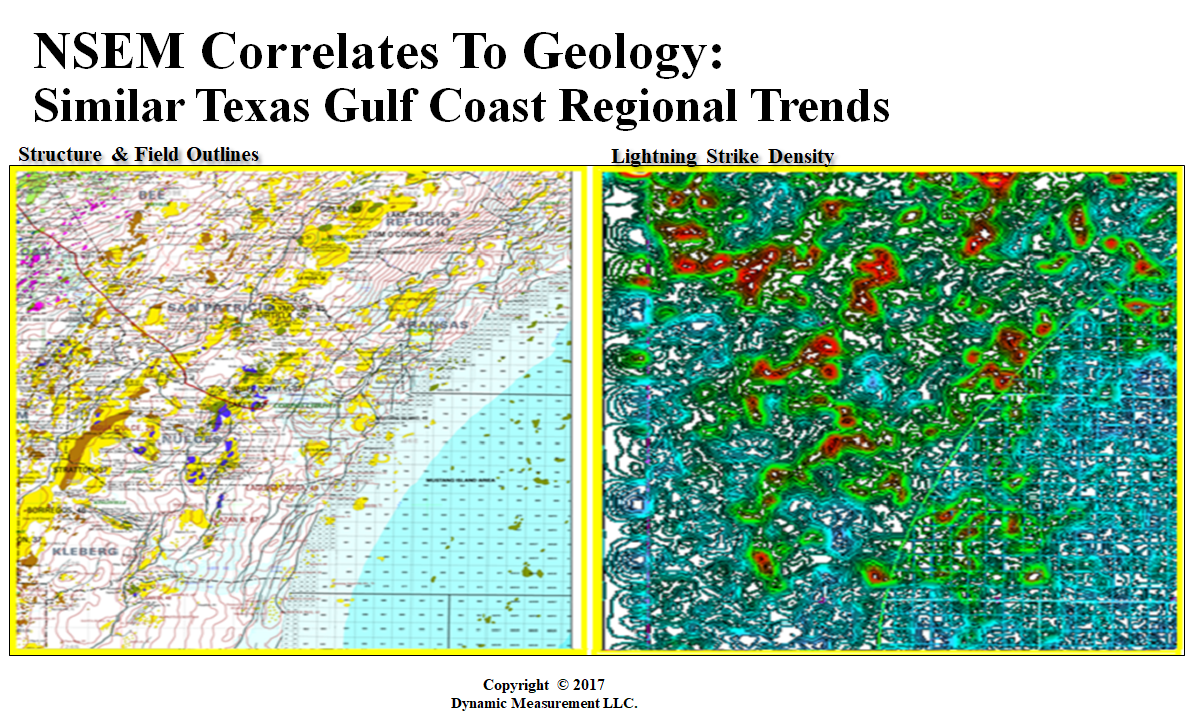
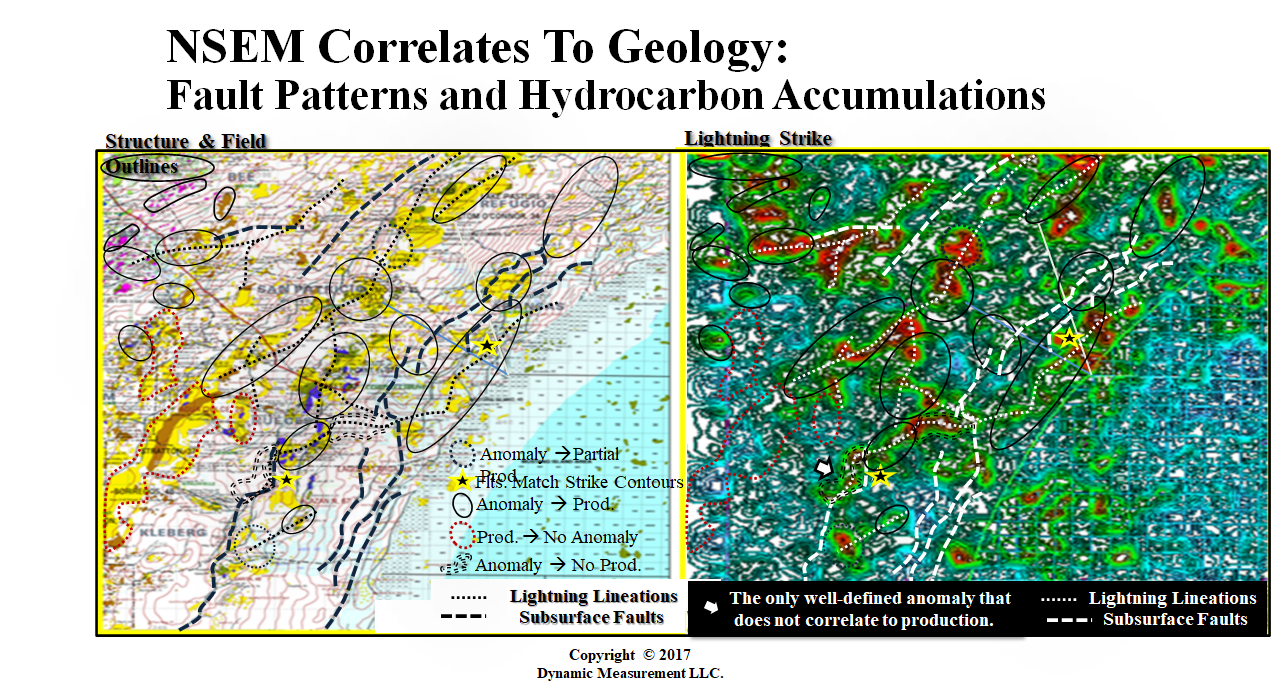
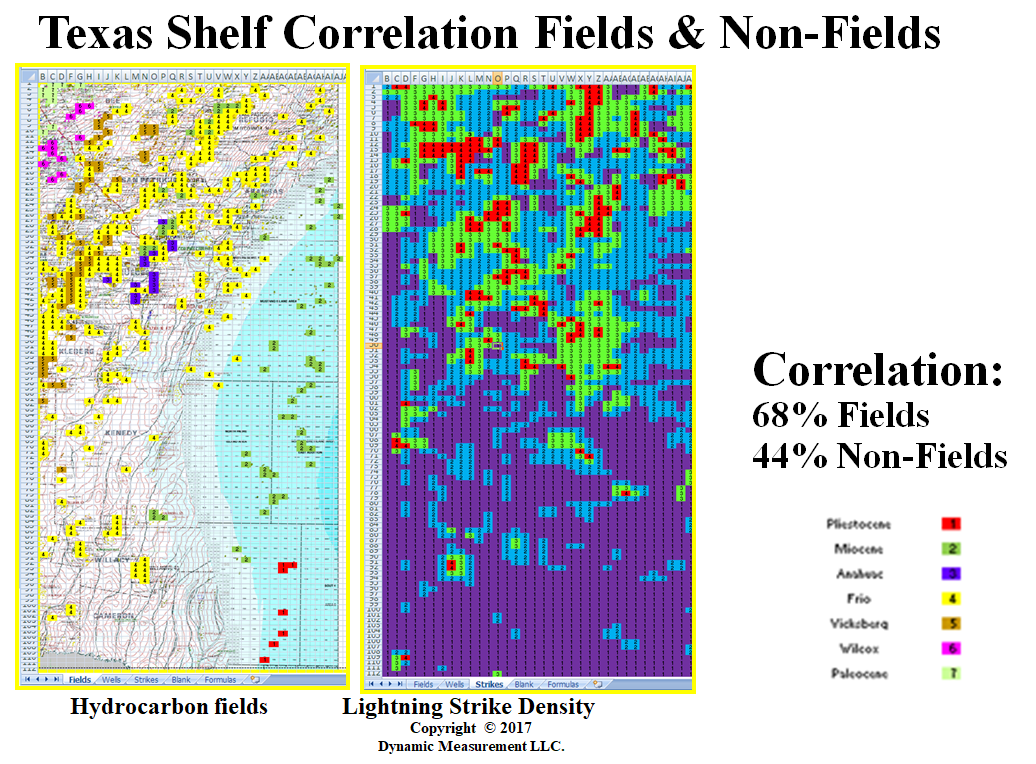
| Map comparing fields & lightning density contours | Louie Berent's detail comparison faults & lineations |
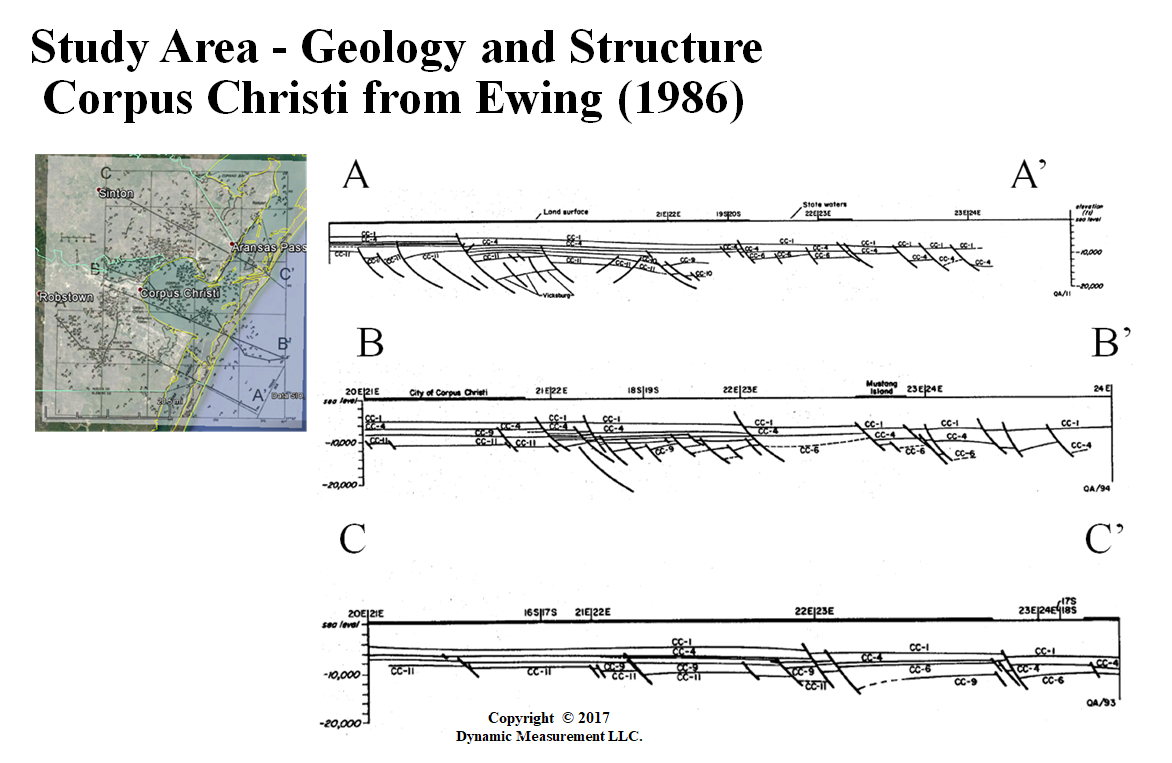
Gridding both quantitatively correlation | BEG Seismic & Log Interpretation South Texas |
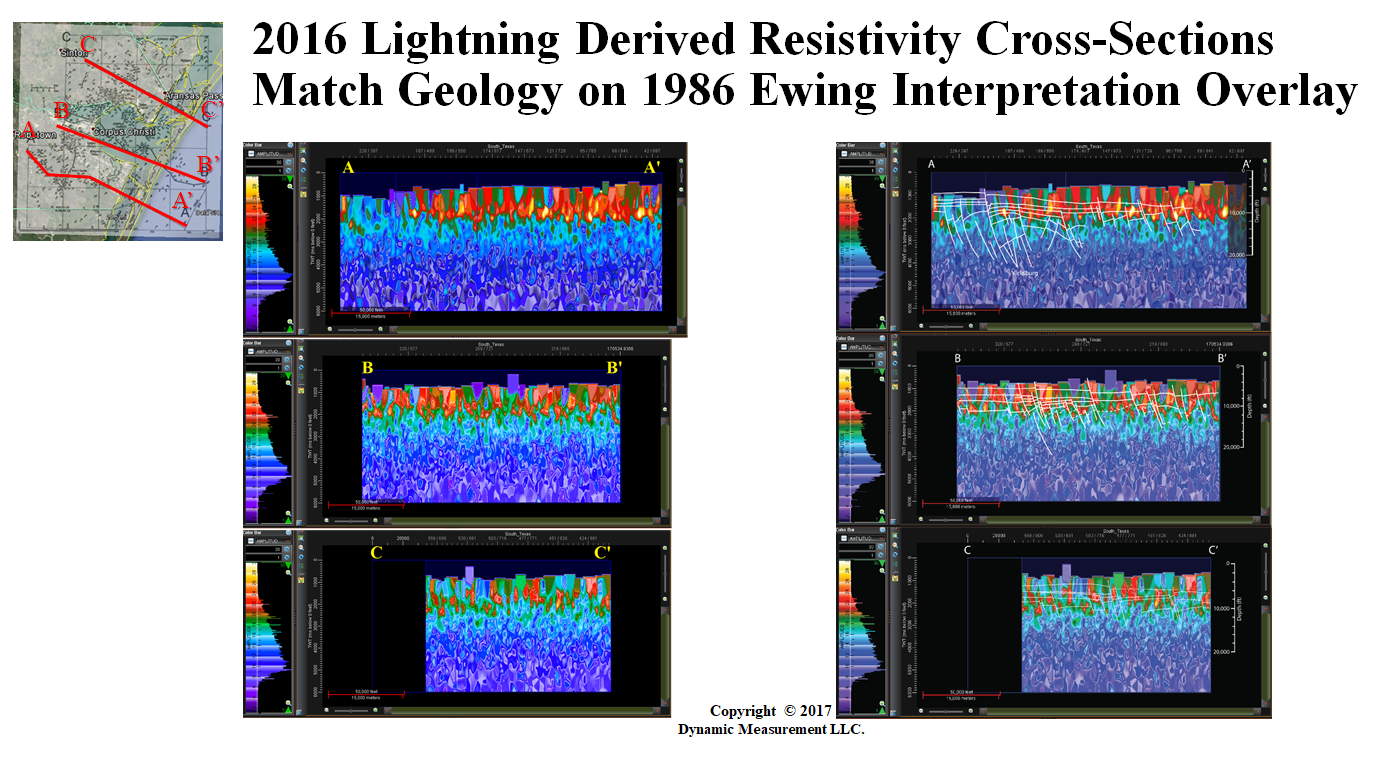
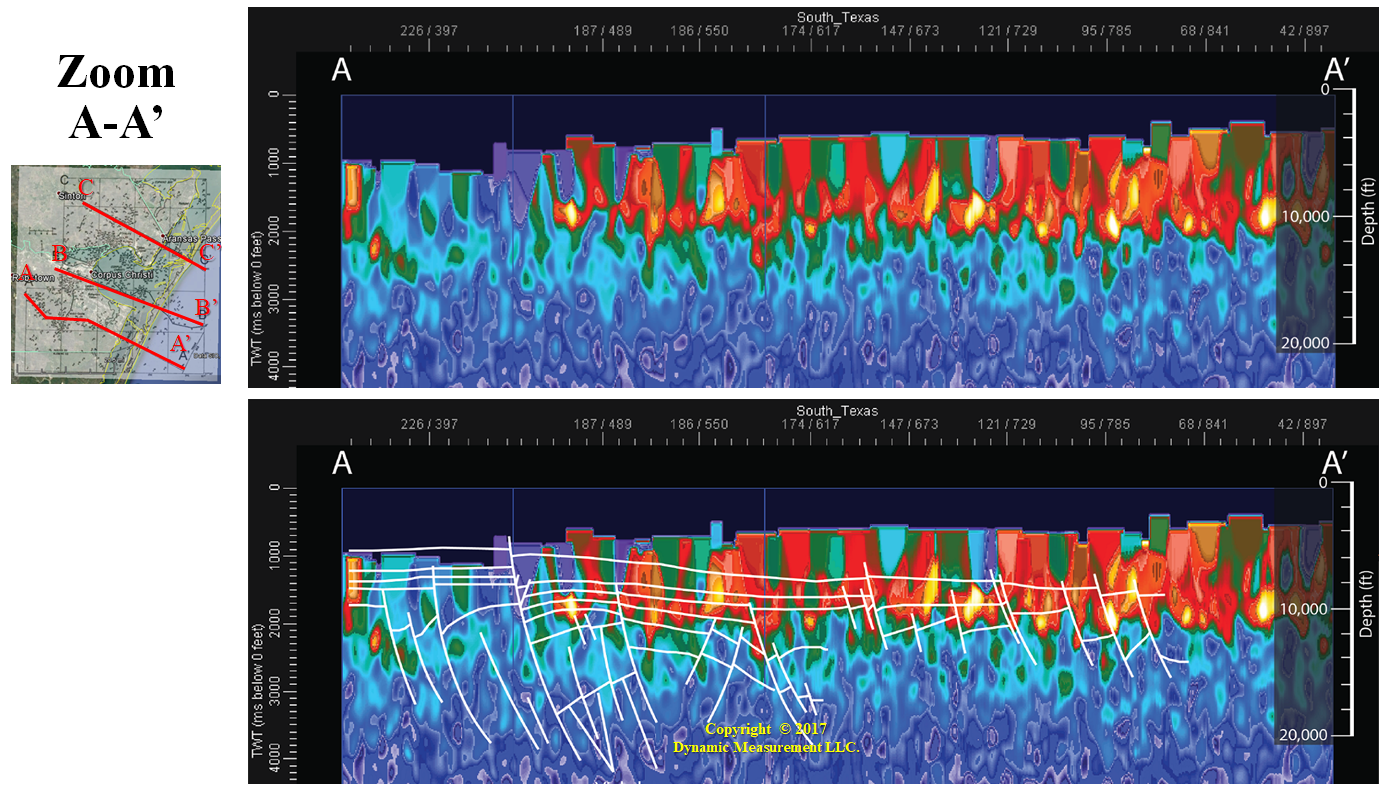
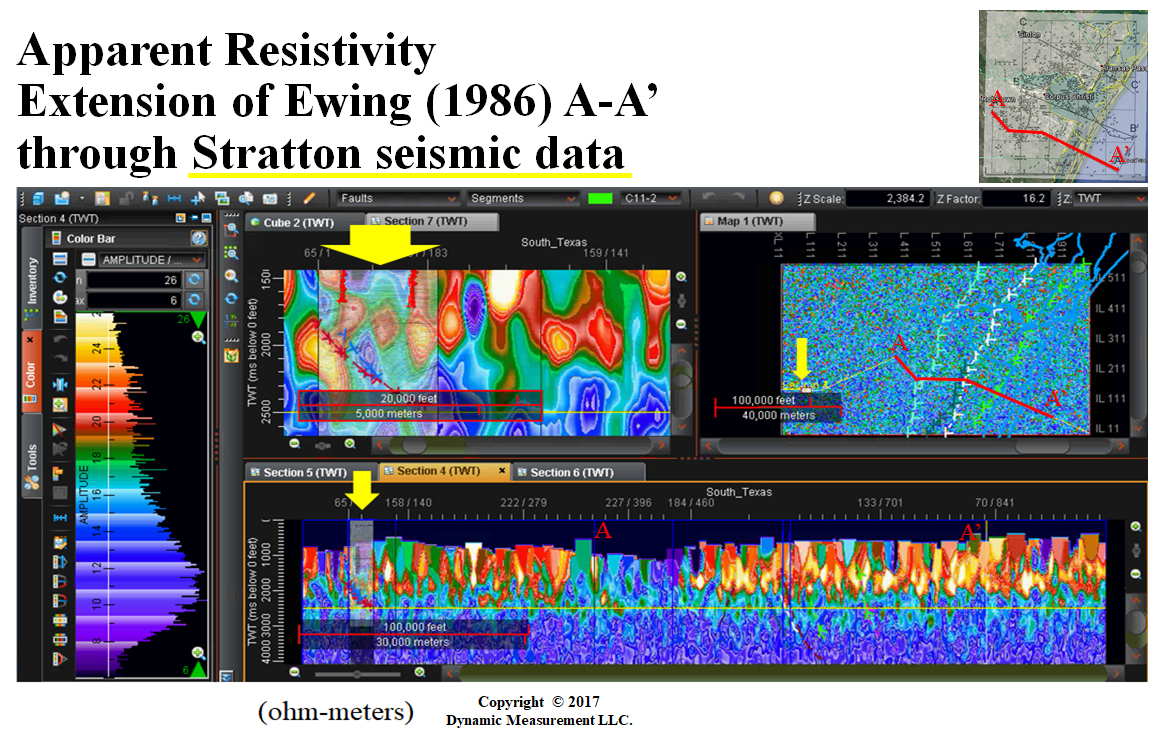
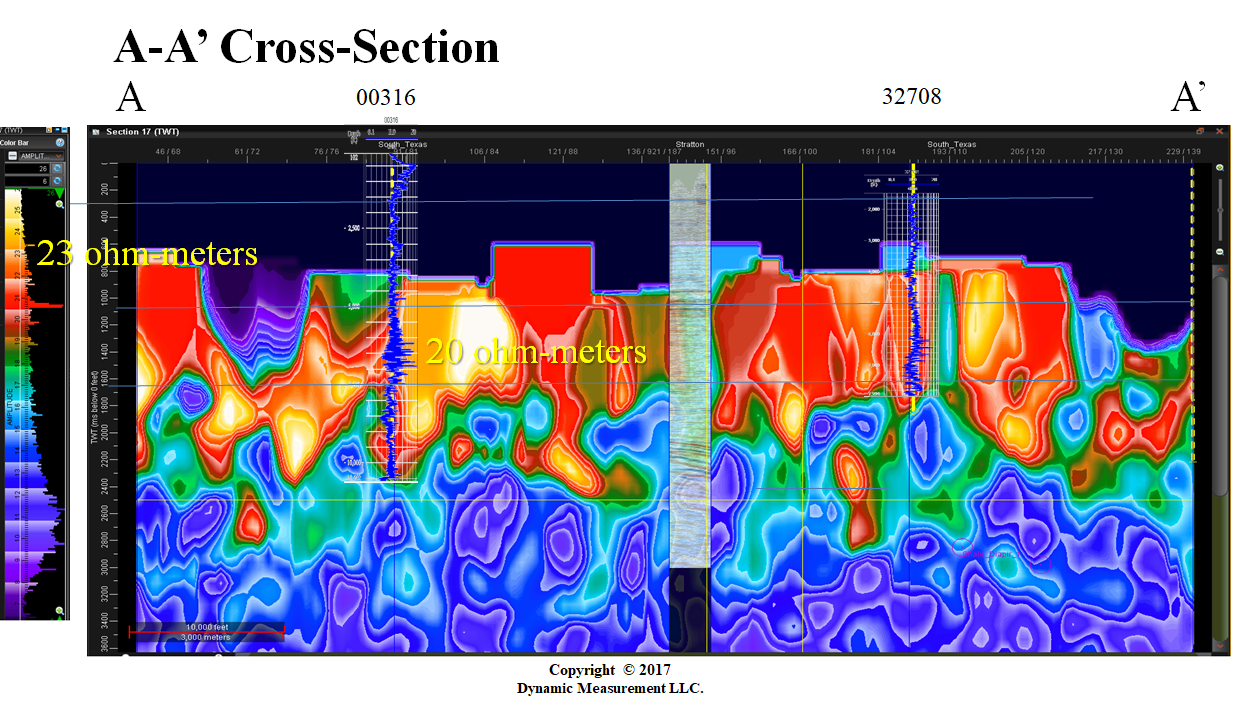
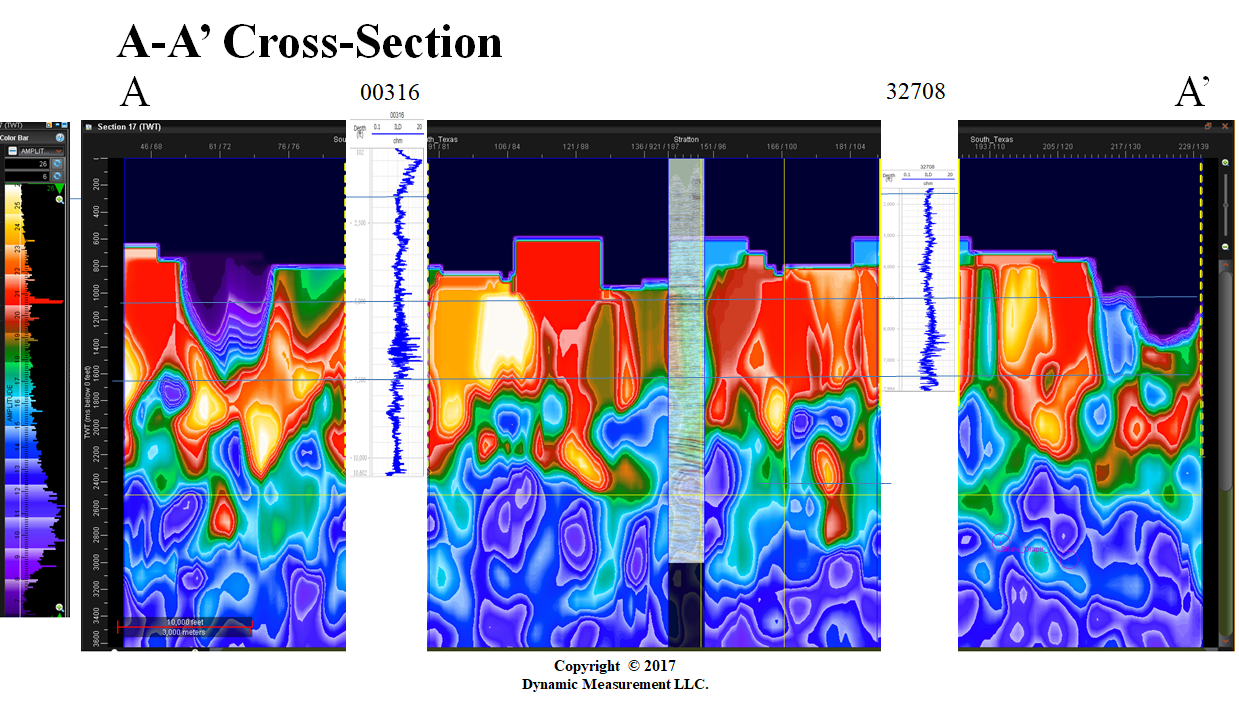
2016 lightning sections with 1986 geology overlay | Closeup A-A', note resistivity matches faults |
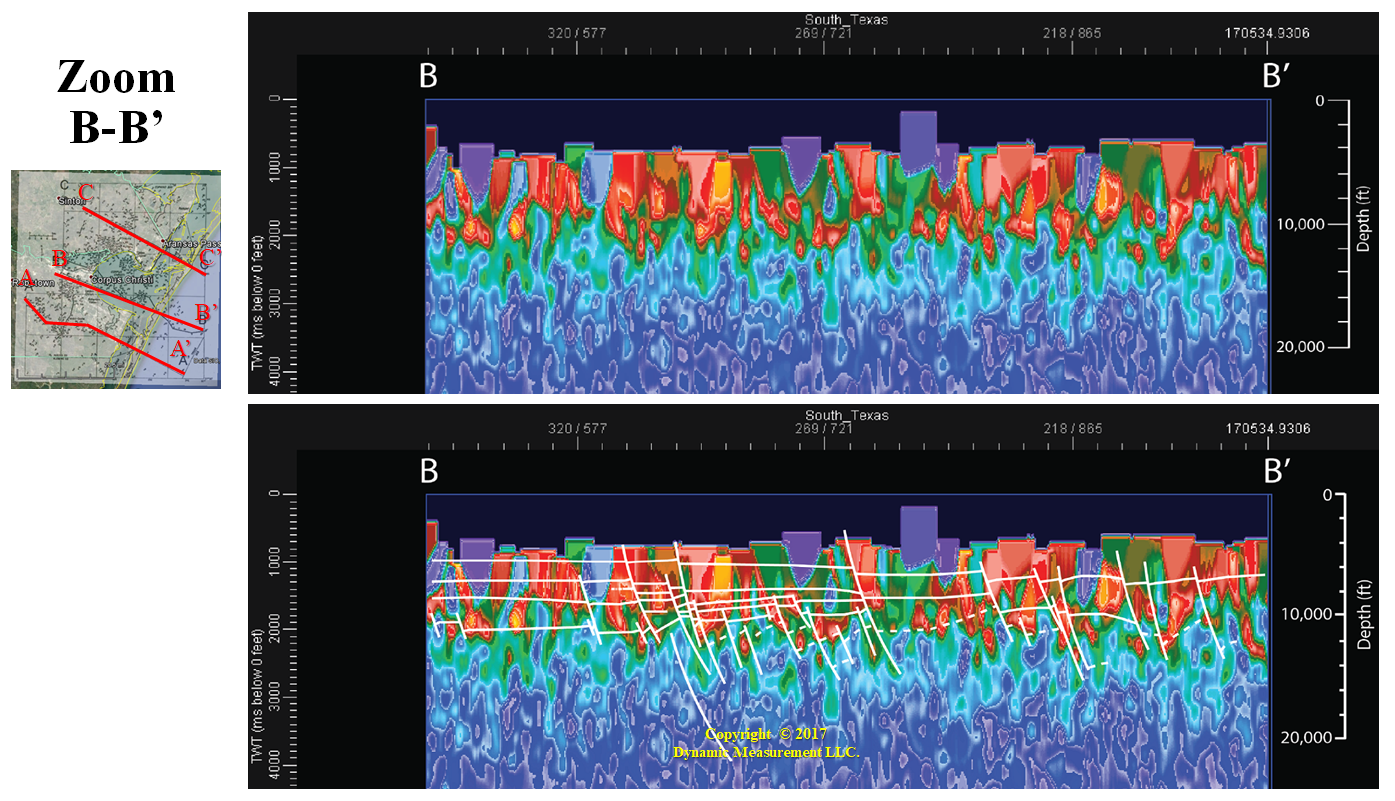
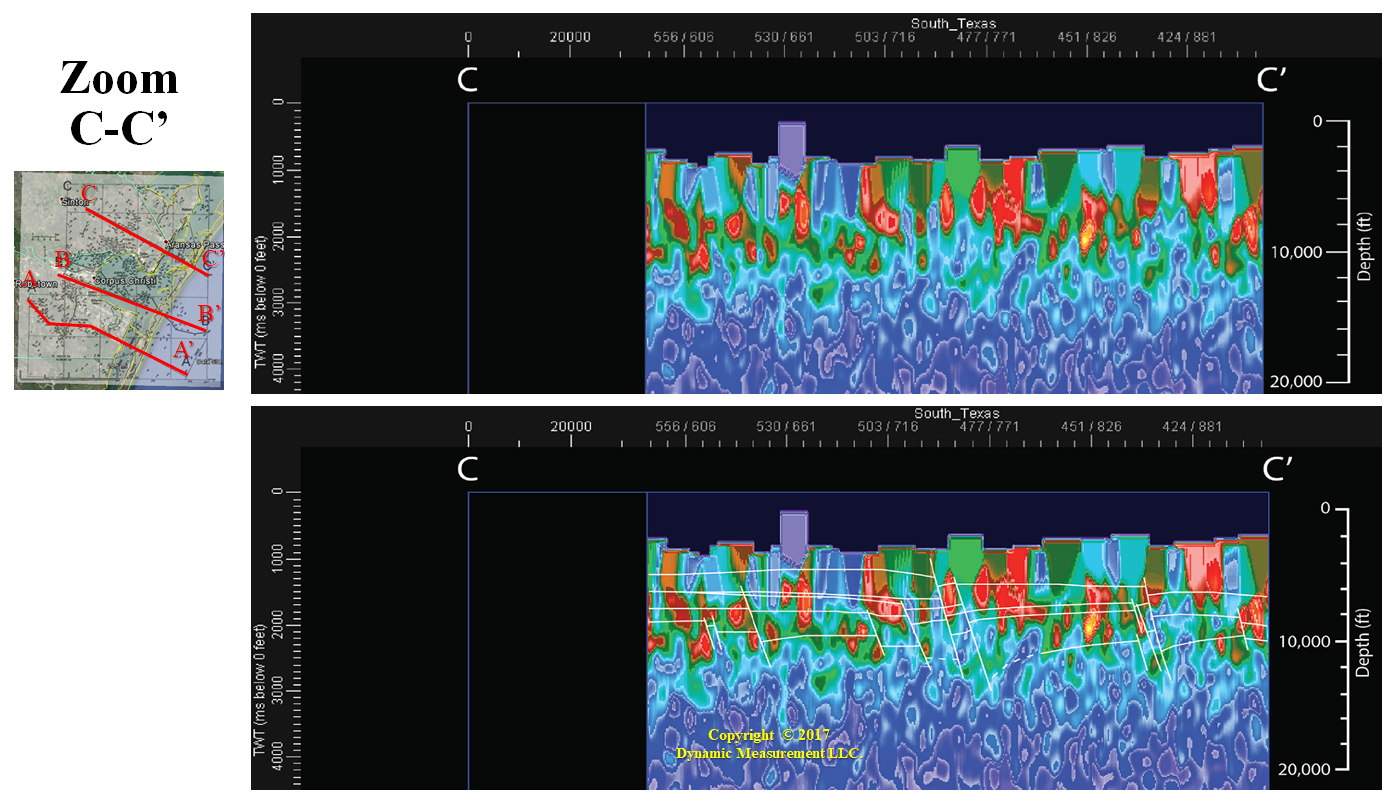
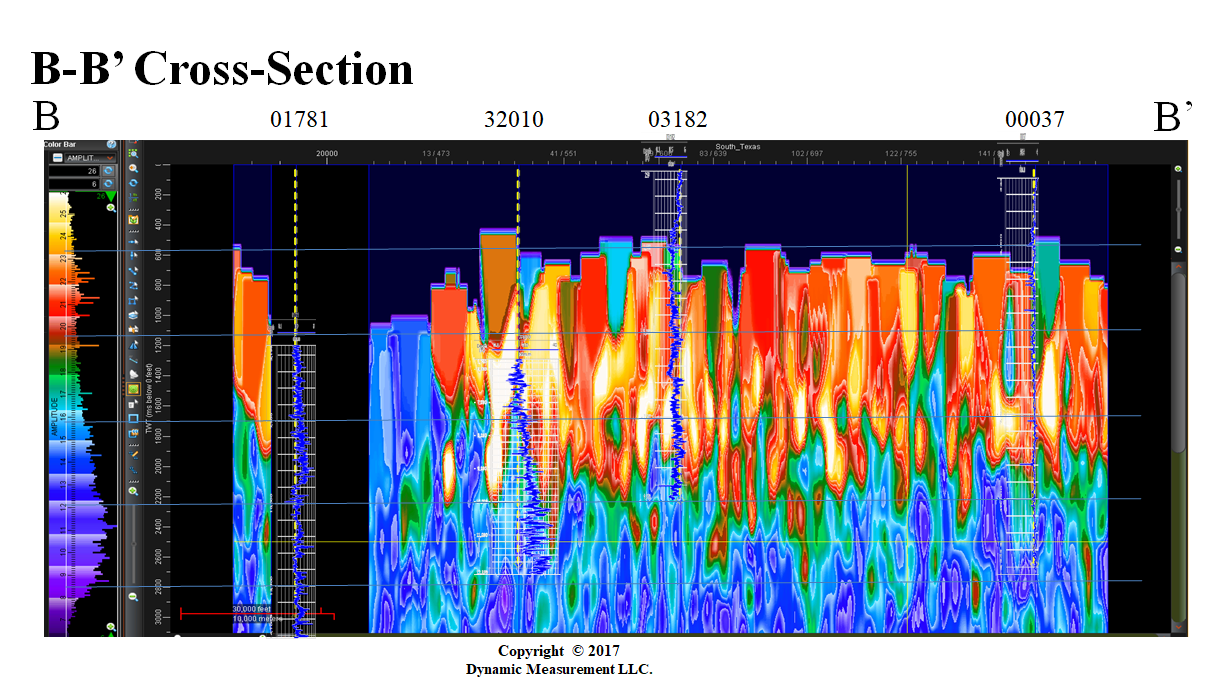
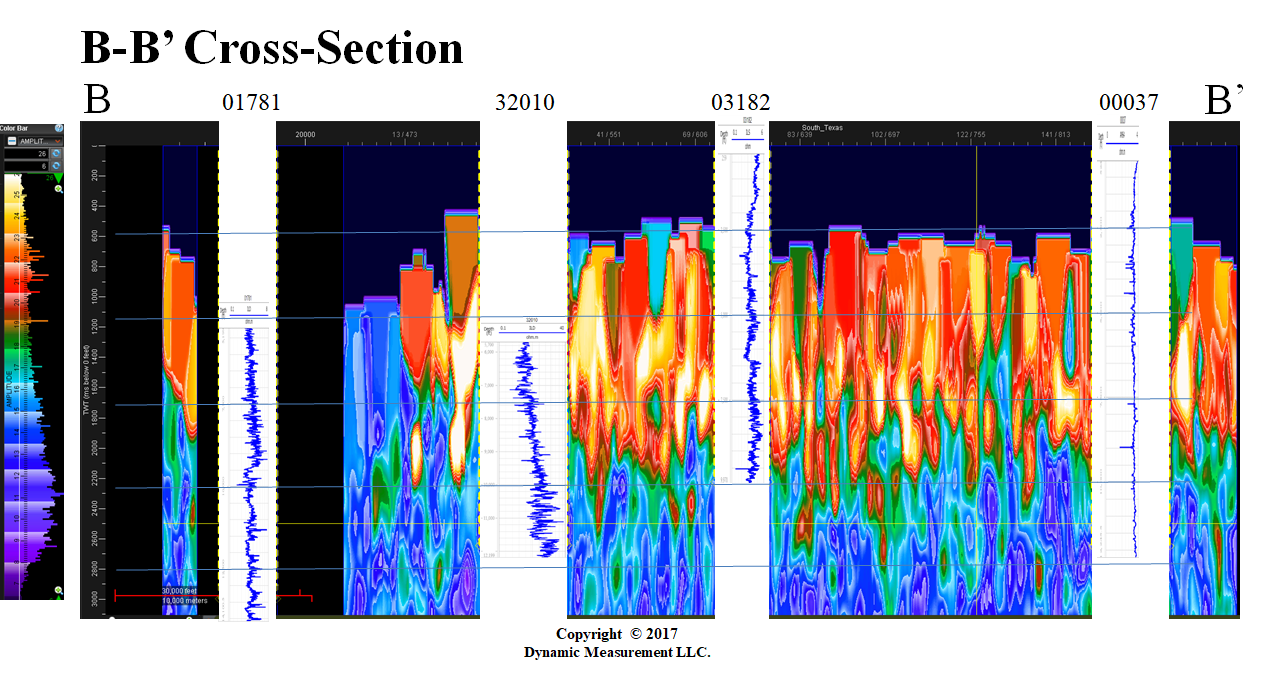
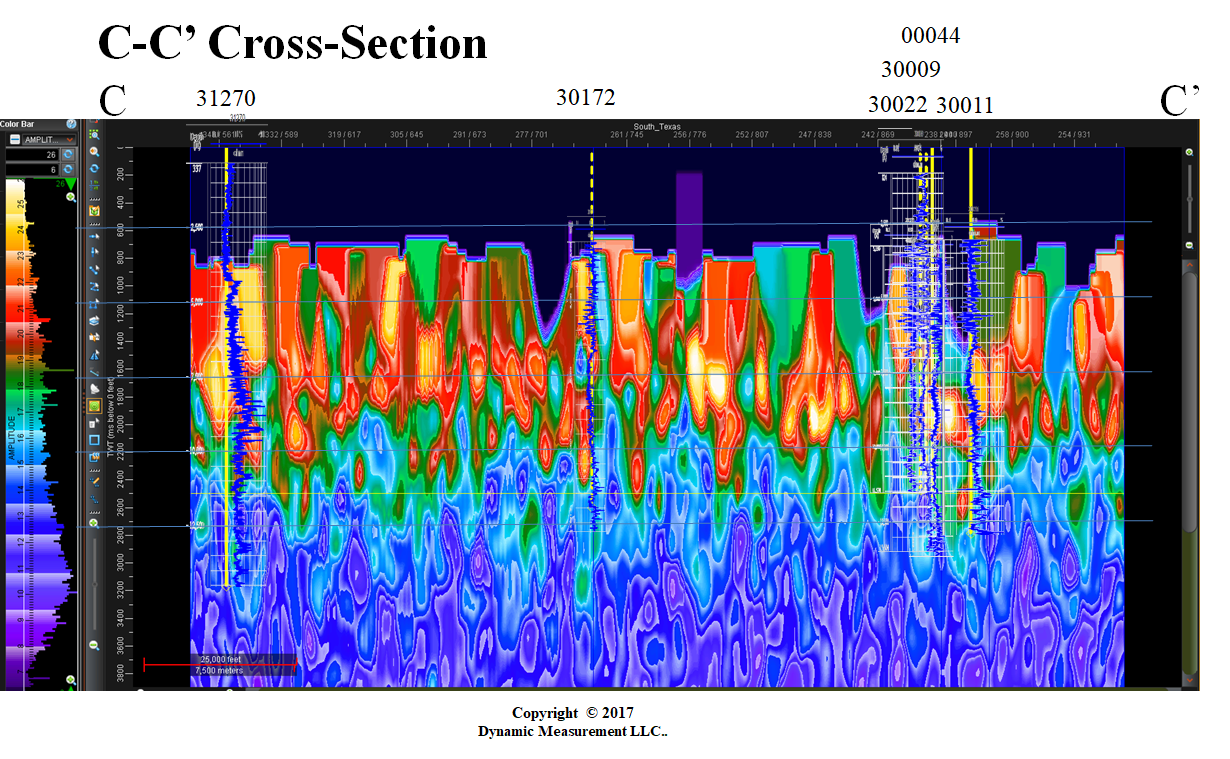
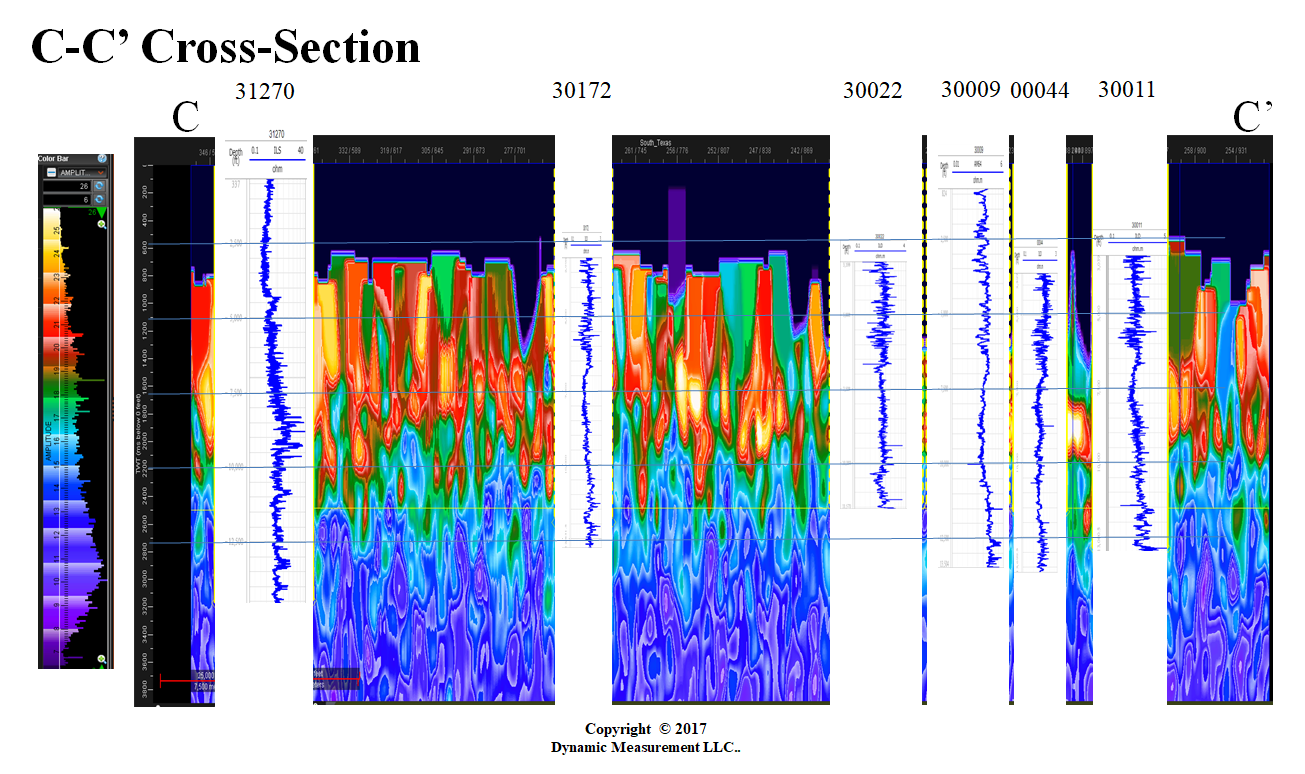
Closeup B-B', note resistivity above faults | Closeup C-C', possible gas migration paths |
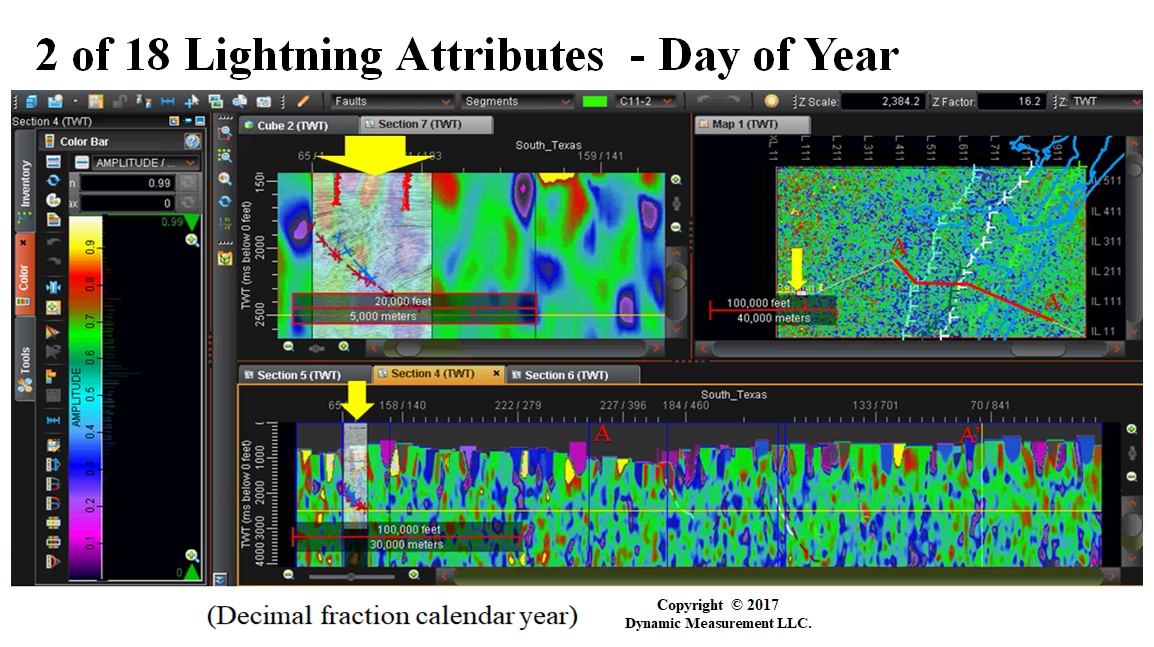
3.5 and 65 mile resistivity sections South Texas | Attribute: Day-of-Year Lightning Struck |
 |  |
 |  |
 |  |
 |  |
 |  |
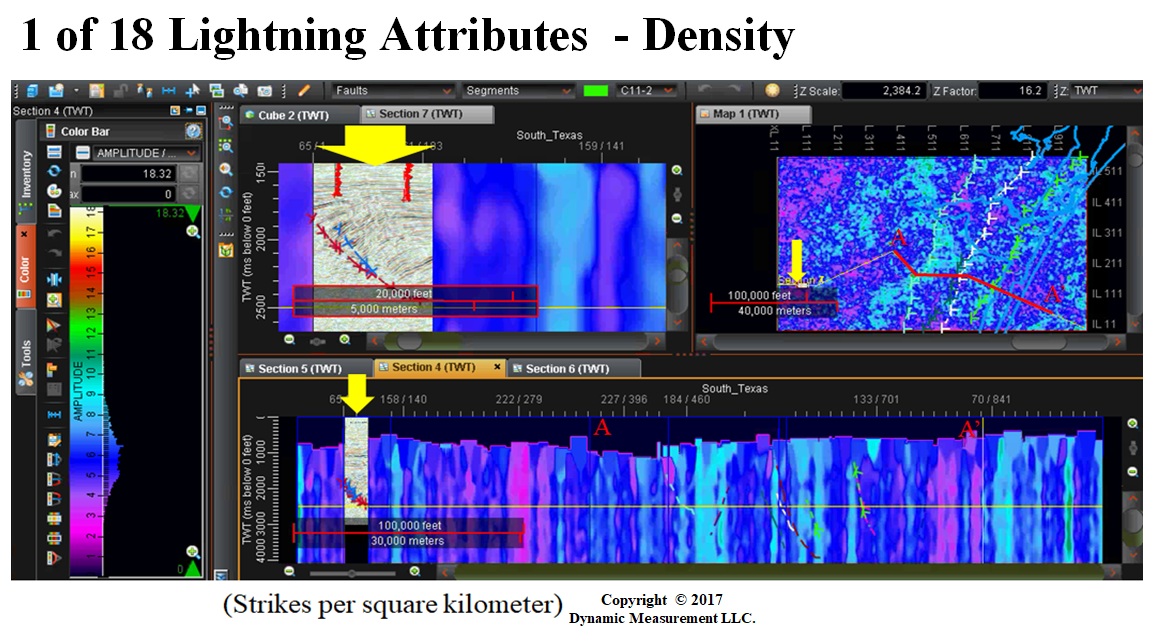
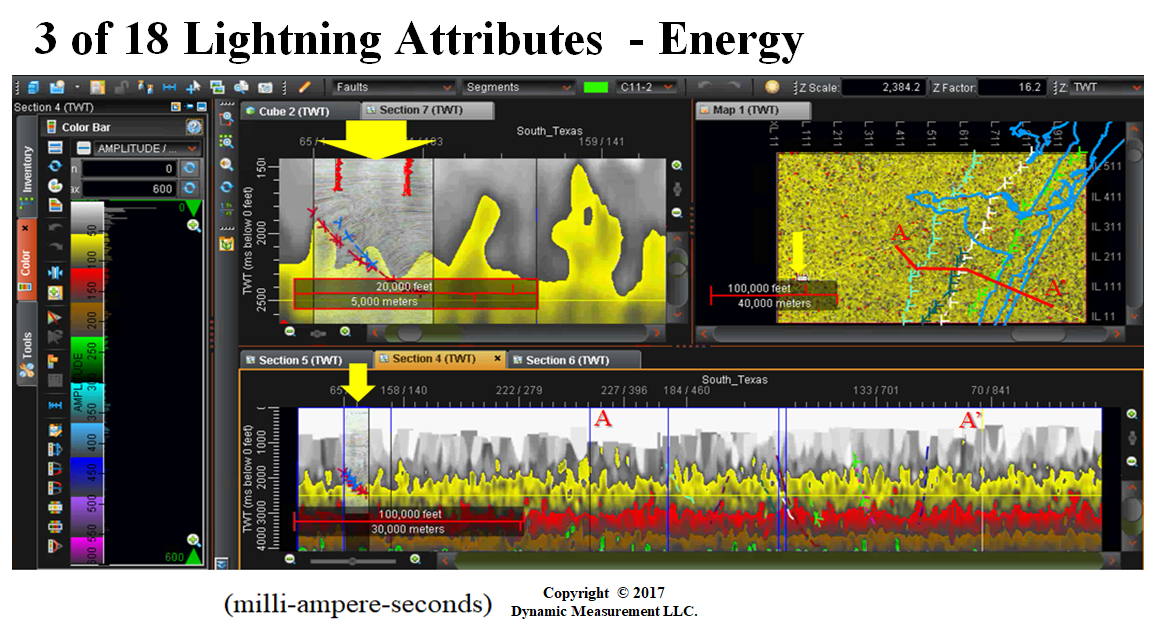
| Attribute: Lightning Density | Attribute: Lightning Energy |
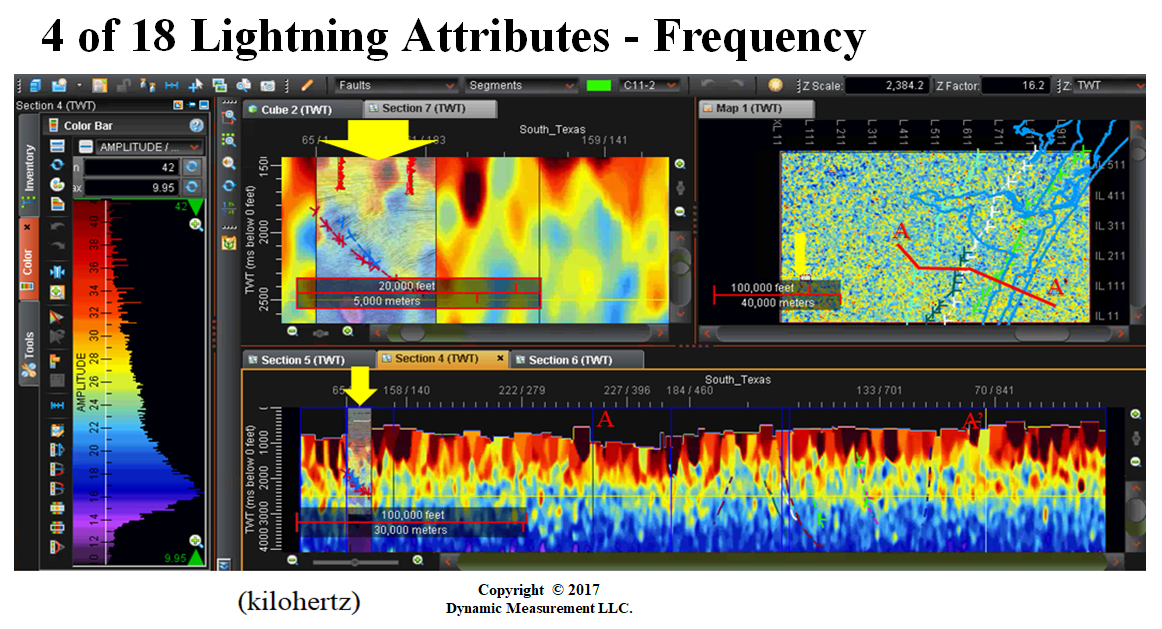
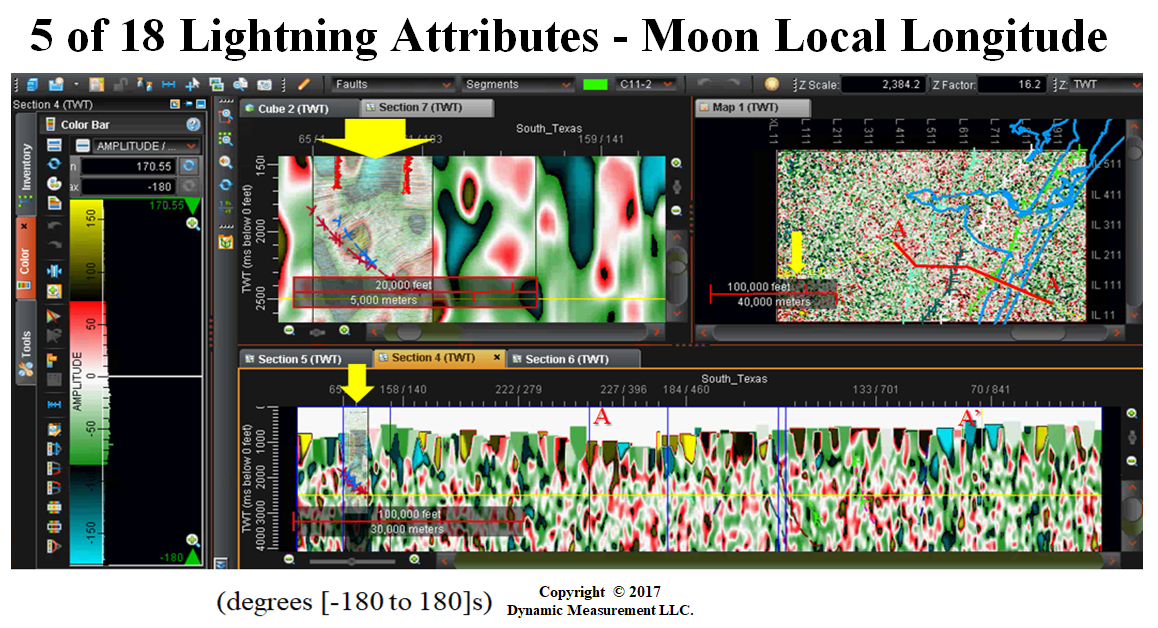
Attribute: Frequency | Attribute: Moon Local Longitude |
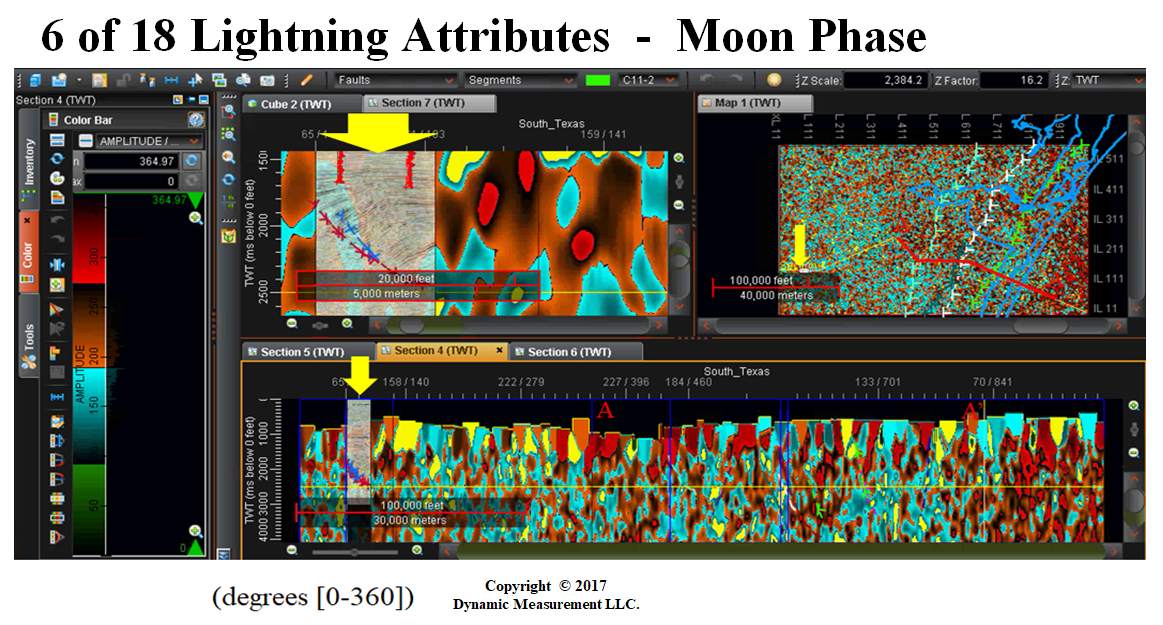
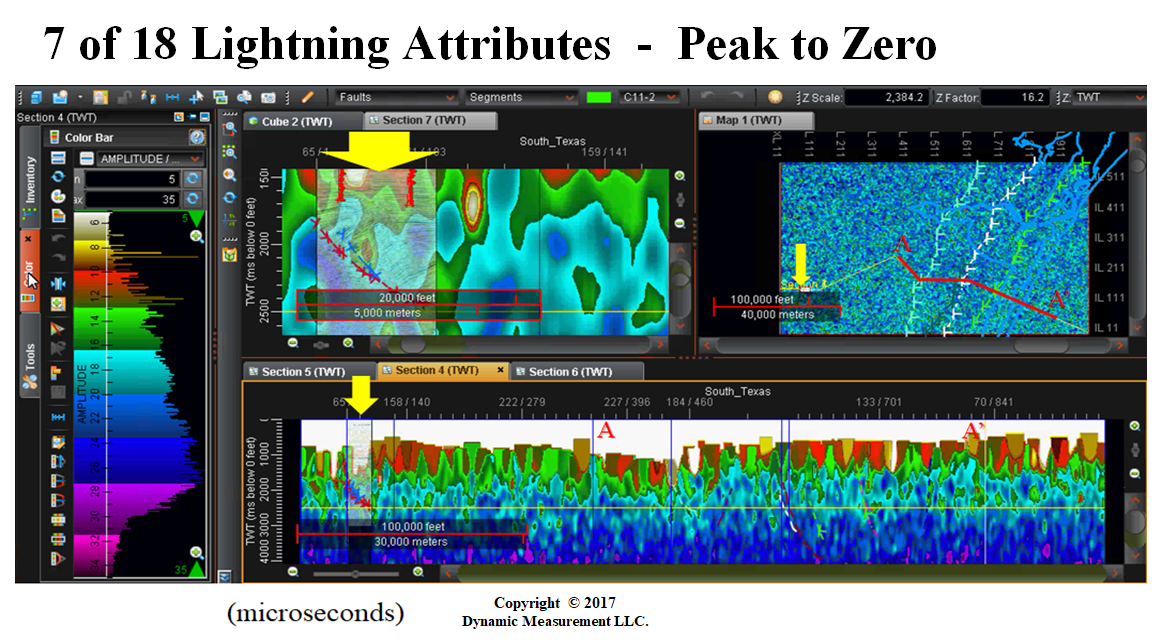
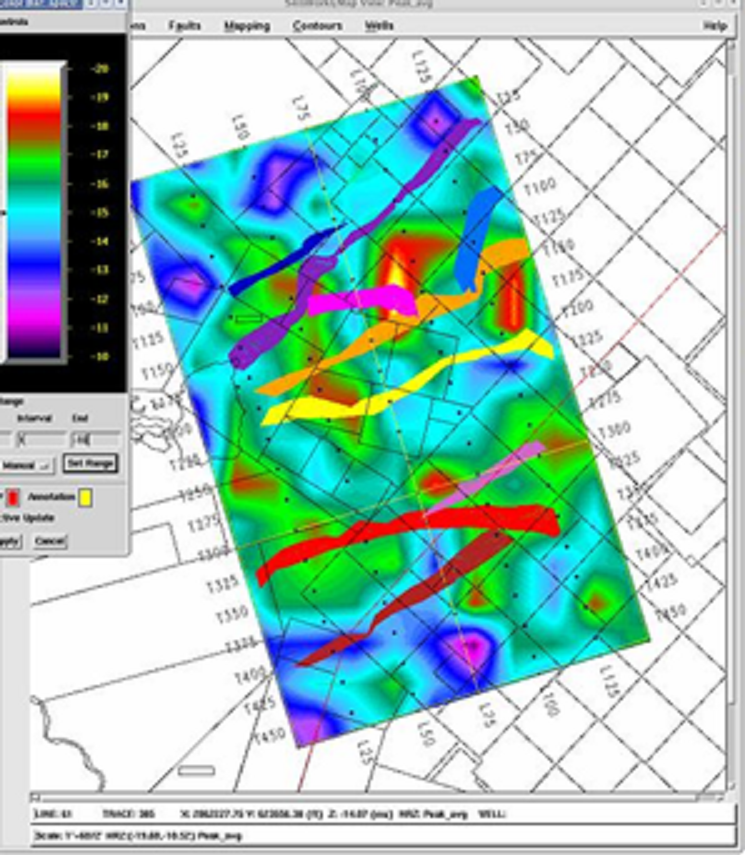
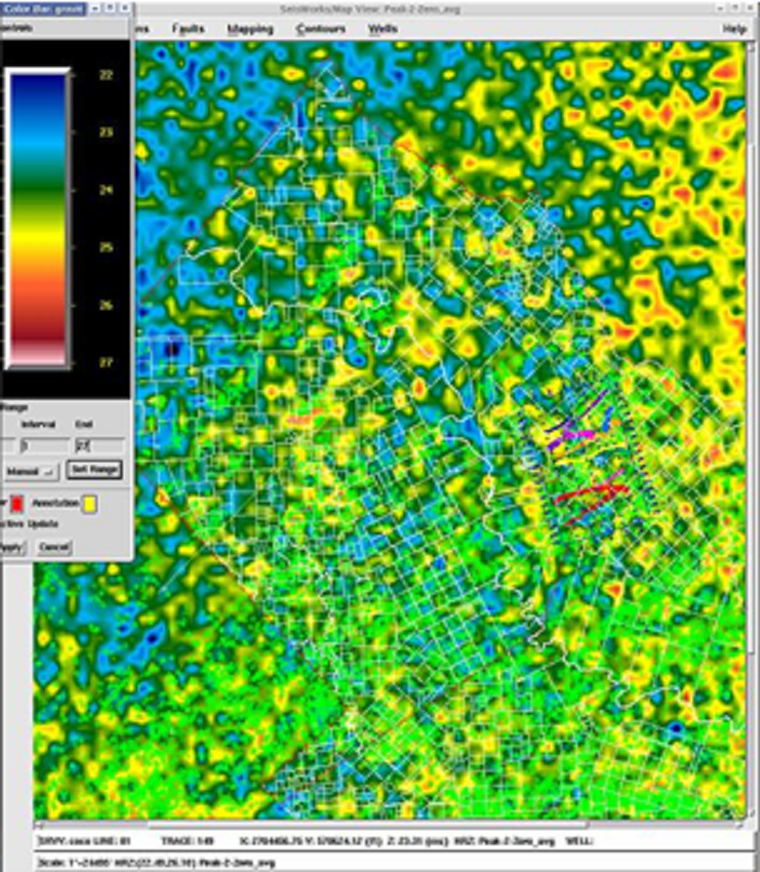
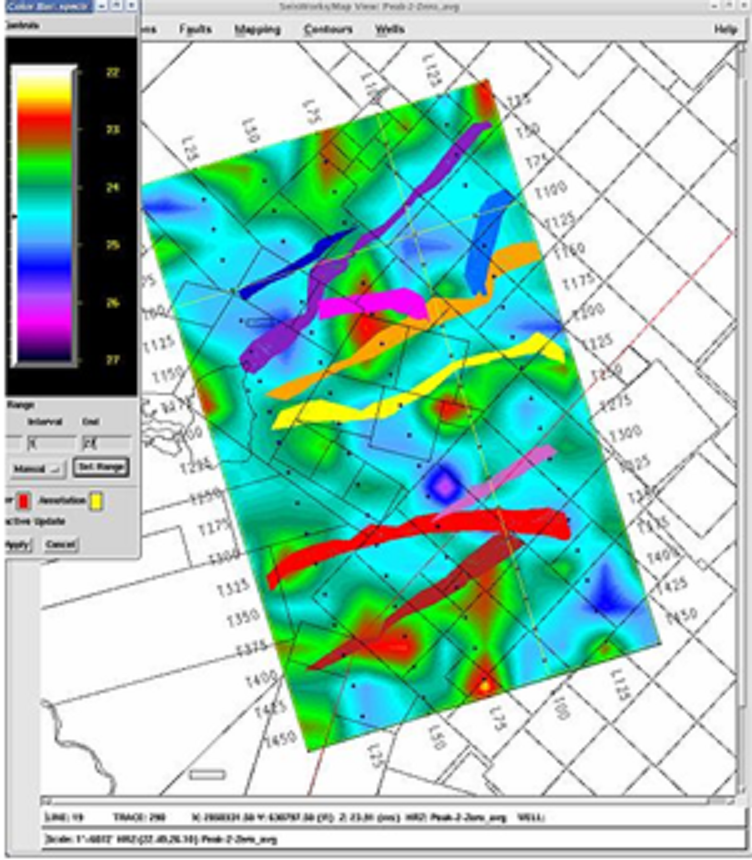
Attribute: Moon Phase | Attribute: Peak-to-Zero |
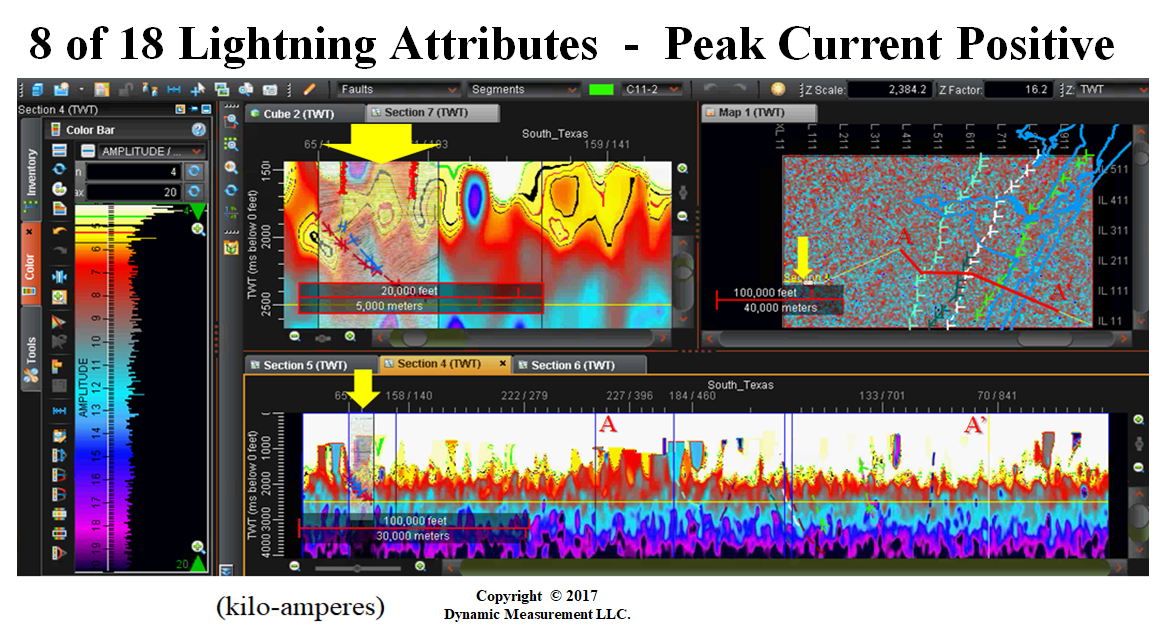
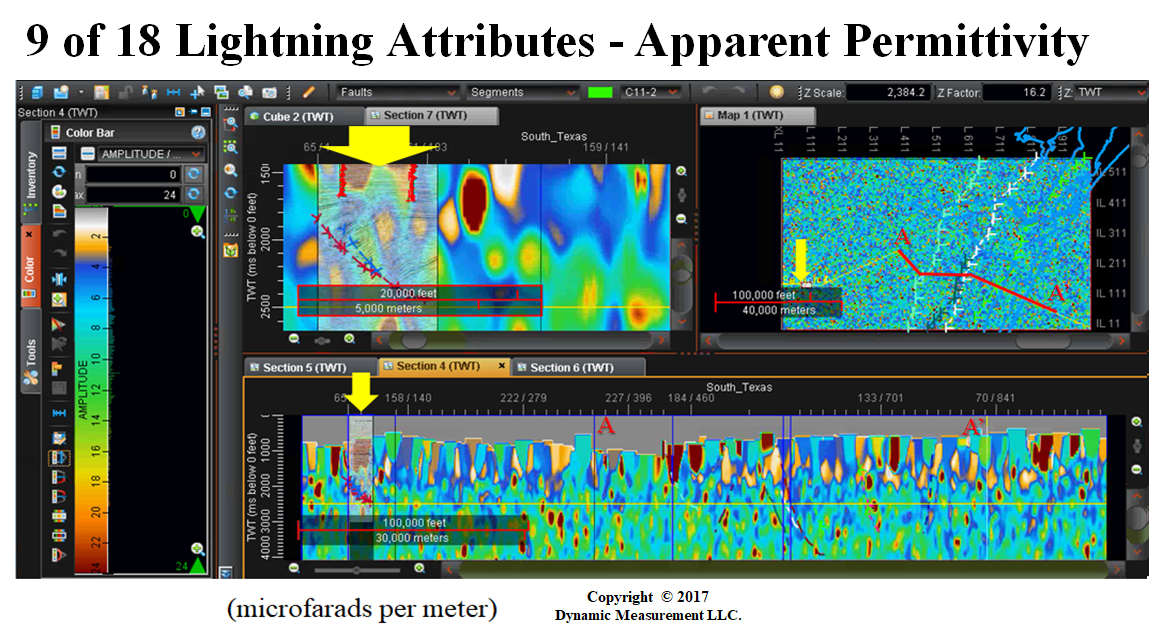
Attribute: Peak Current Positive | Attribute: Permittivity |
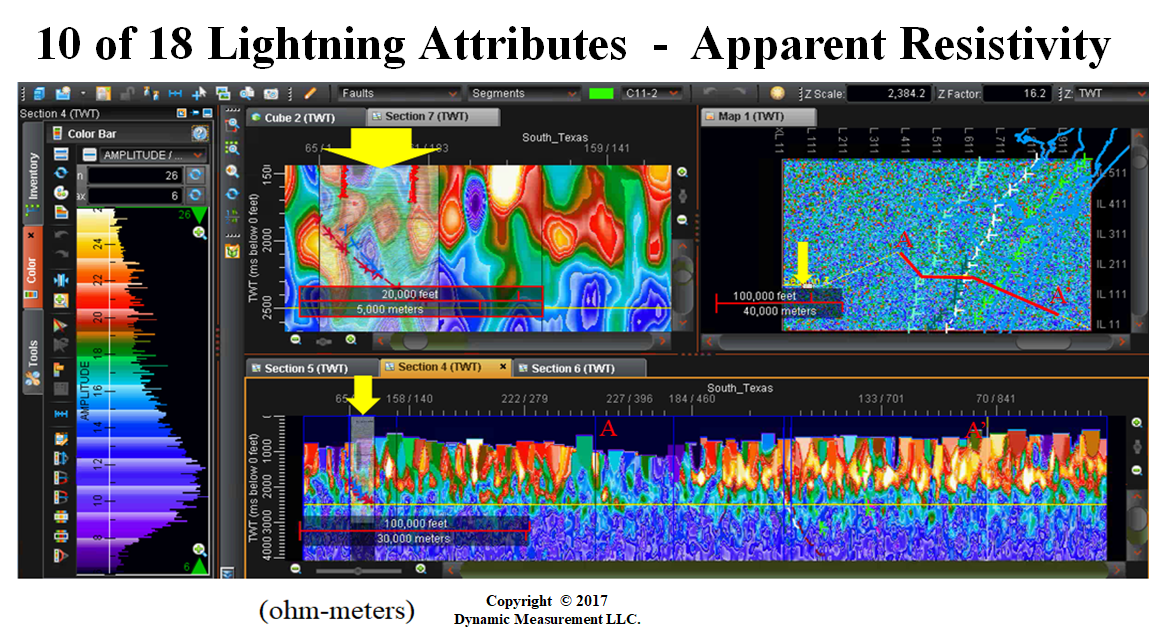
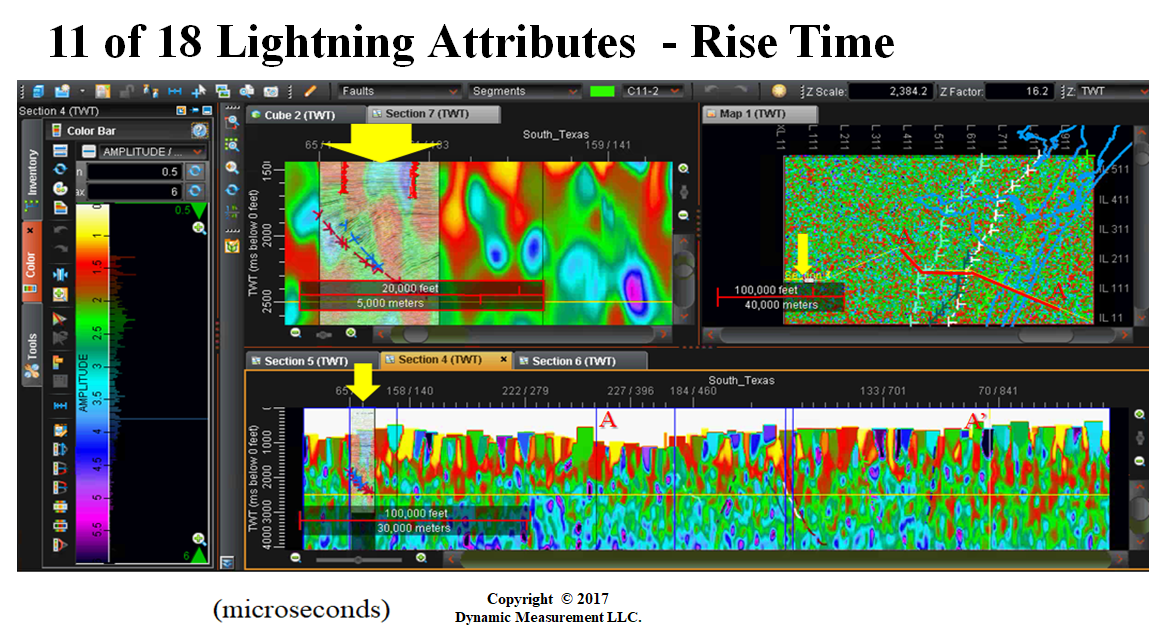
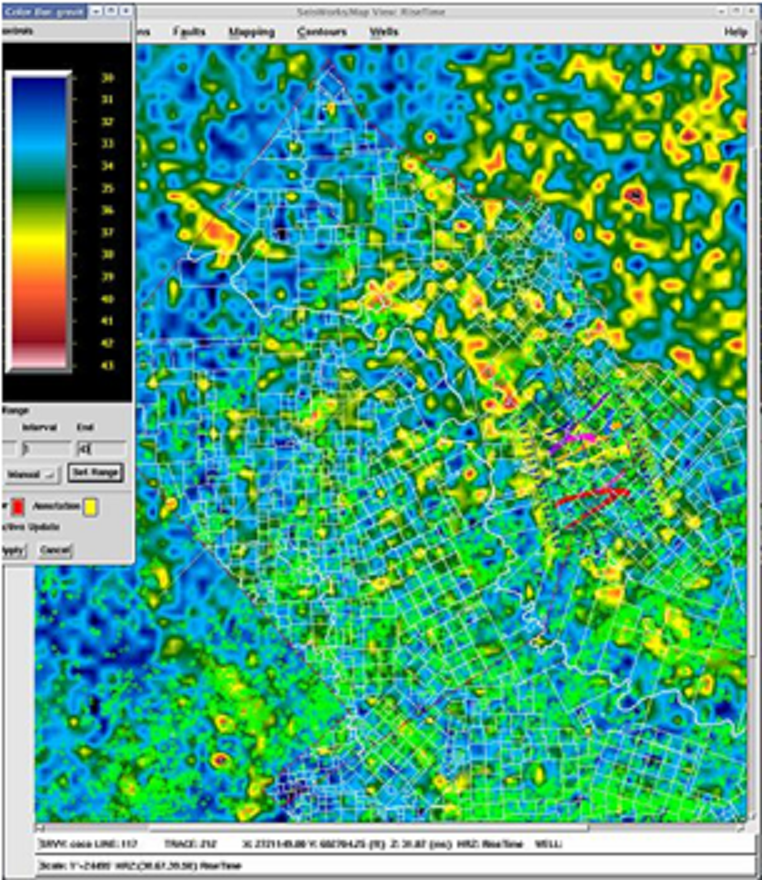
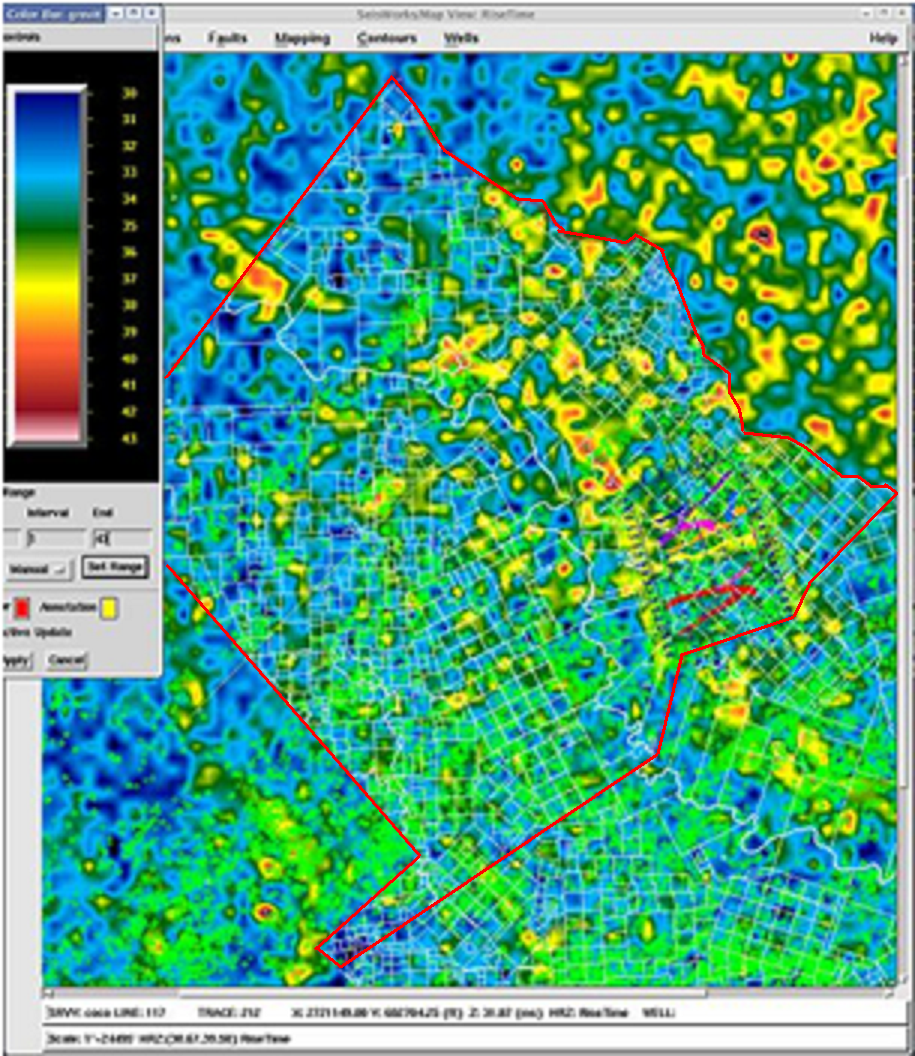
Attribute: Apparent Resistivity | Attribute: Rise-Time |
 |  |
 |  |
 |  |
 |  |
 |  |
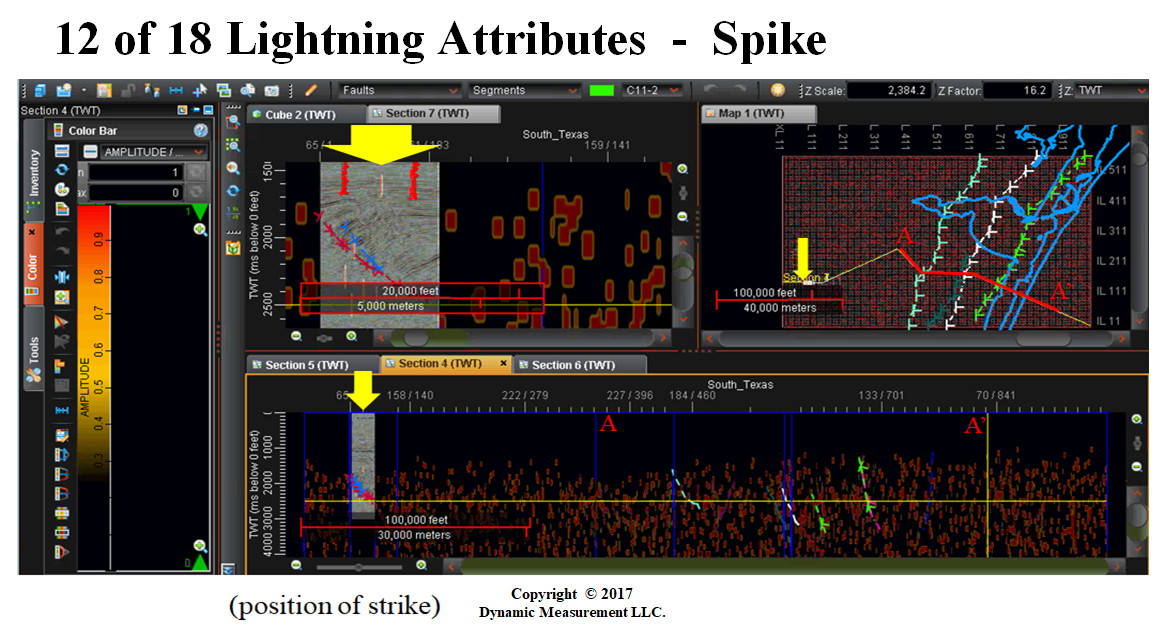
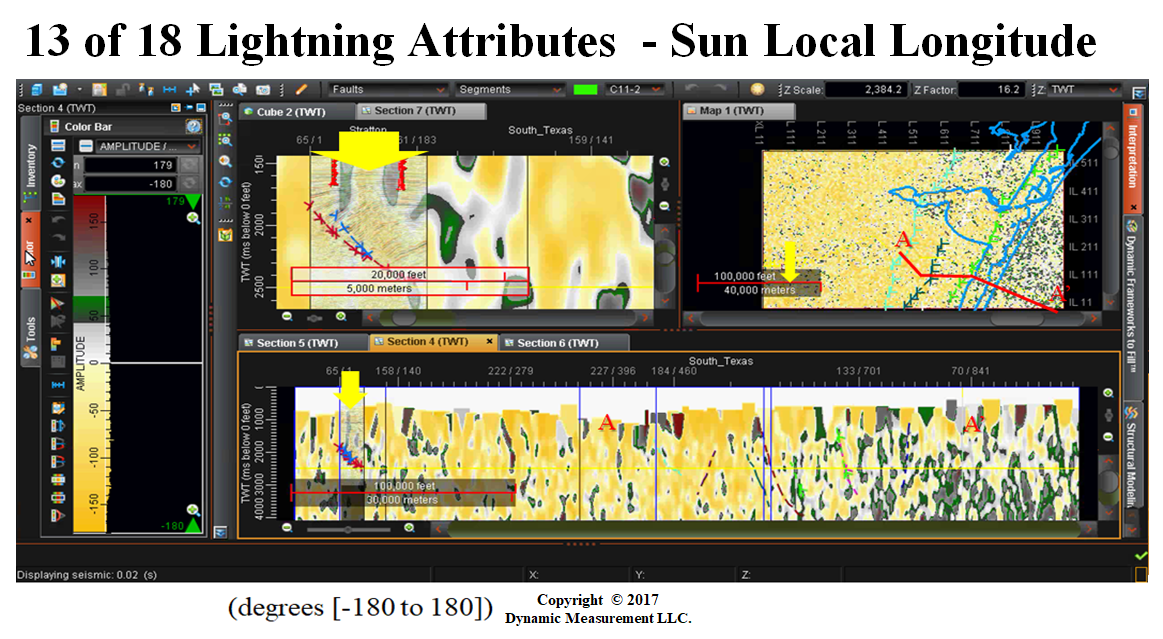
| Attribute: Lightning Spike | Attribute: Sun Local Longitude |
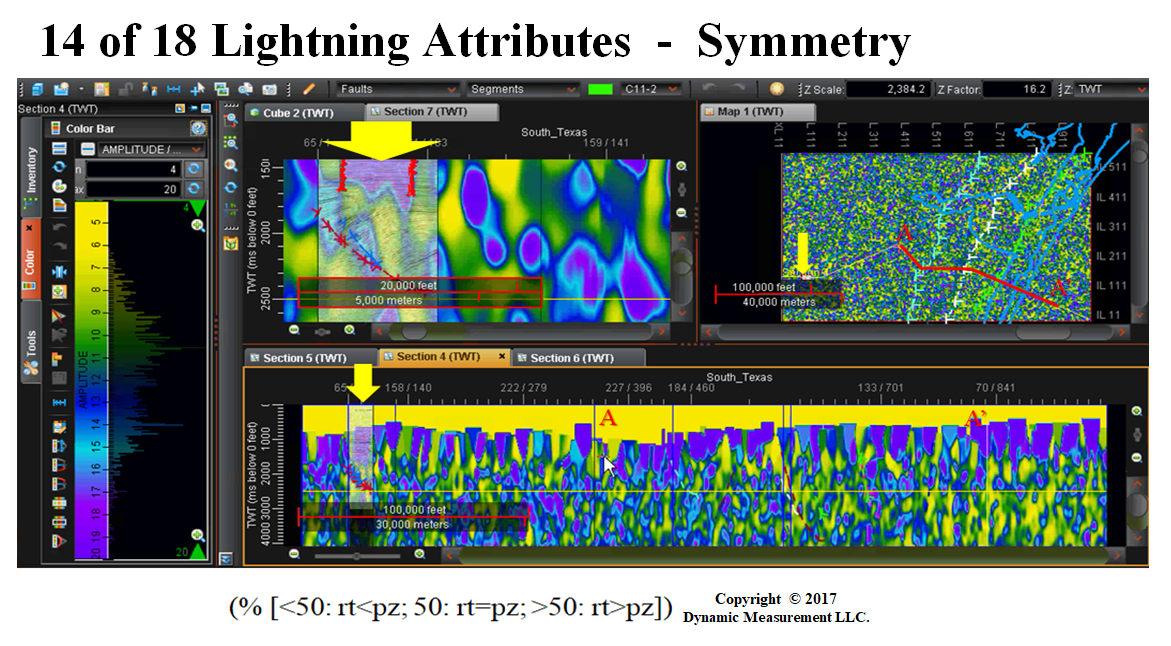
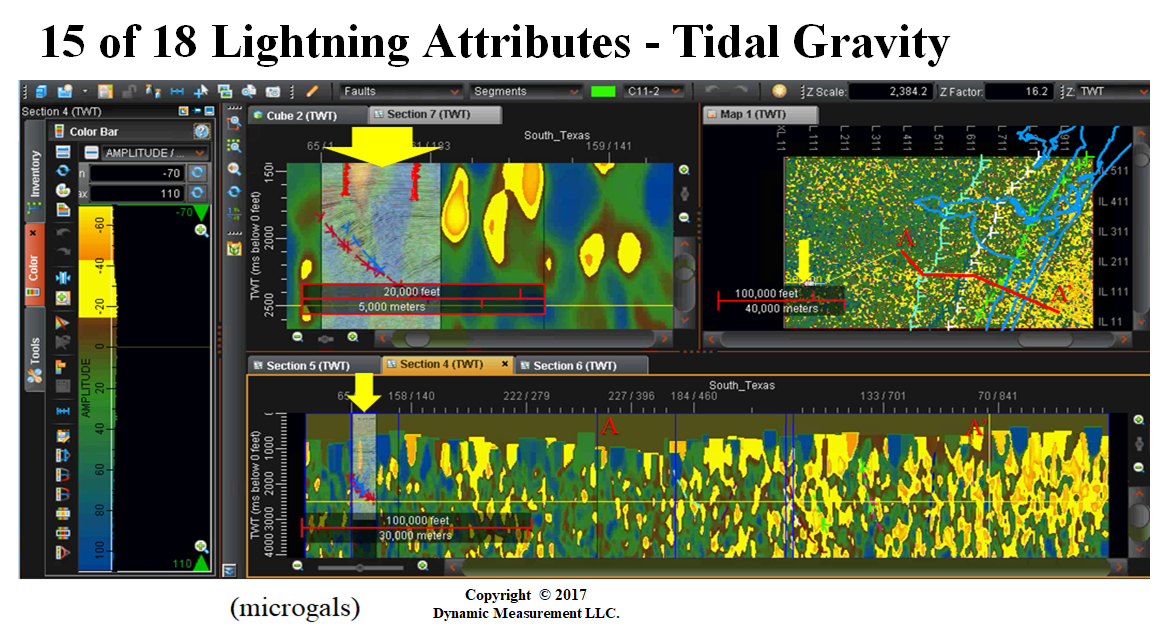
Attribute: Symmetry | Attribute: Tital Gravity |
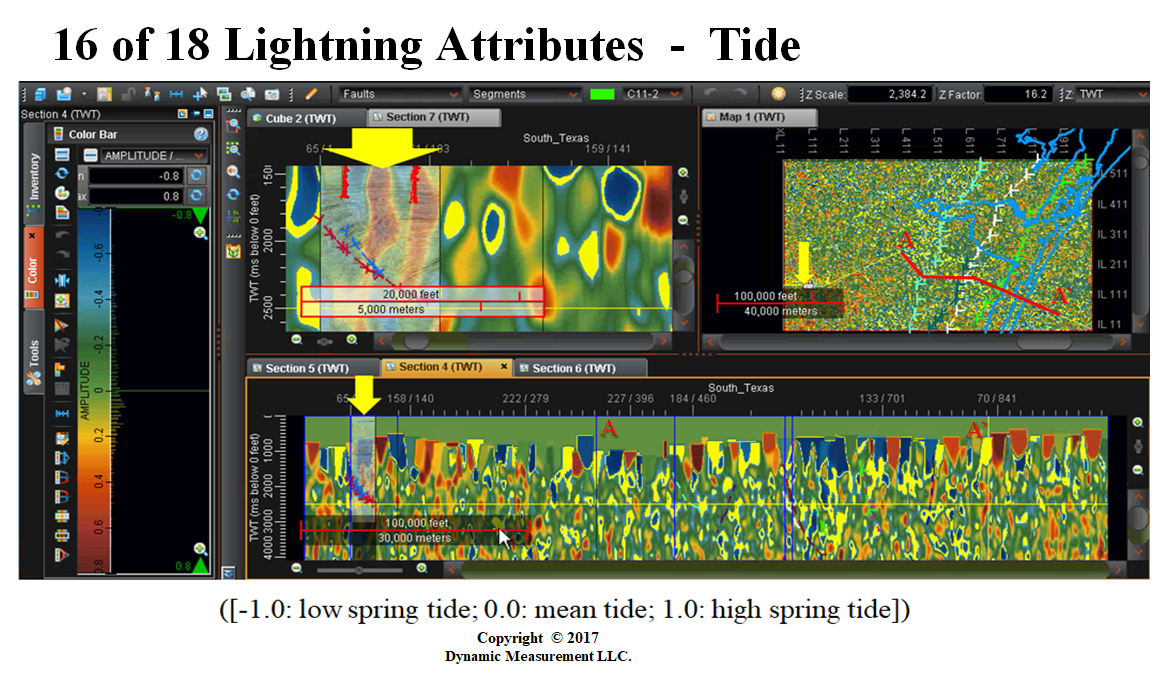
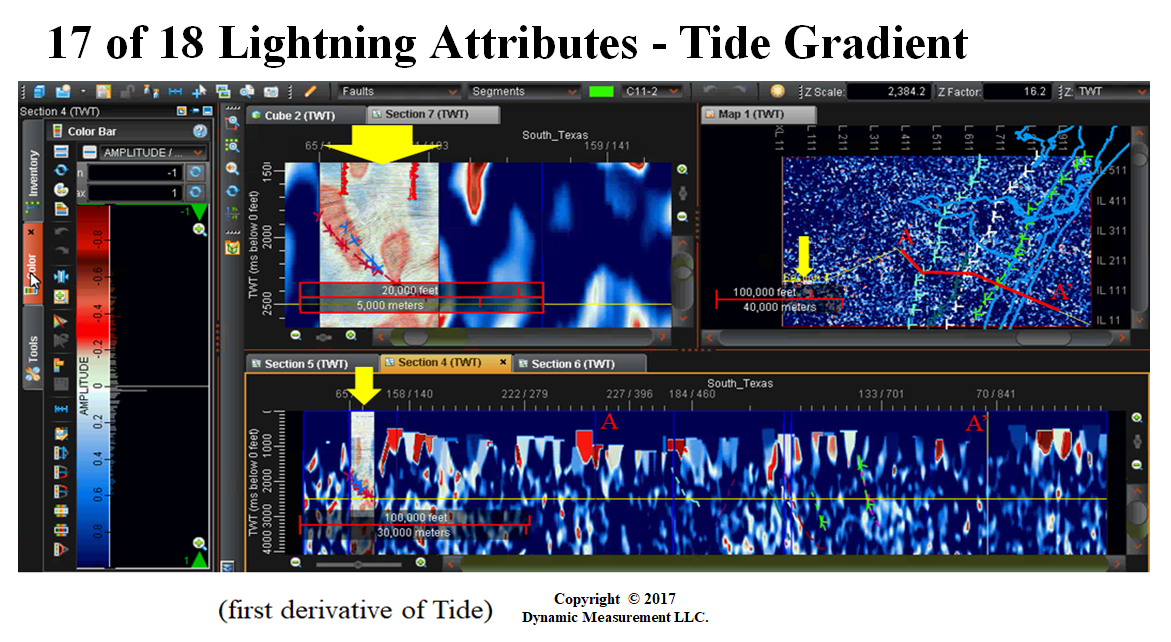
Attribute: Lunar Tide | Attribute: Tidal Gradient |
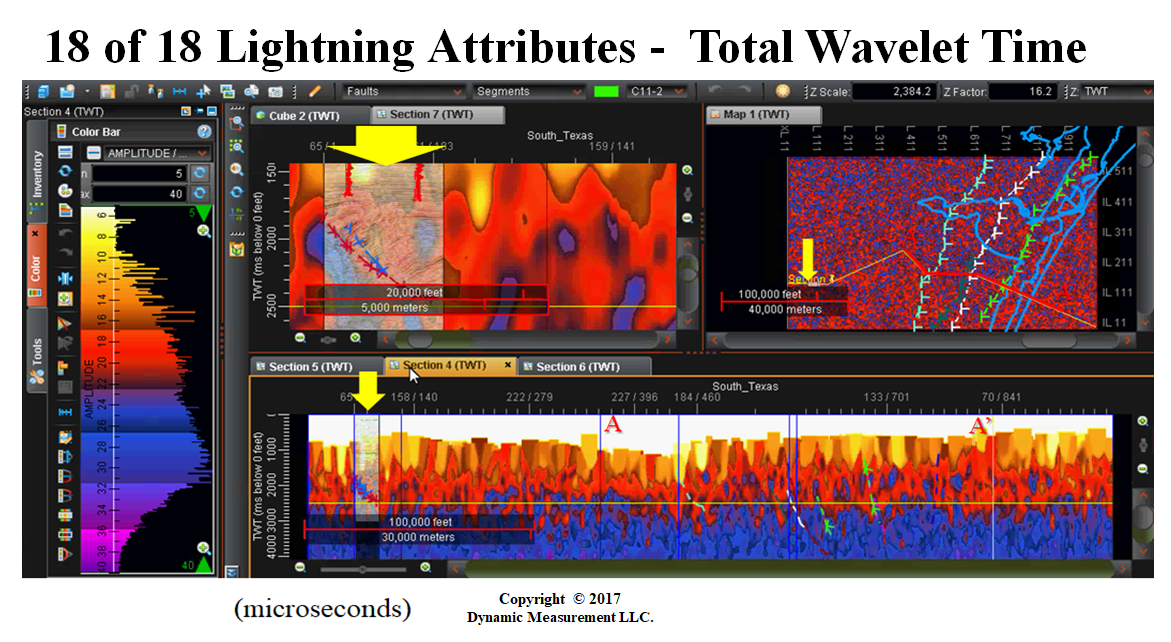
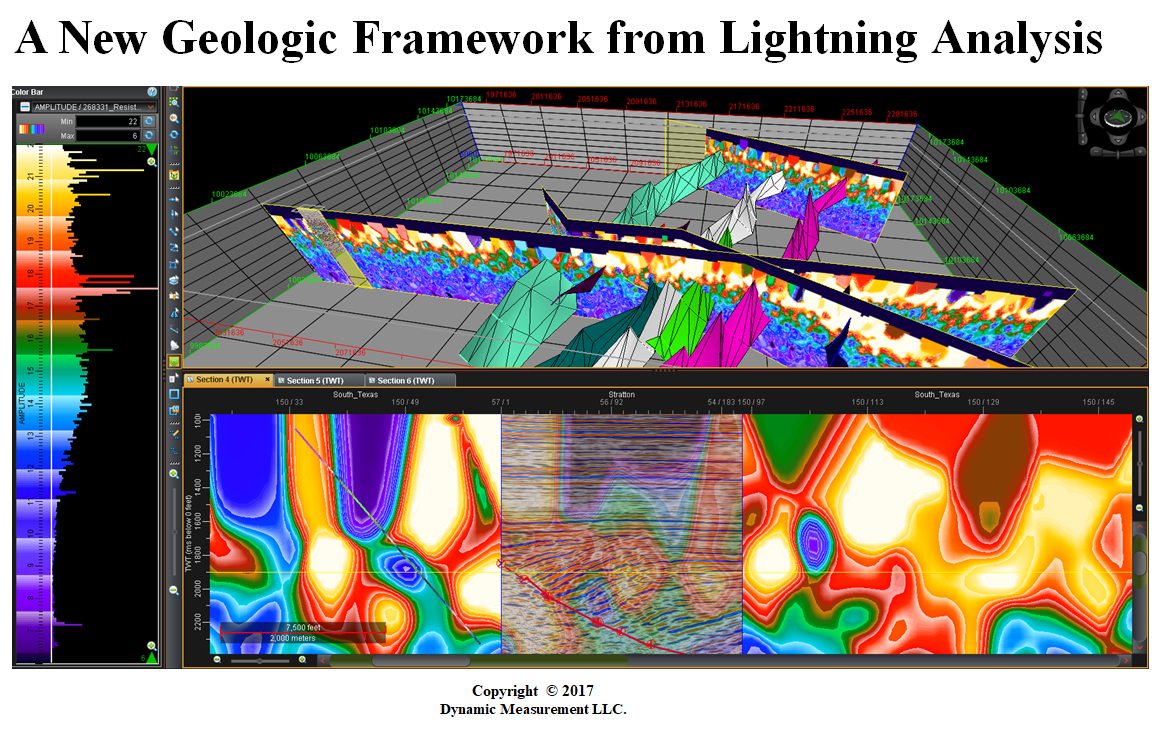
Attribute: Total Wavelet Time | Geologic Framework |
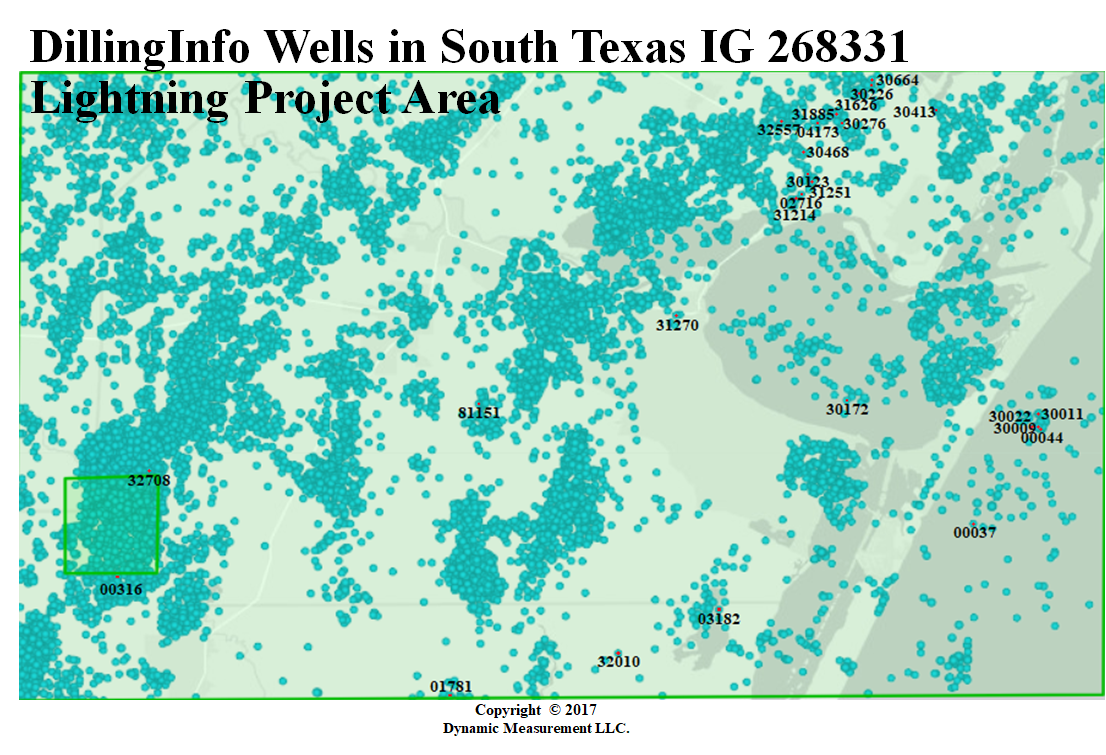
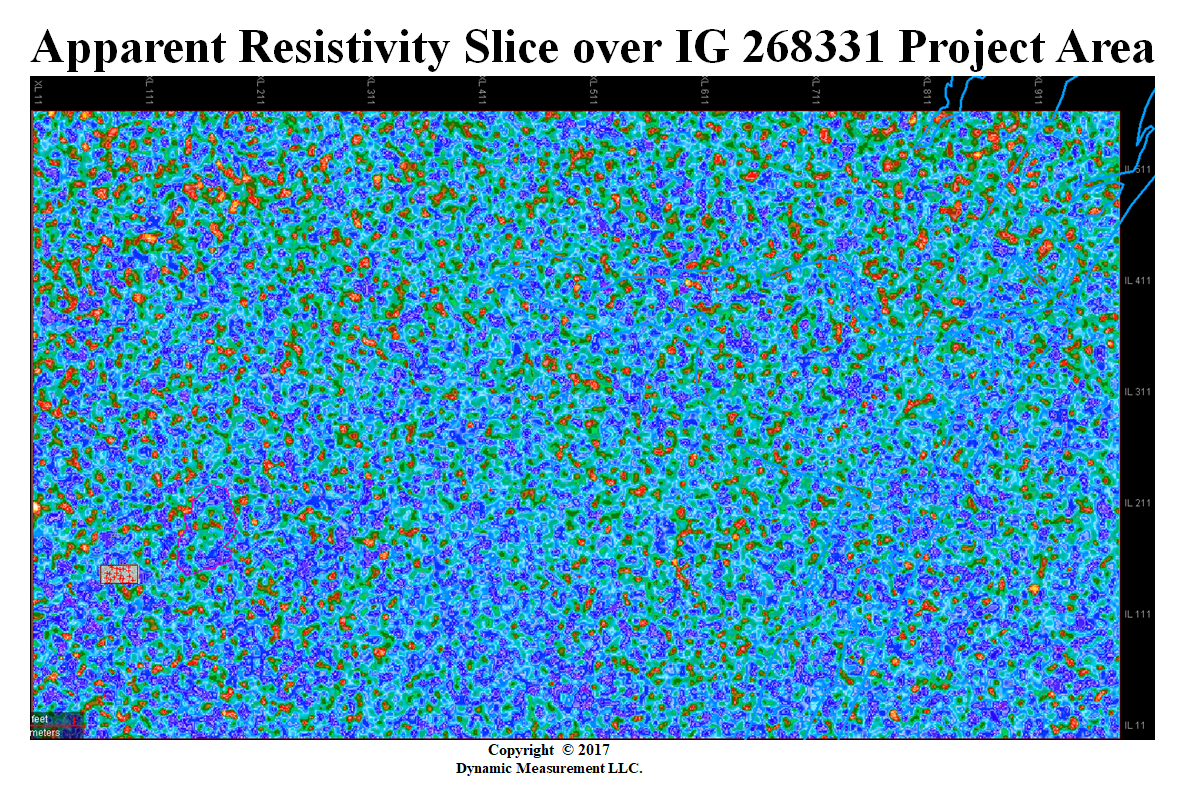
DrillingInfo Wells IG 268331 | Resistivity Slice IG 268331 |
 |  |
 |  |
 |  |
 |  |
 |  |
| DI Wells and Resistivity | Log X-Sections A-A'-E-E' |
Log X-Sections Landmark Grid | A-A' Through Stratton Field |
A-A' Logs Overlain | A-A' Logs Inserted |
B-B' Logs Overlain | B-B' Logs Inserted |
C-C' Logs Overlain on Cross-Section | C-C' Logs Inserted |
 |  |
 |  |
 |  |
| |
|  |
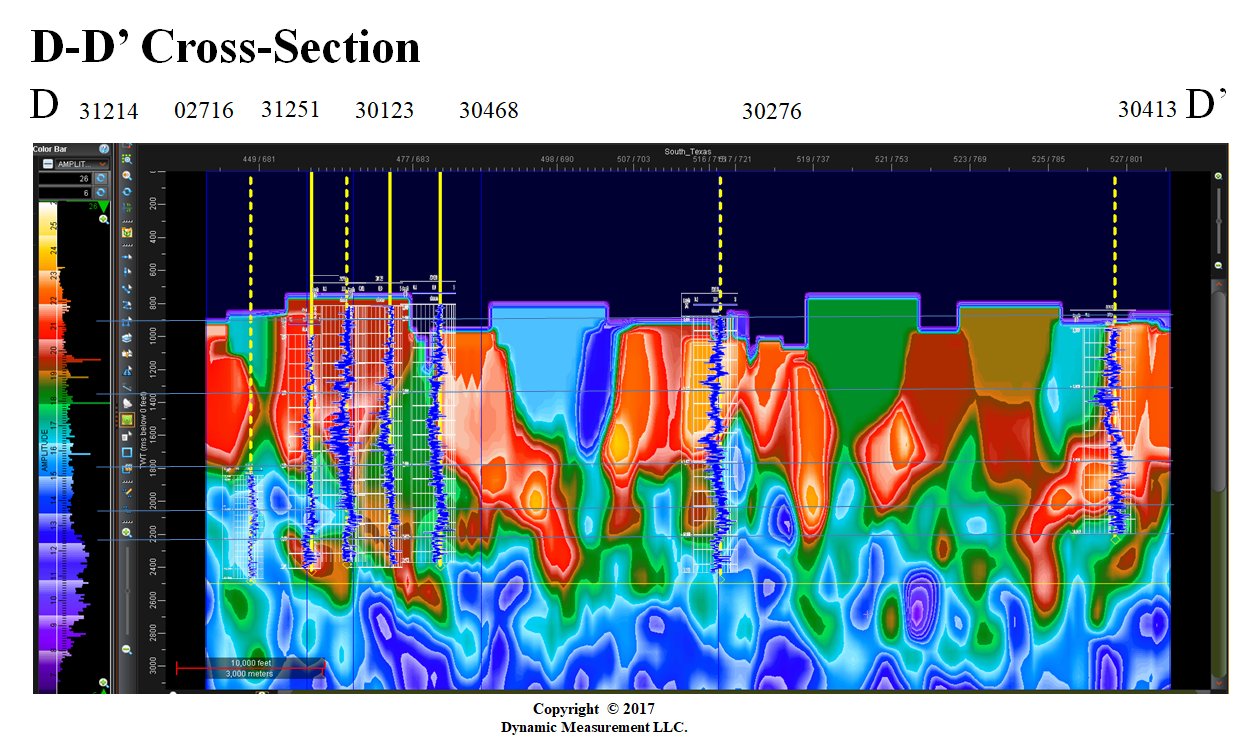
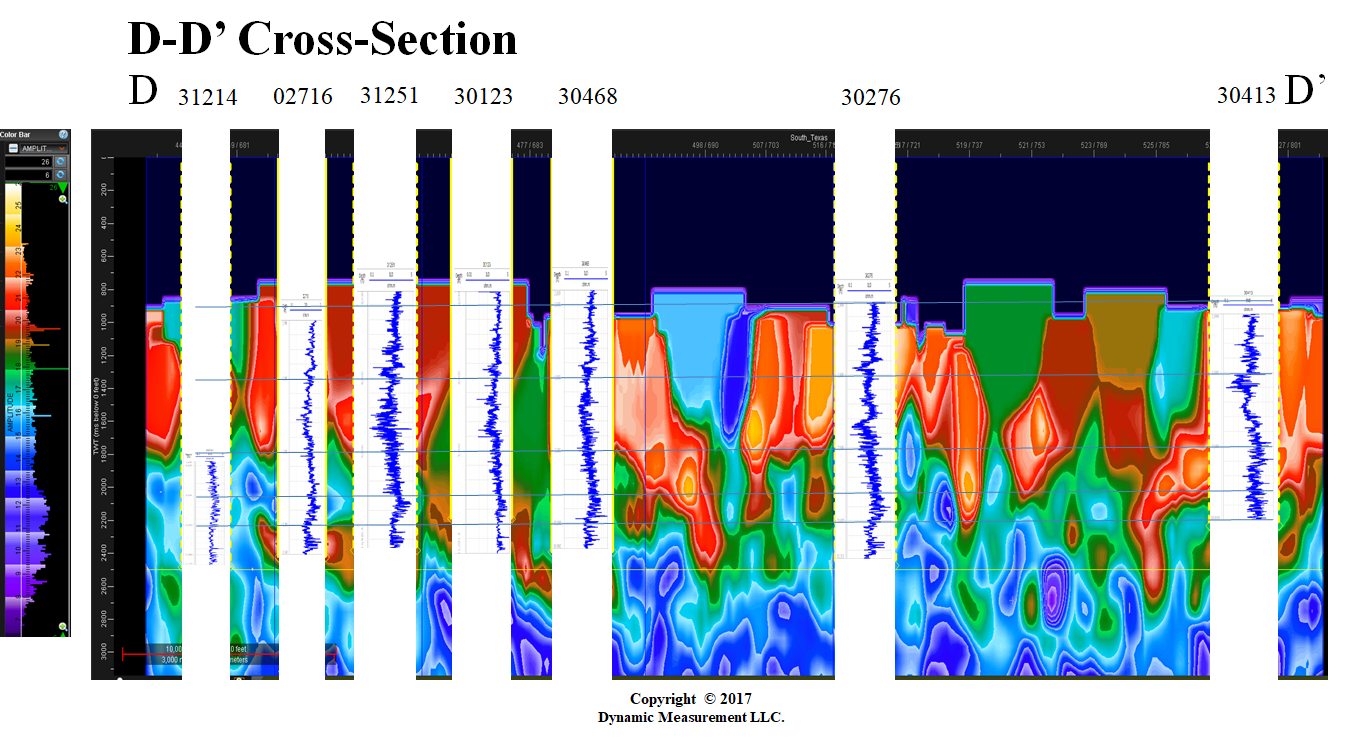
| D-D' Logs Overlain | D-D' Logs Inserted |
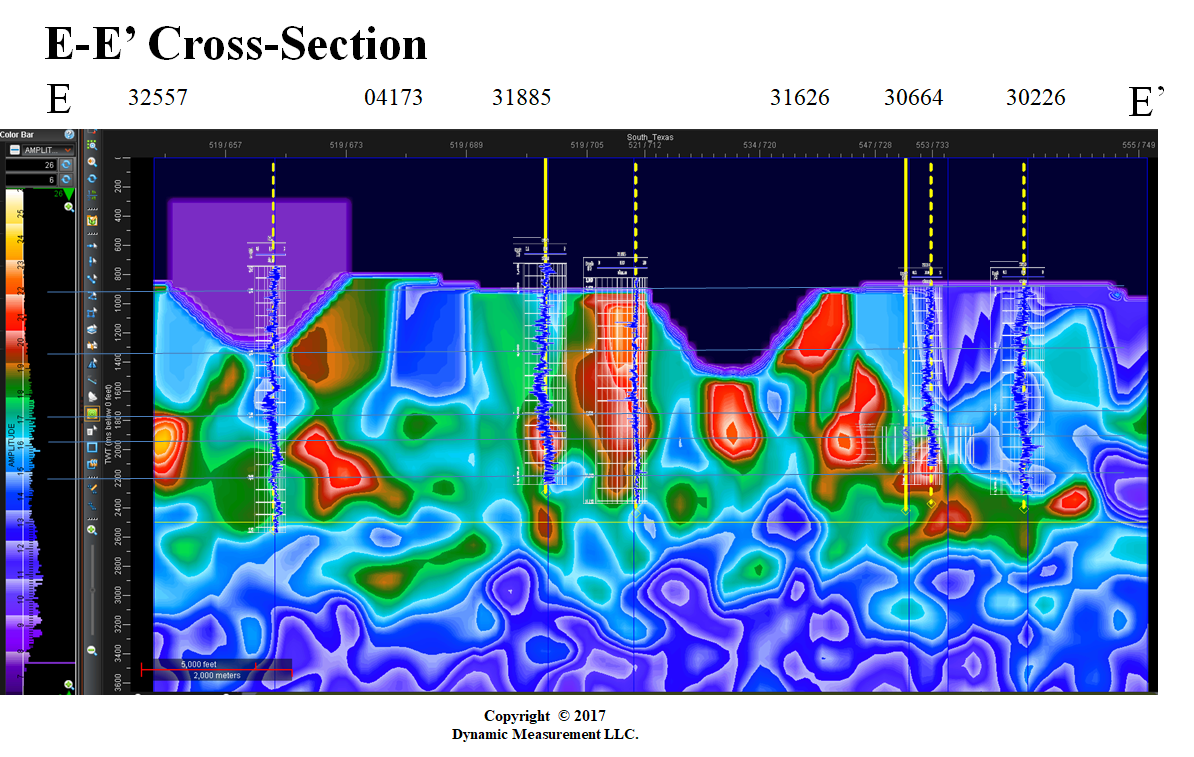
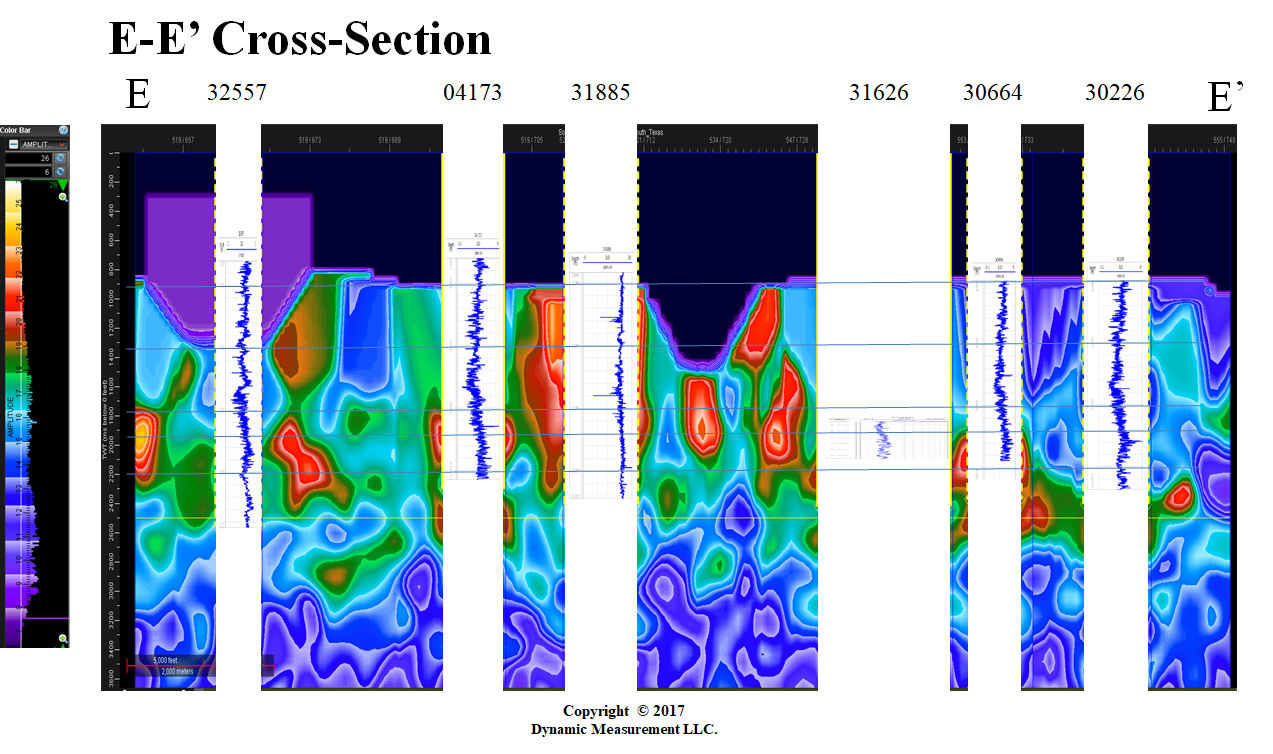
E-E' Logs Overlain | E-E' Logs Inserted in Cross-Section |
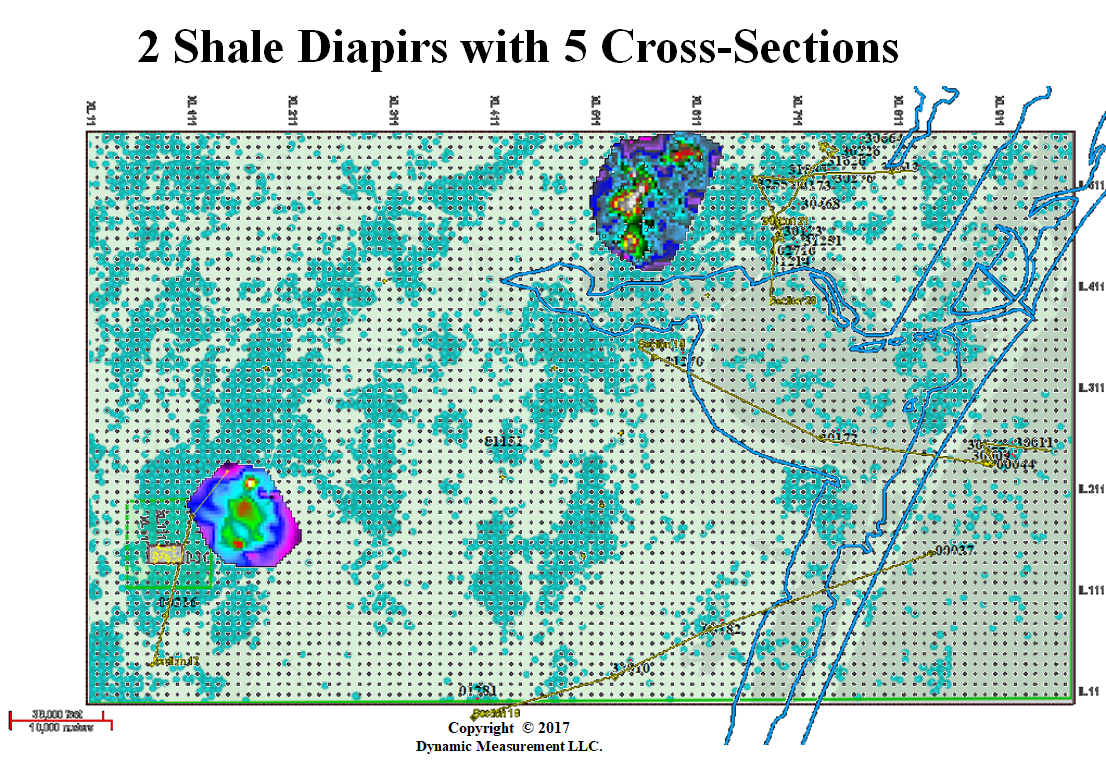
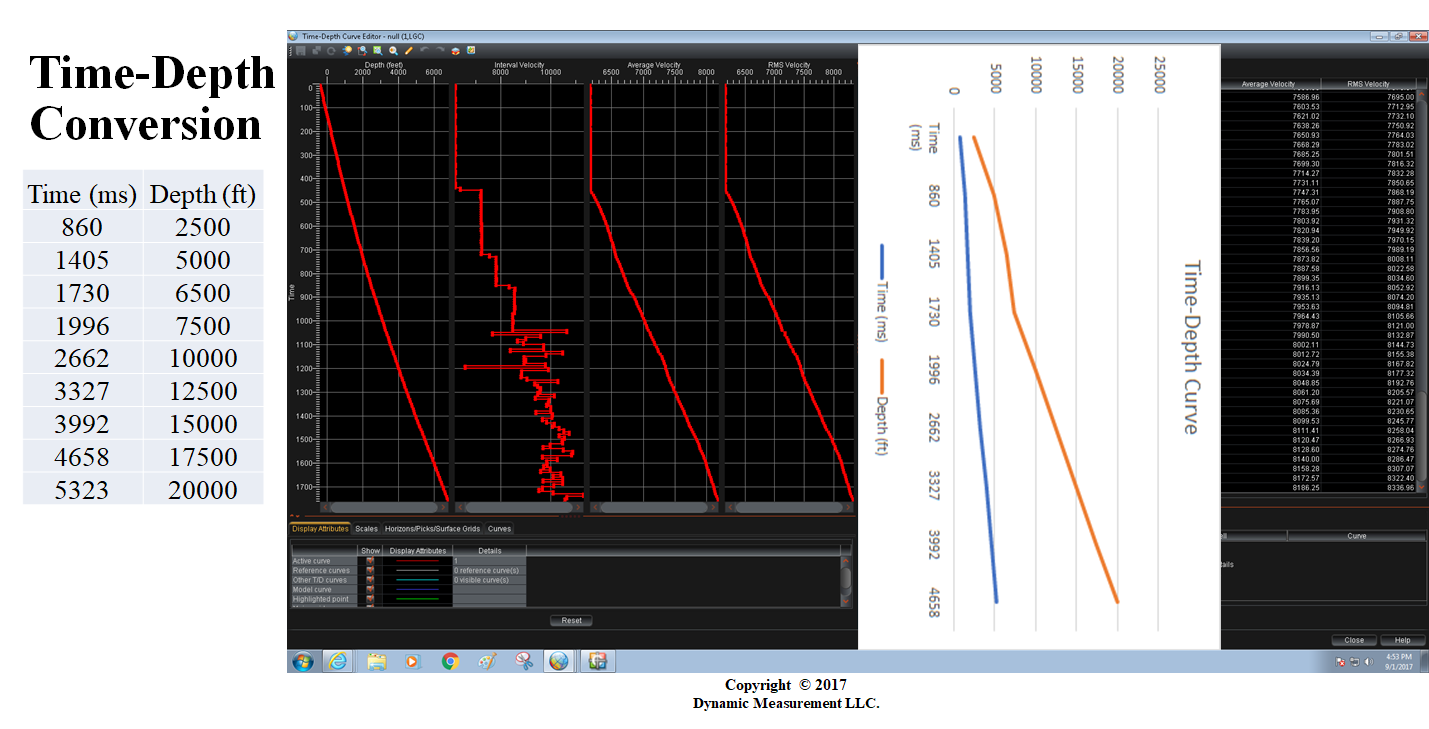
2 Lightning Shale Diapirs | Notes on Time-Depth Analysis |
| |
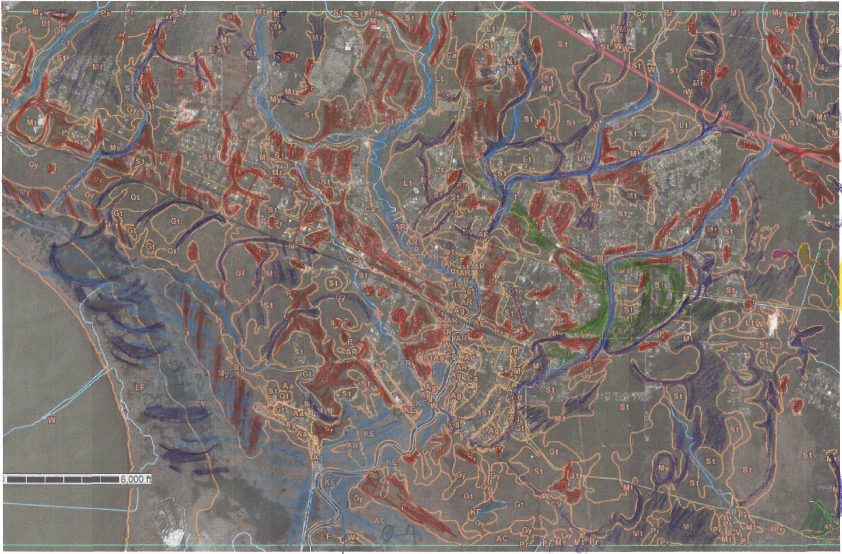
| Background Image |
 |  |
 |  |
 |  |
 |  |
 |  |
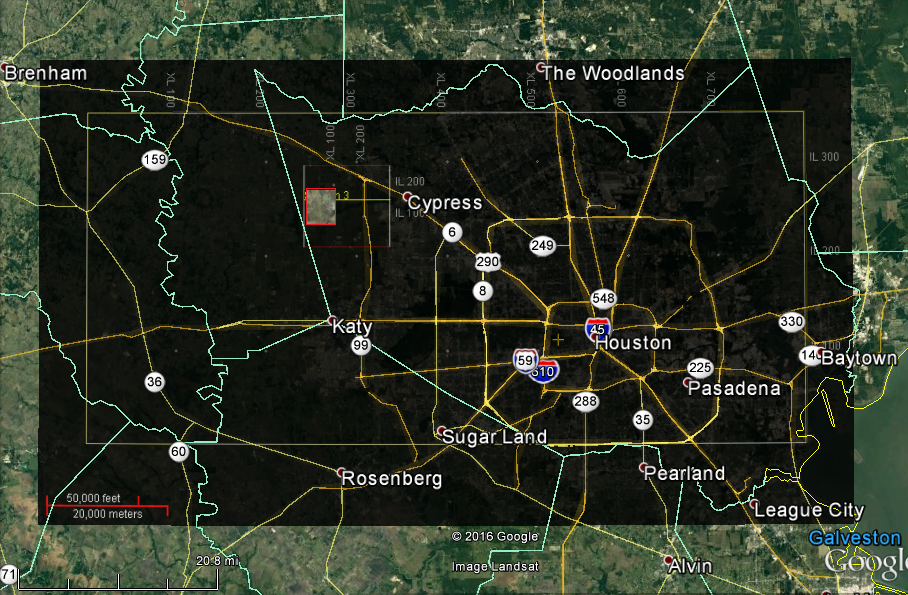
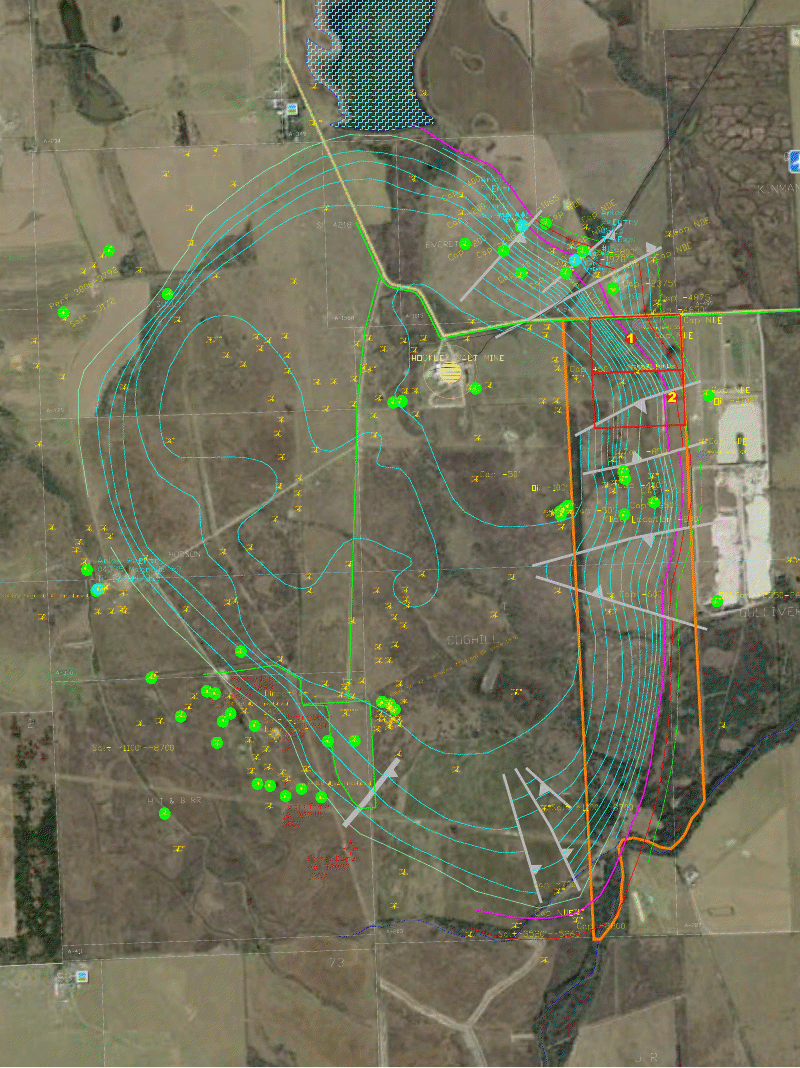
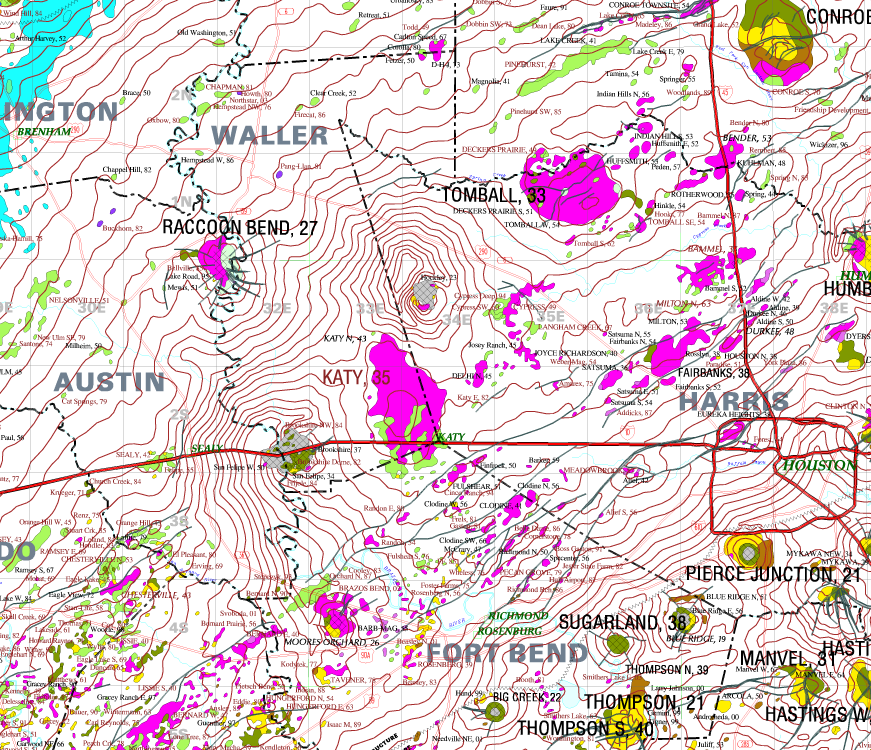
| Hockley Location in Houston Area | Hockley Dome Roberts Property |
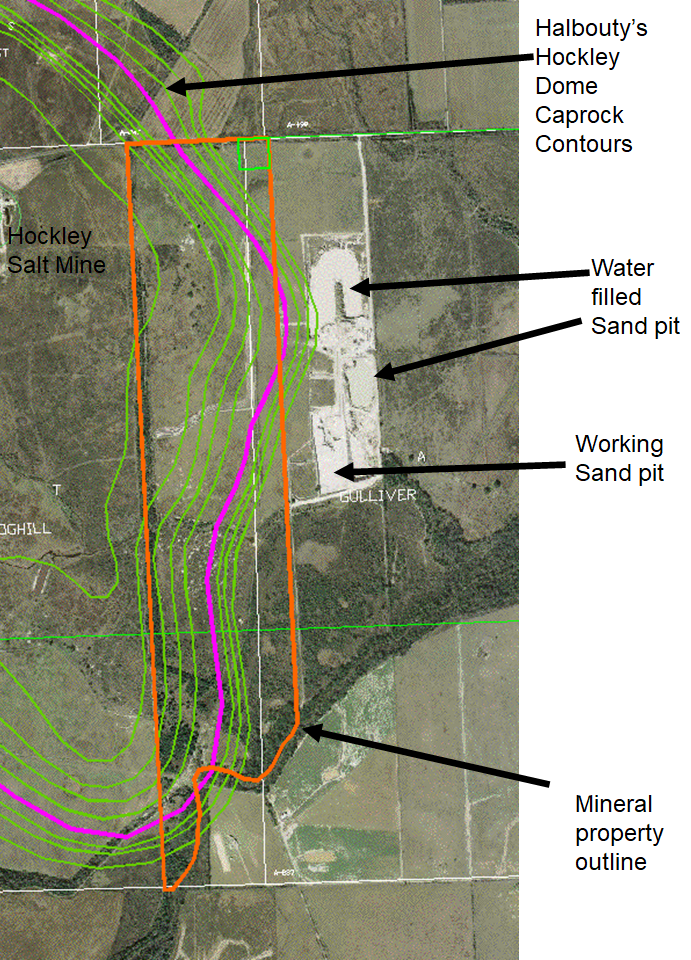
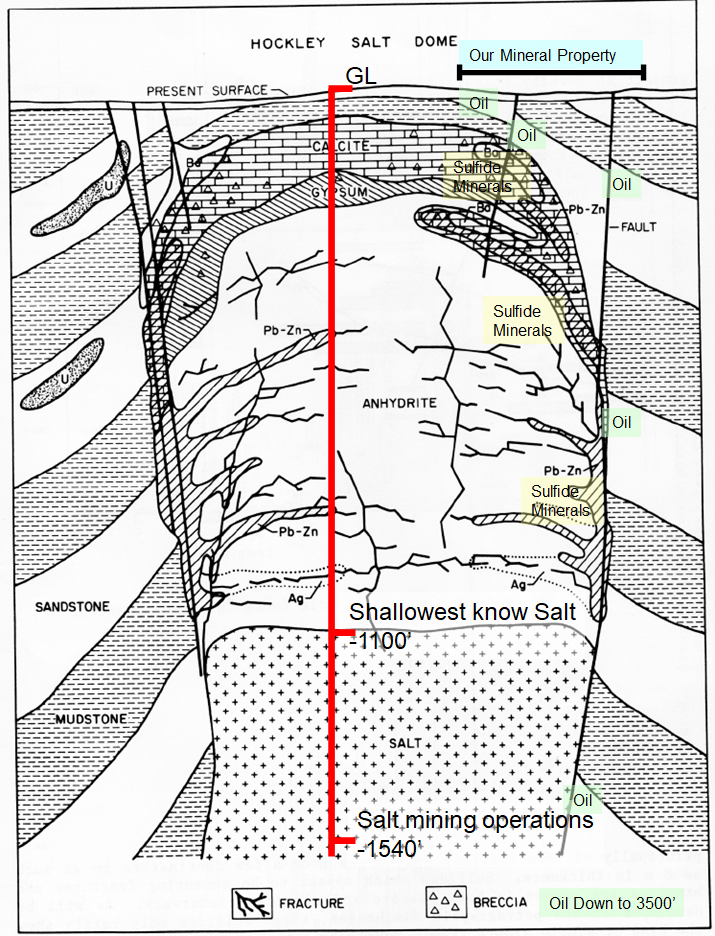
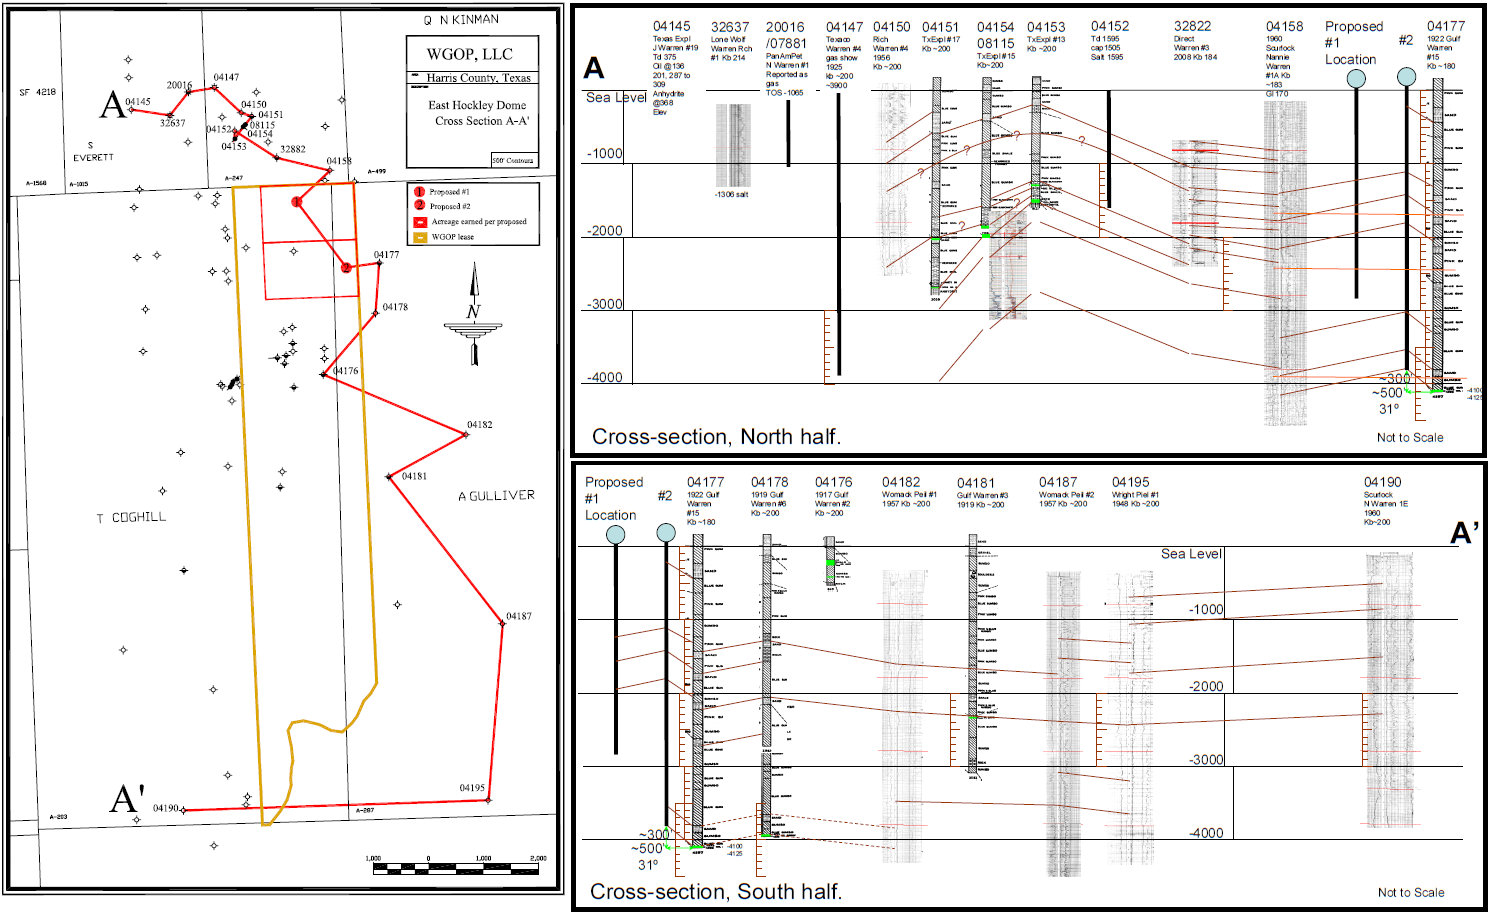
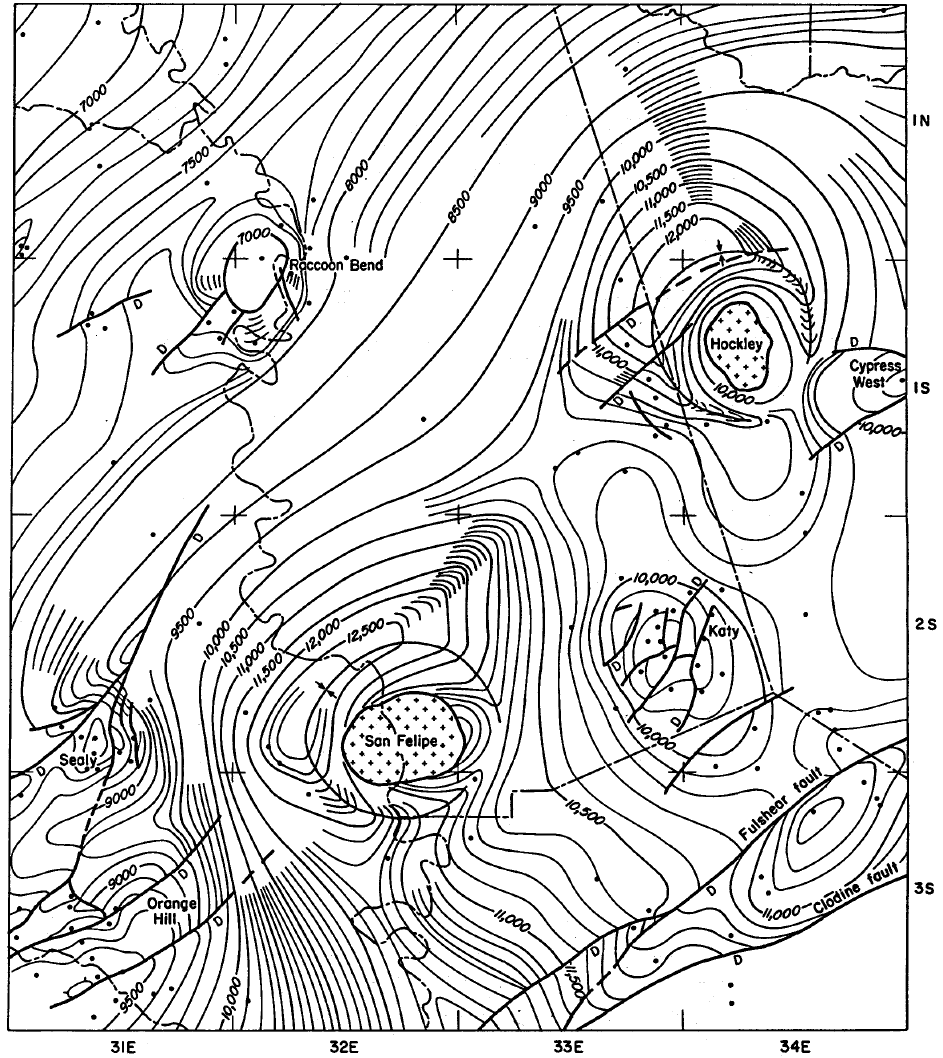
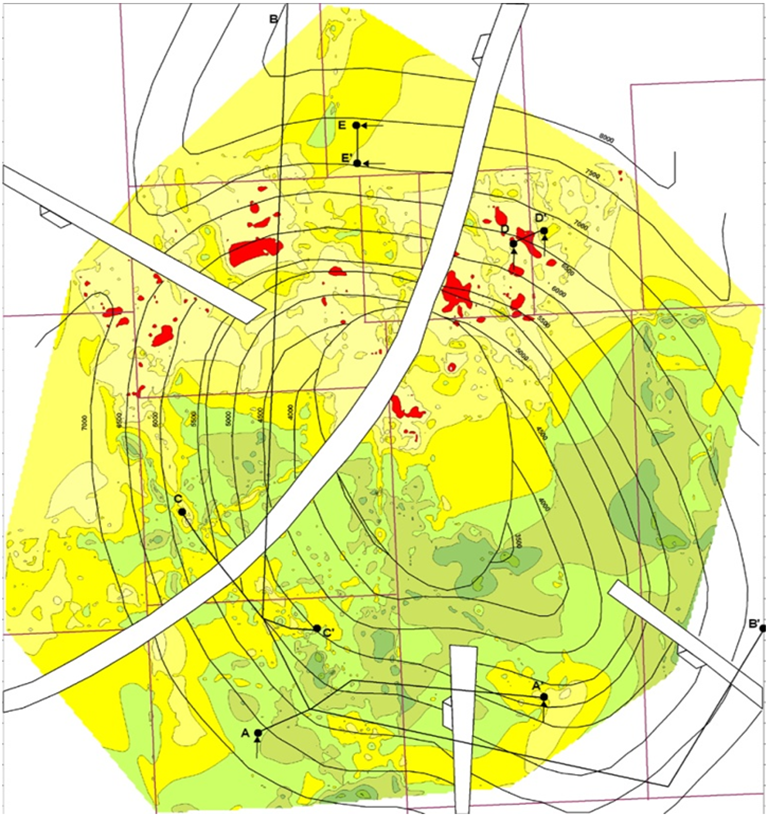
Close-Up Joe Roberts Property | Cross-Section Hockley Dome |
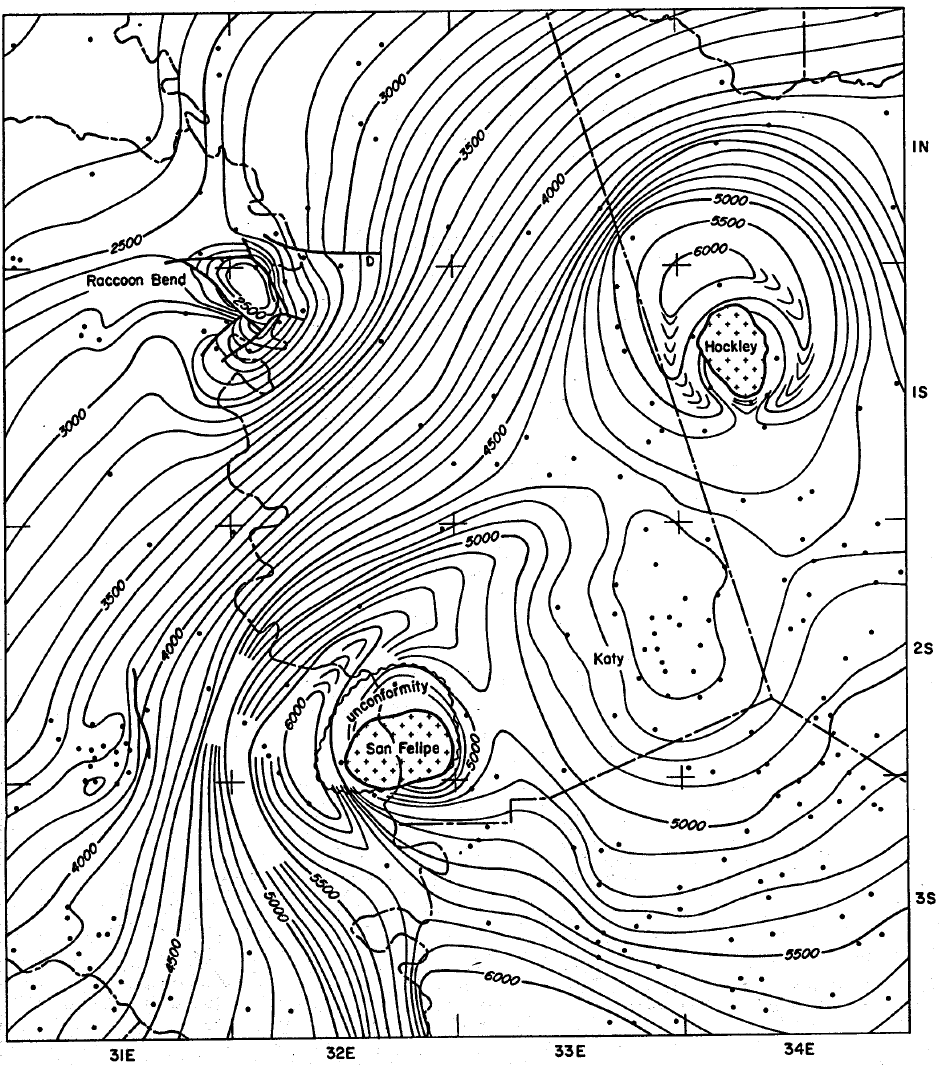
Log Cross-Section Roberts Property | GeoMap Hockley Dome ~Vicksburg |
Ewing Hockley Vicksburg Map | Ewing Hockley Wilcox Map |
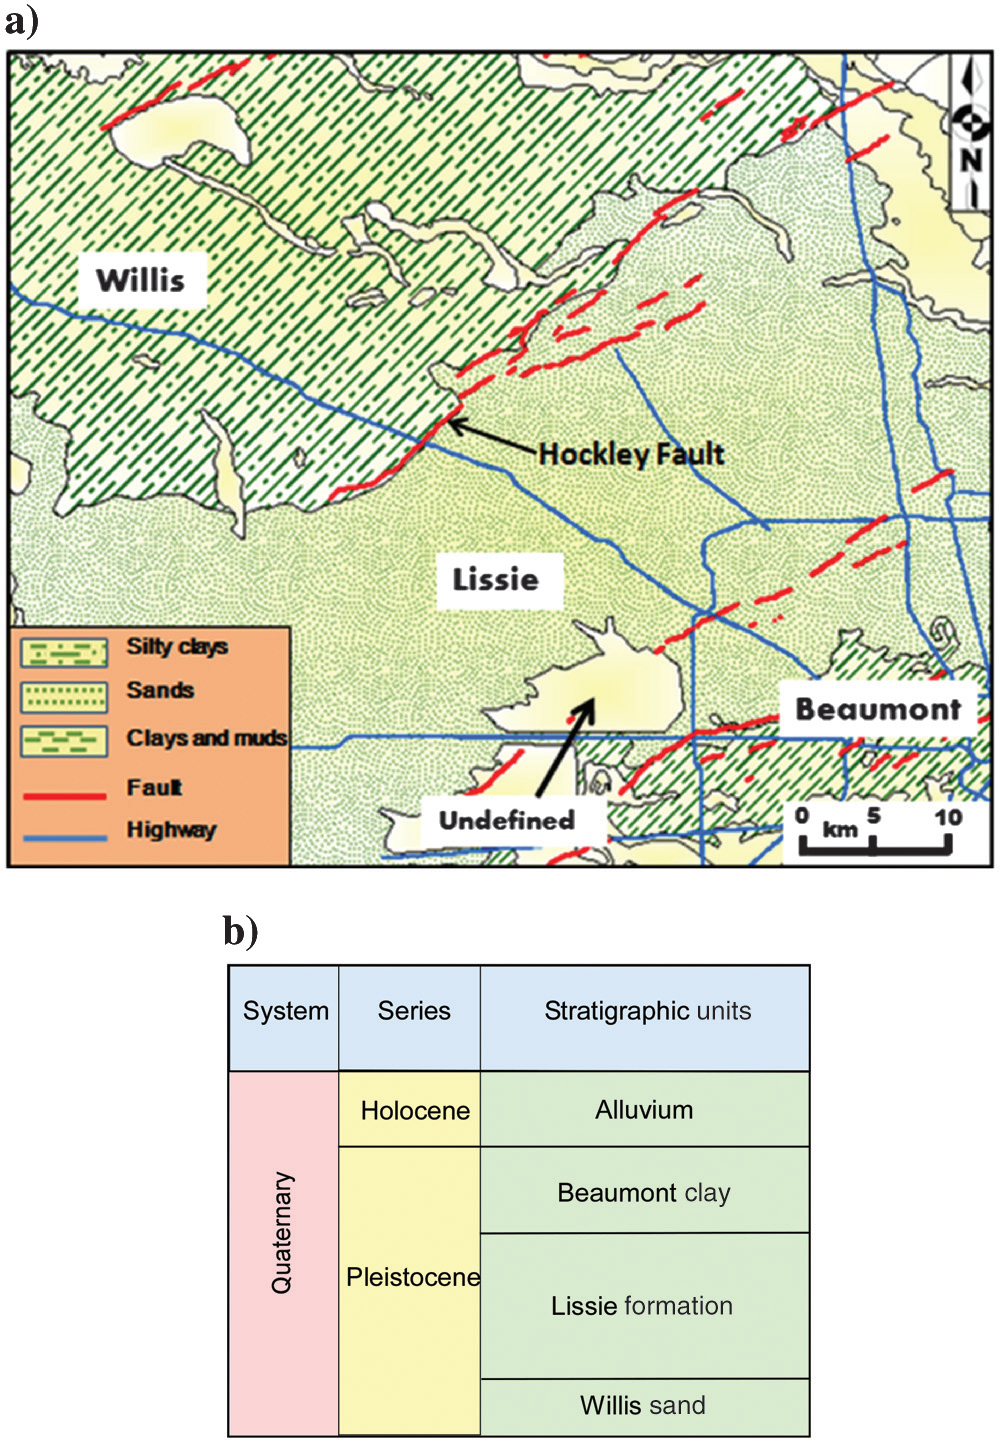
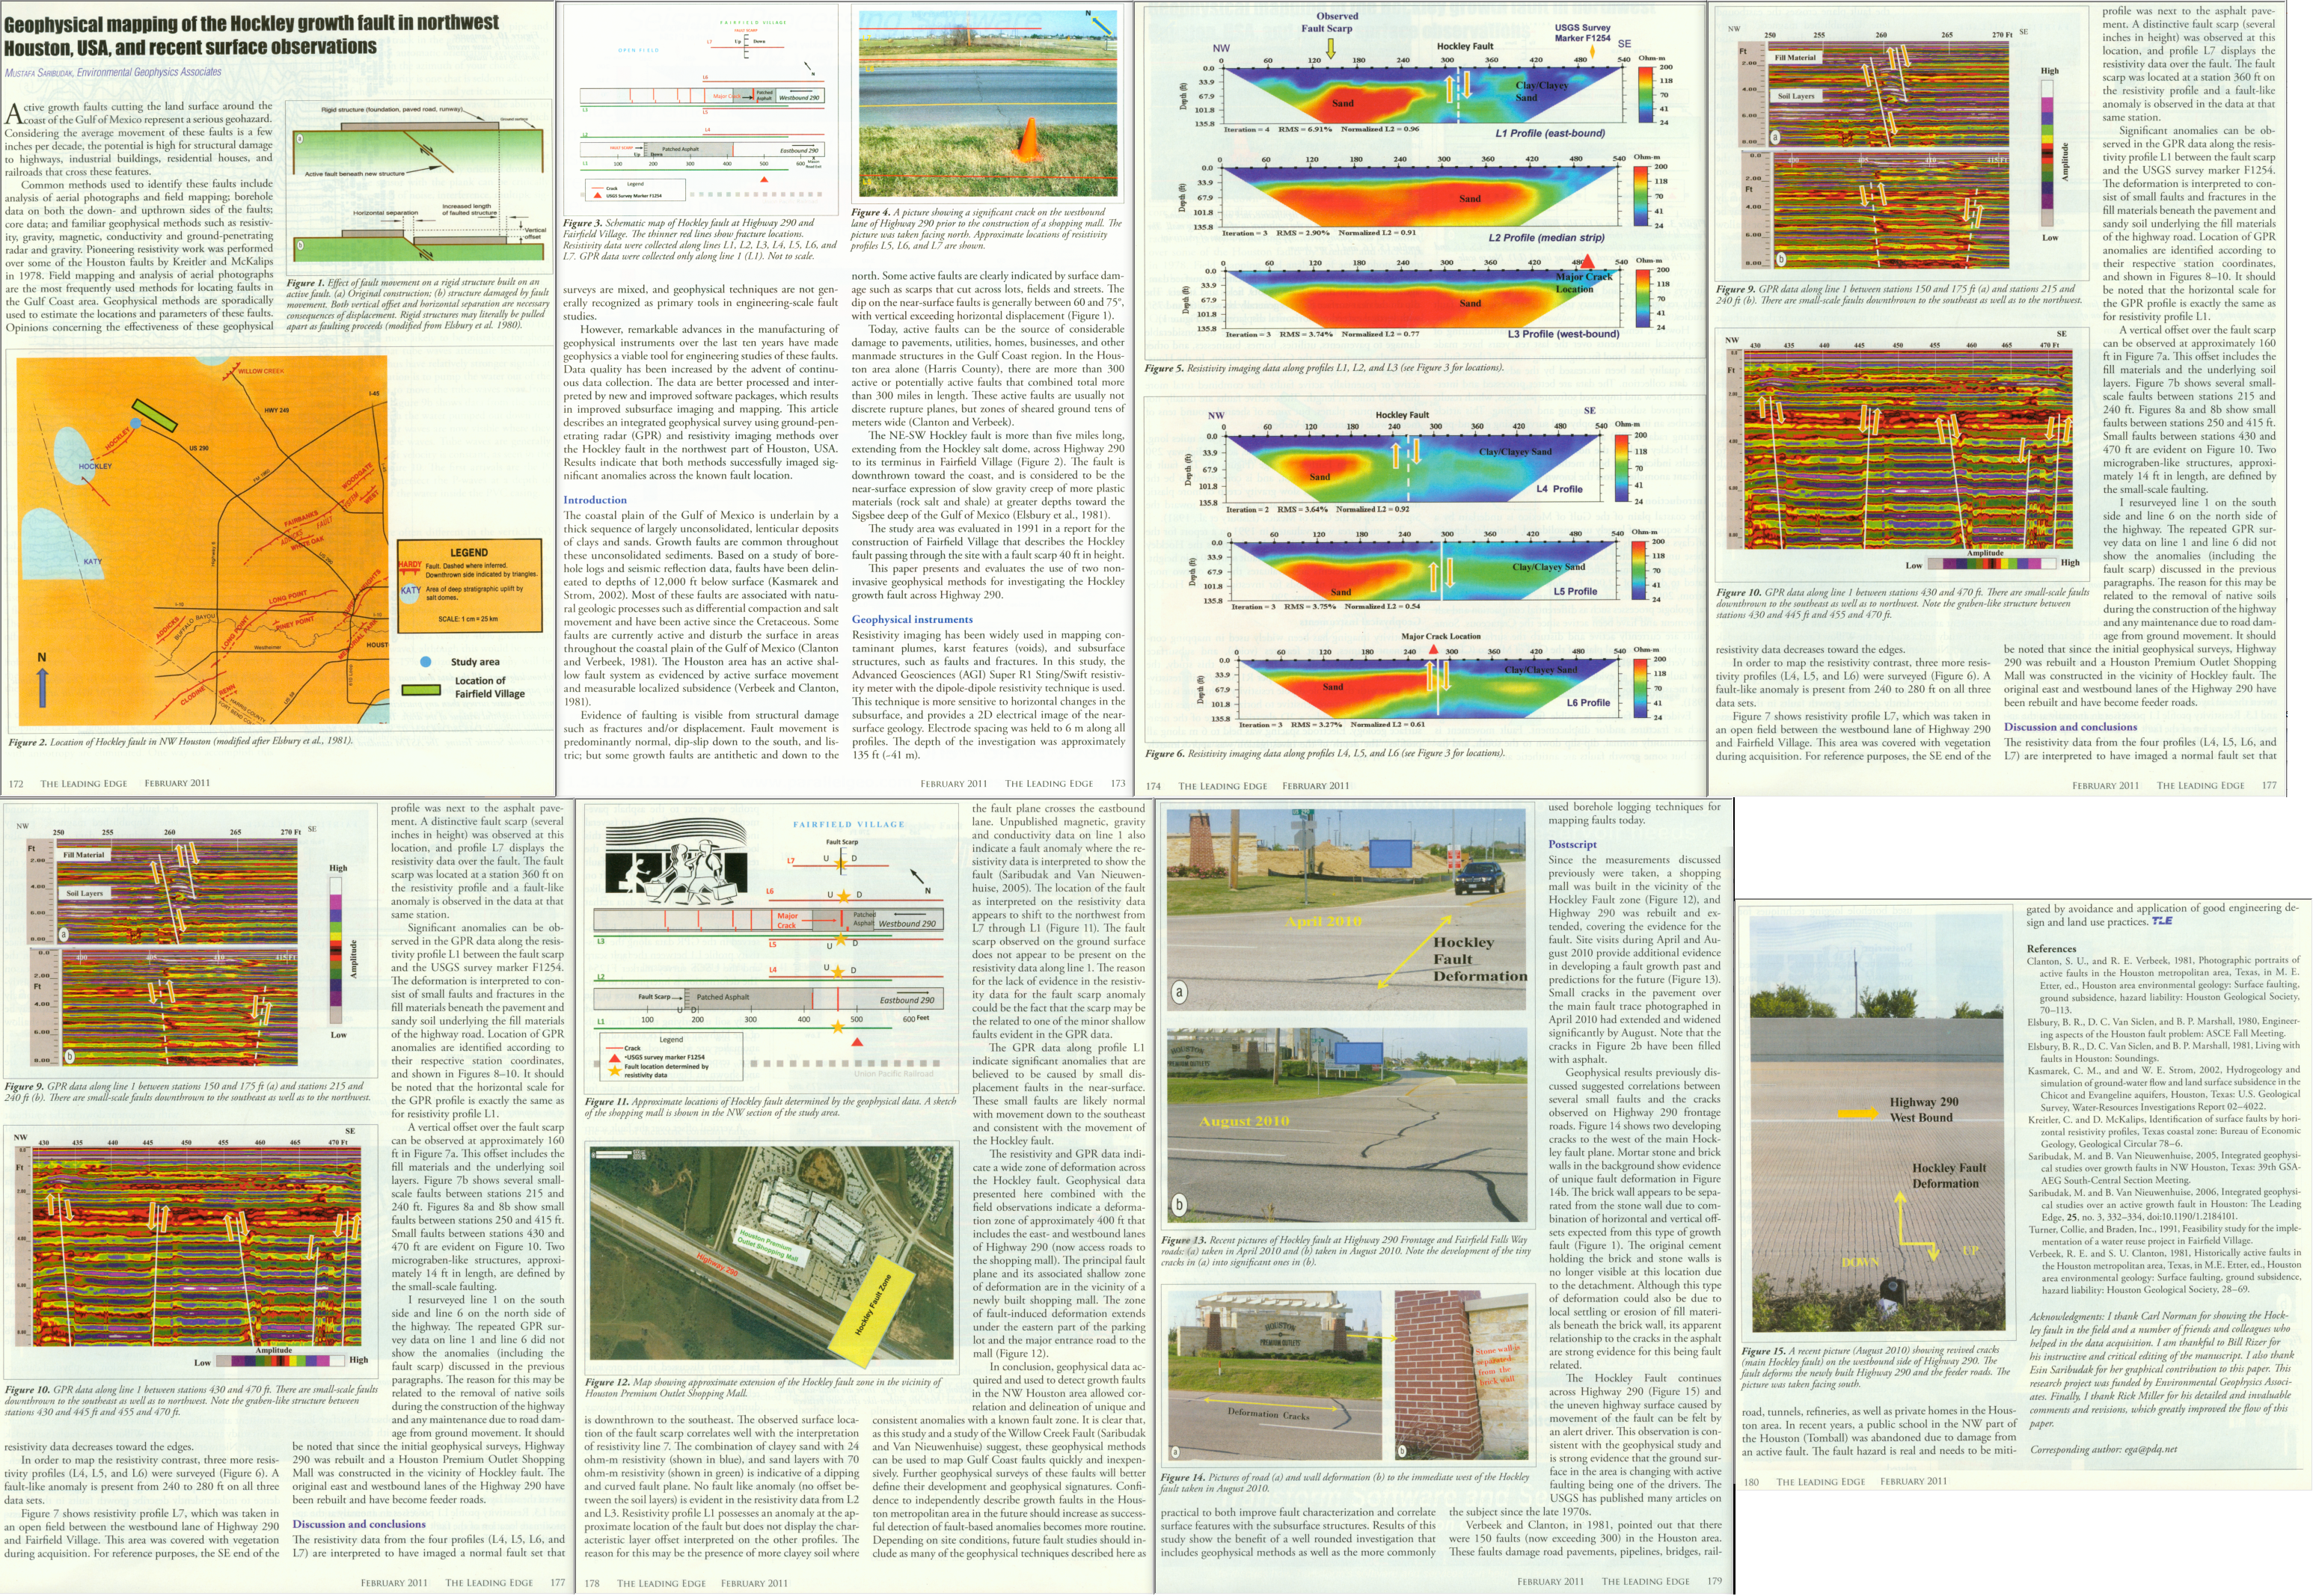
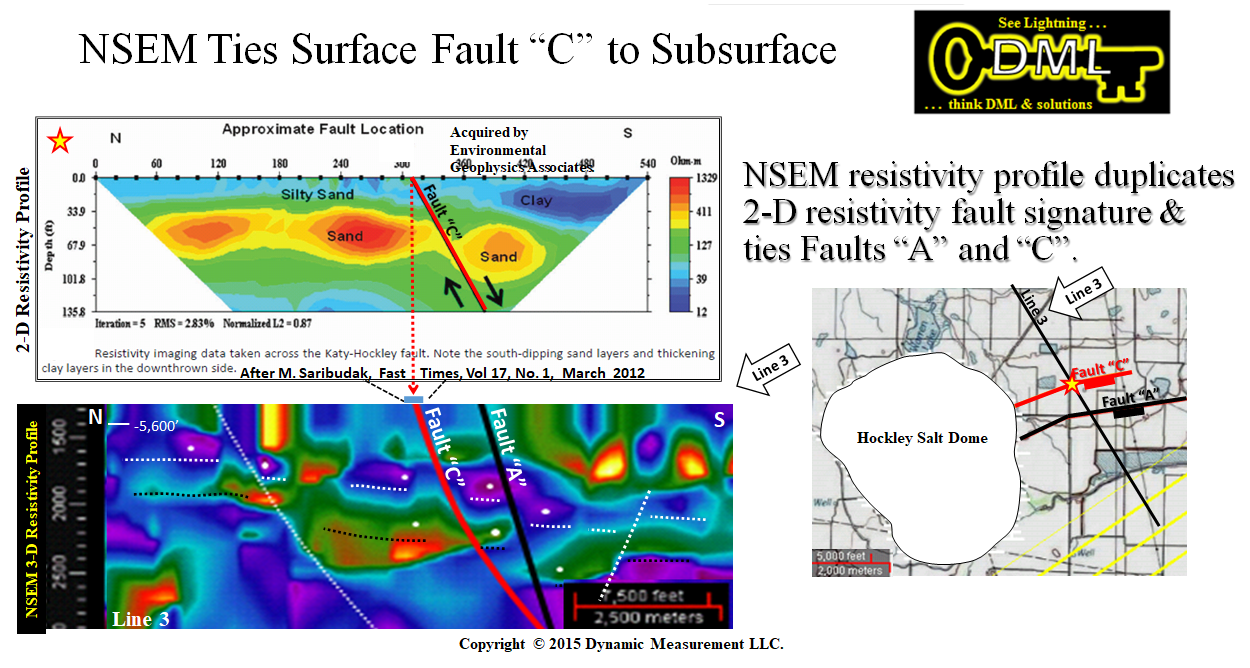
Hockley Fault Strat Units | Saribudak Paper Hockley Fault |
 |  |
 |  |
 |  |
 |  |
 |  |
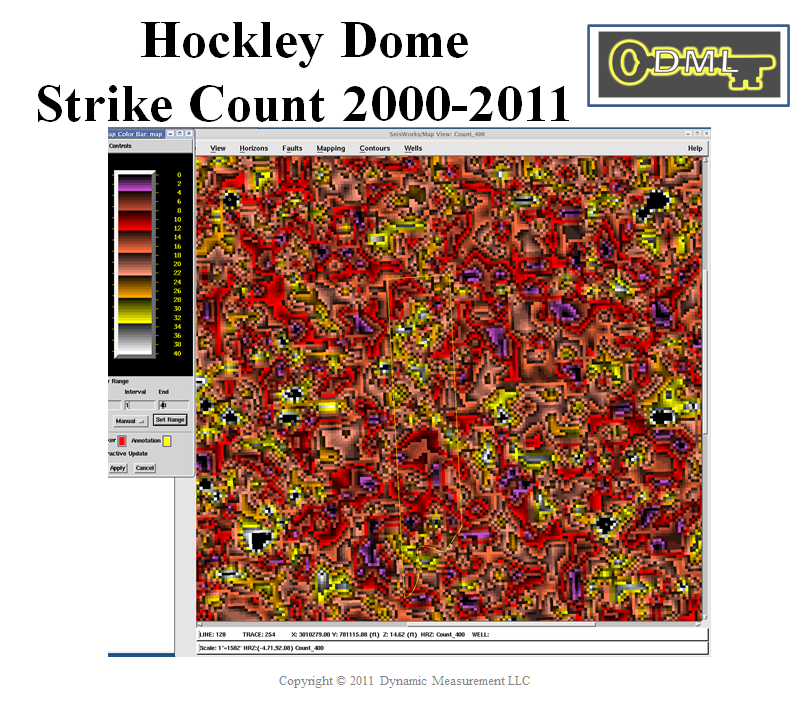
| Radiometric Map Hockley Dome | Hockley 2000-2011 Strike Count |
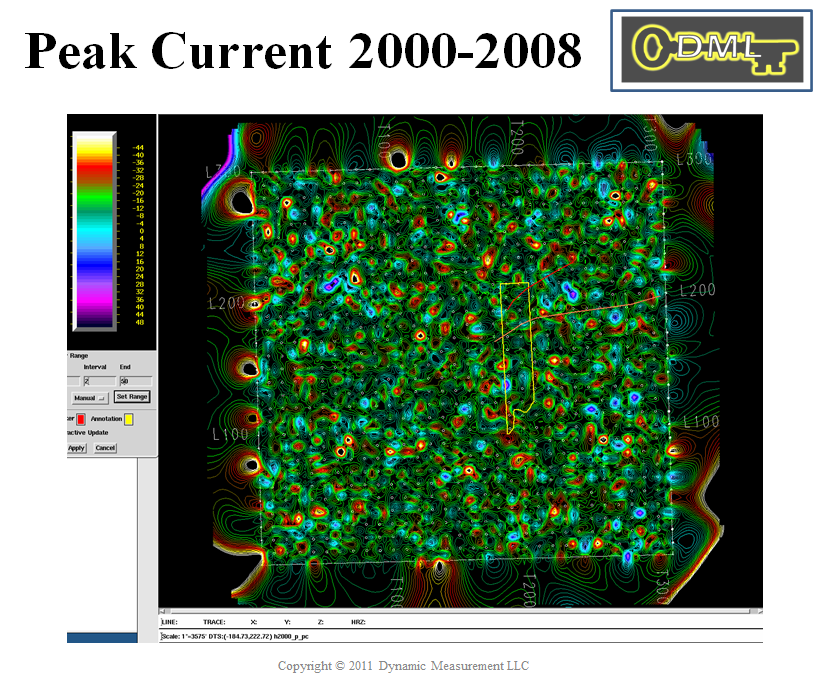
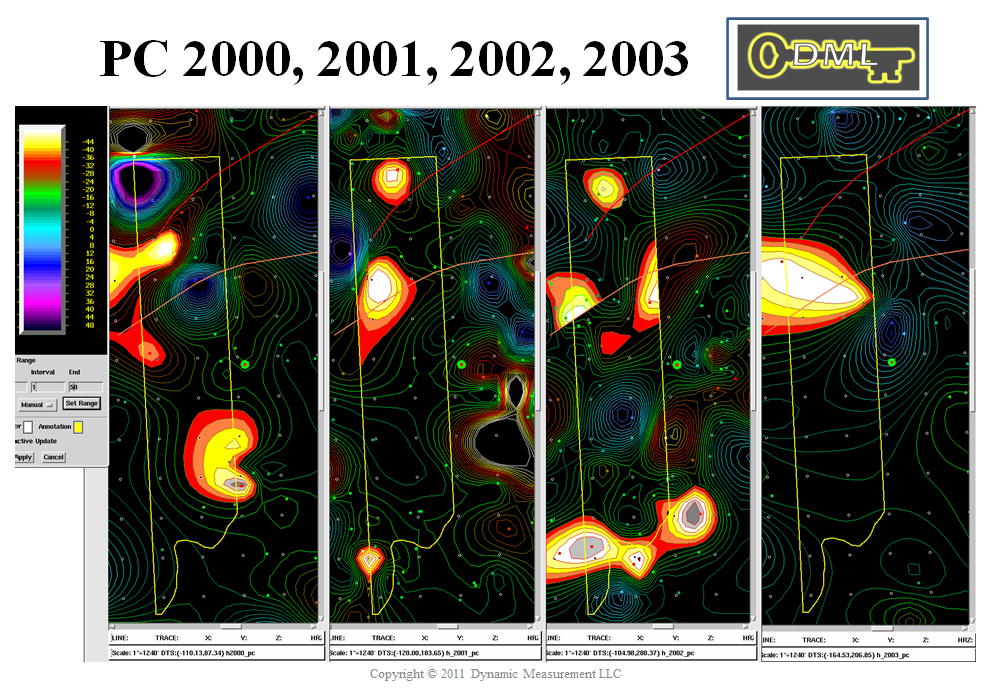
Hockley 2000-2008 Peak Current | 2000, 2001, 2002, 2003 Peak Current |
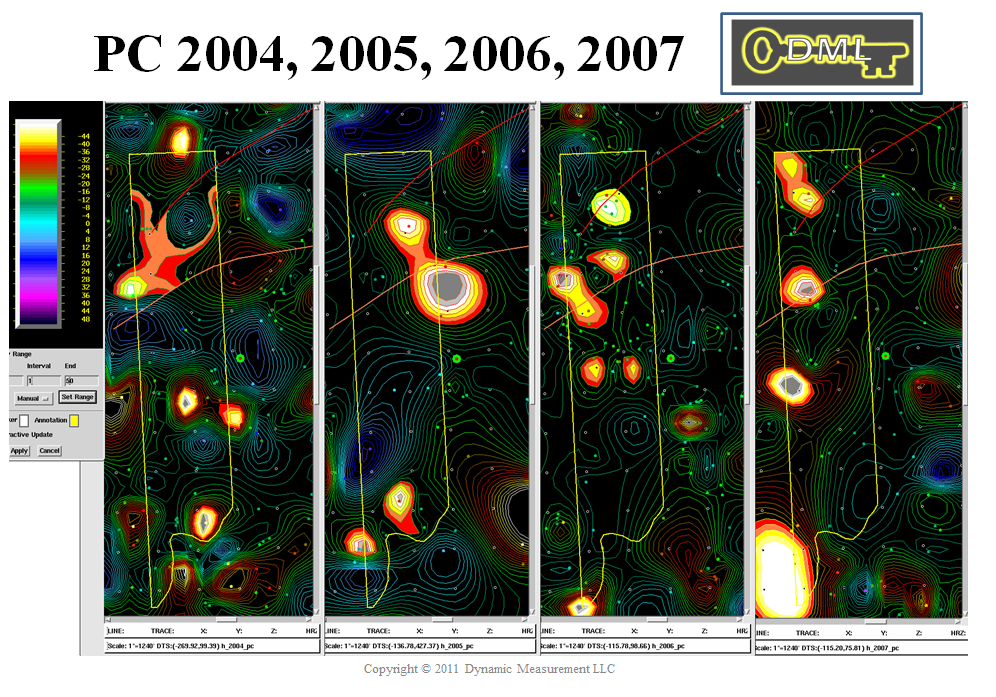
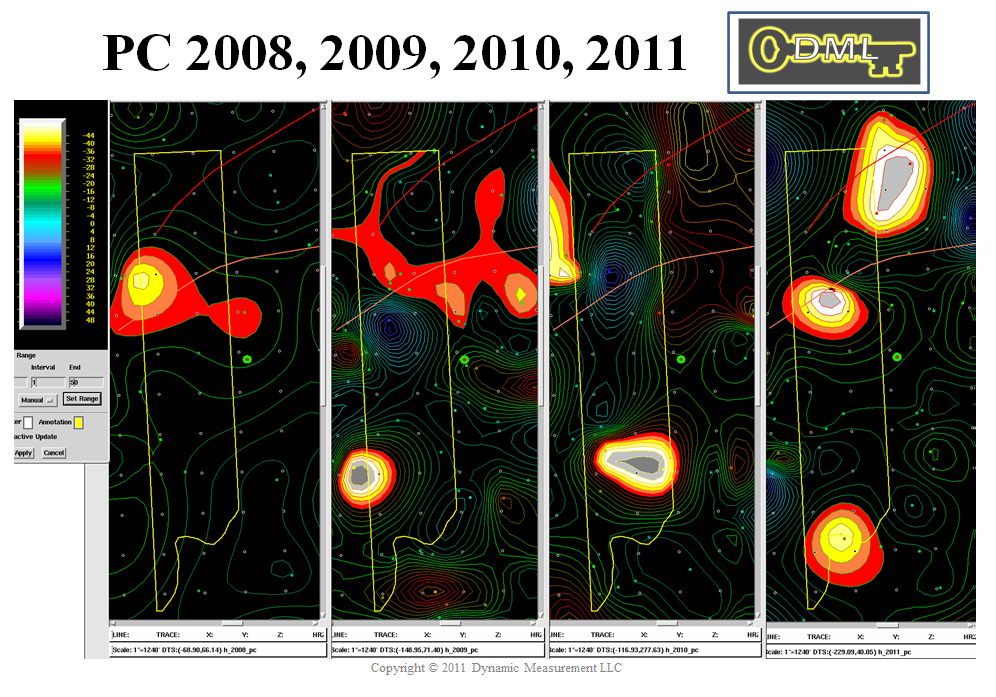
2004, 2005, 2006, 2007 Peak Current | 2008, 2009, 2010, 2011 Peak Current |
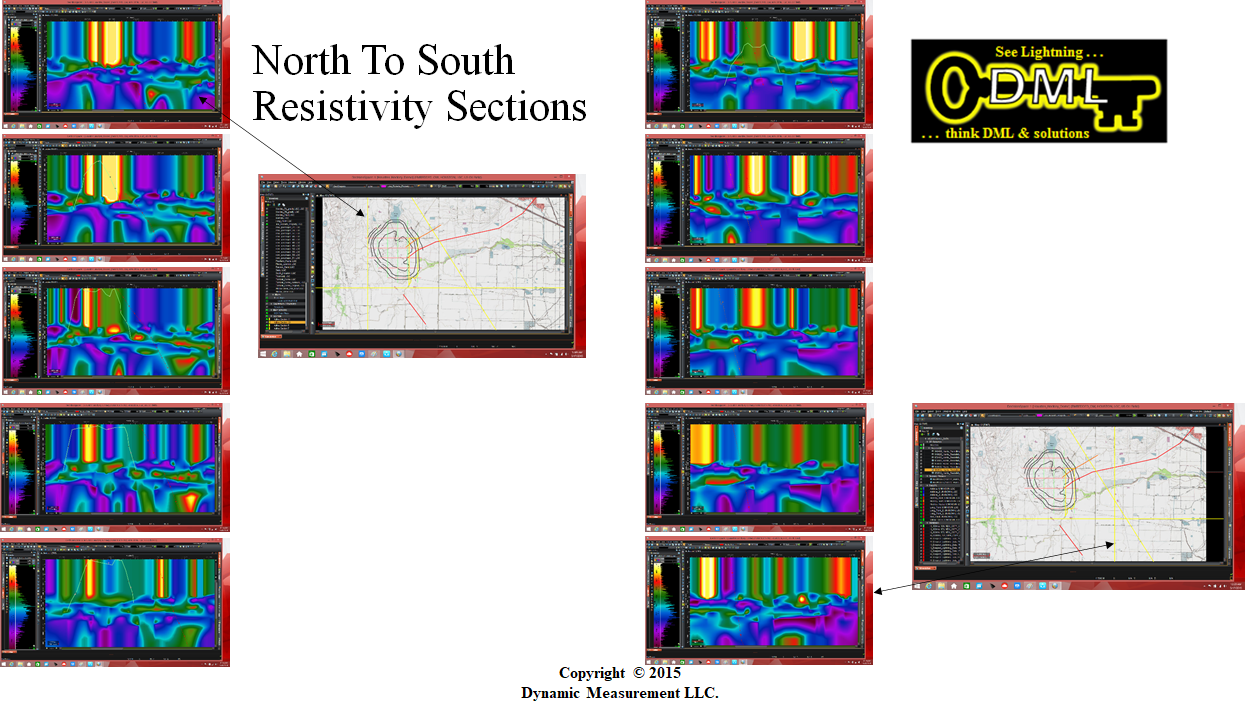
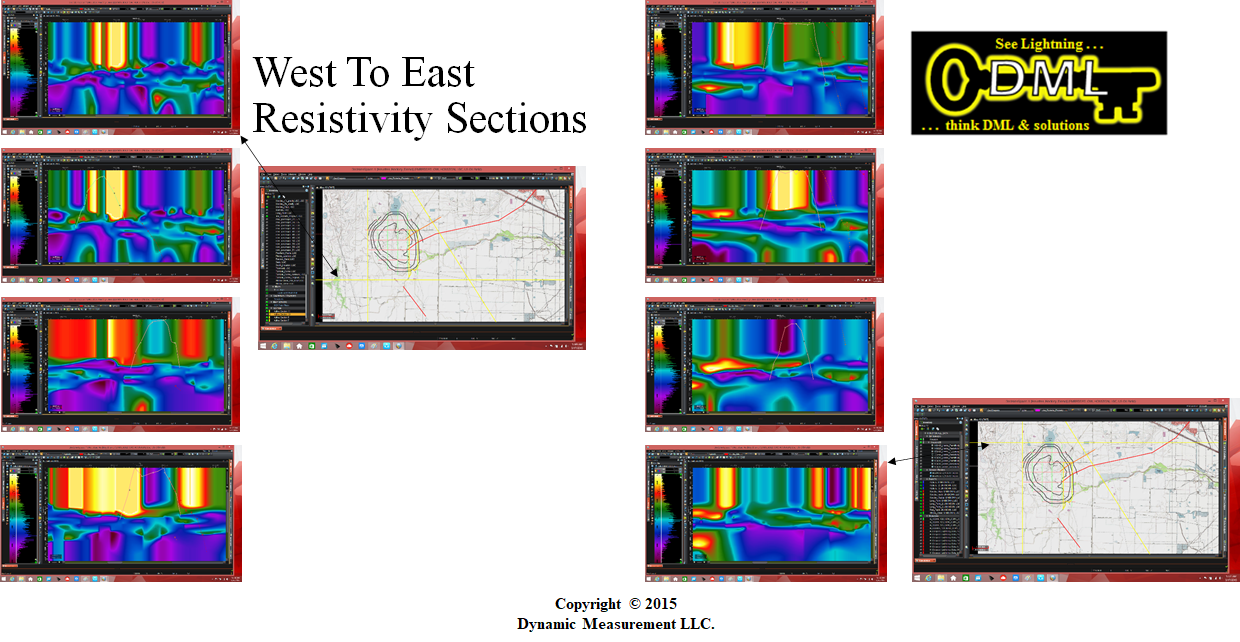
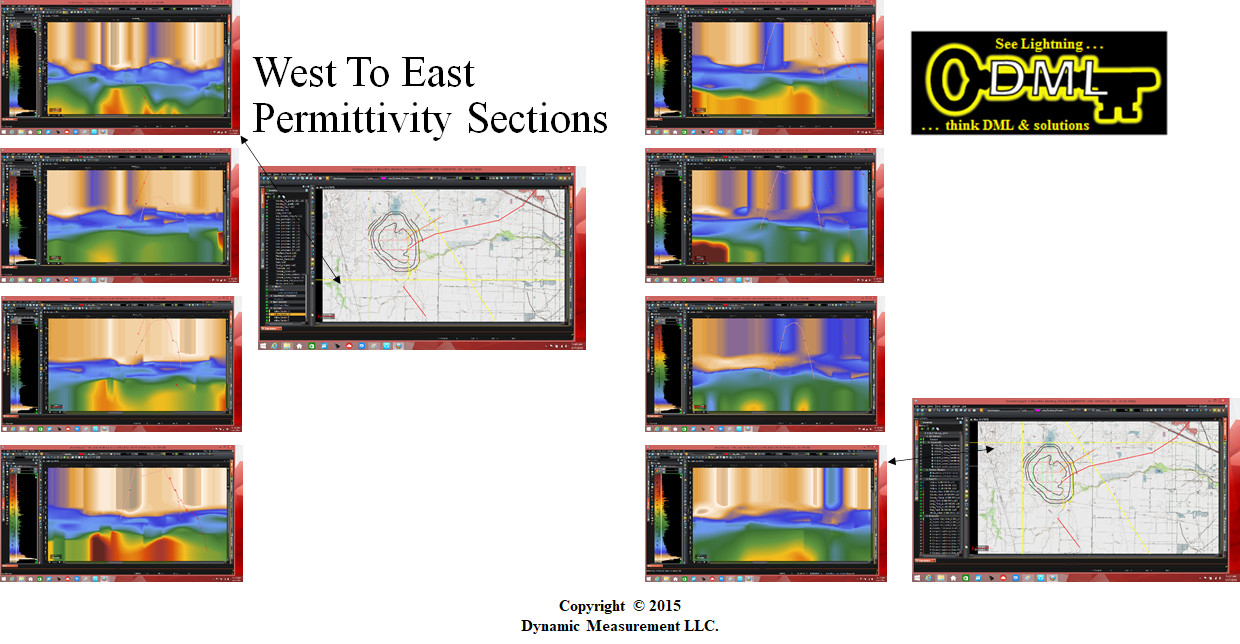
North-to-South Resistivity | West-to-East Resistivity |
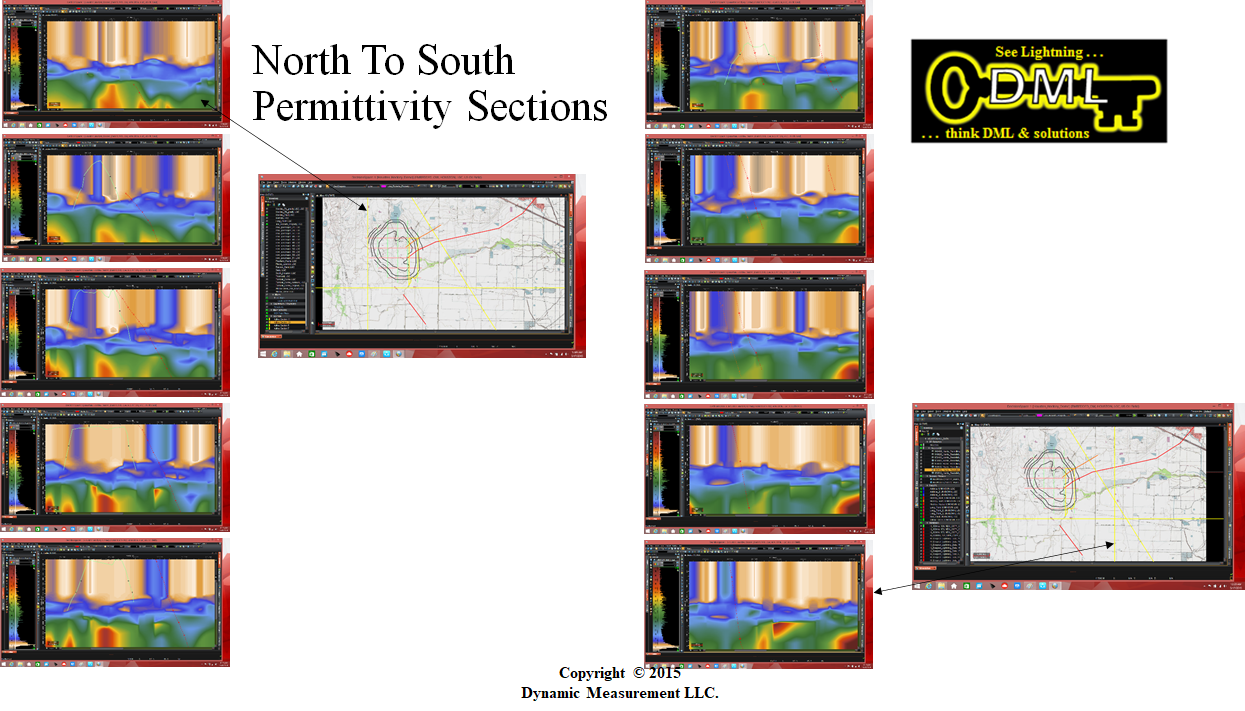
North-to-South Permittivity | West-to-East Permittivity |
 |  |
 |  |
 |  |
 |  |
 |  |
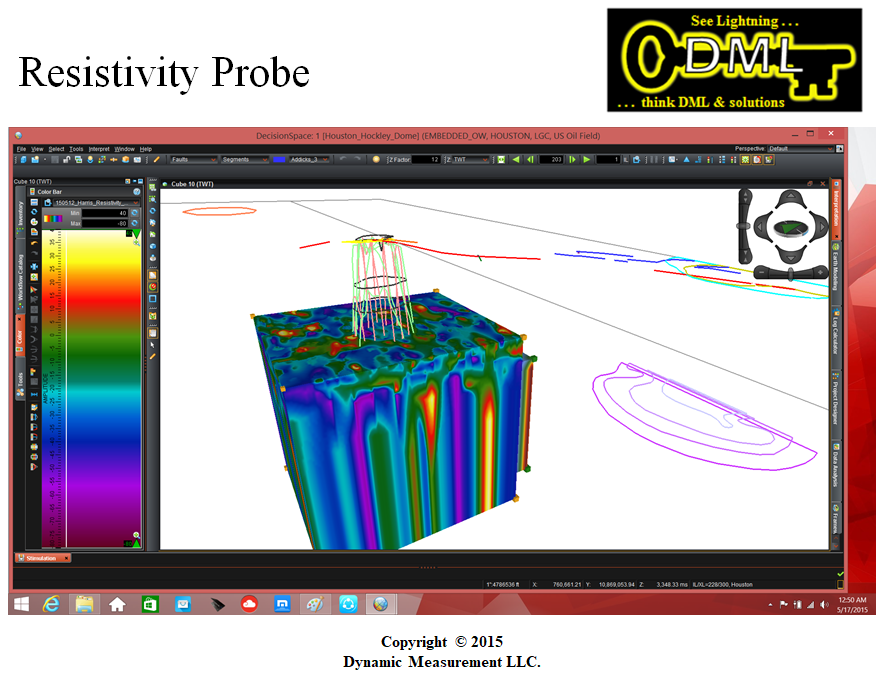
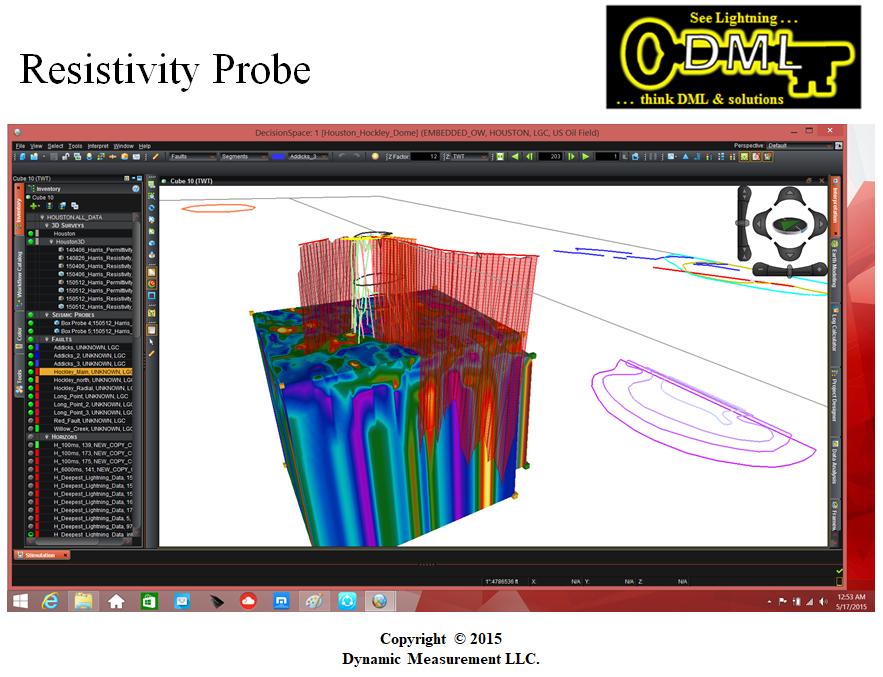
| Resistivity Probe with Dome | Resistivity Probe with Faults |
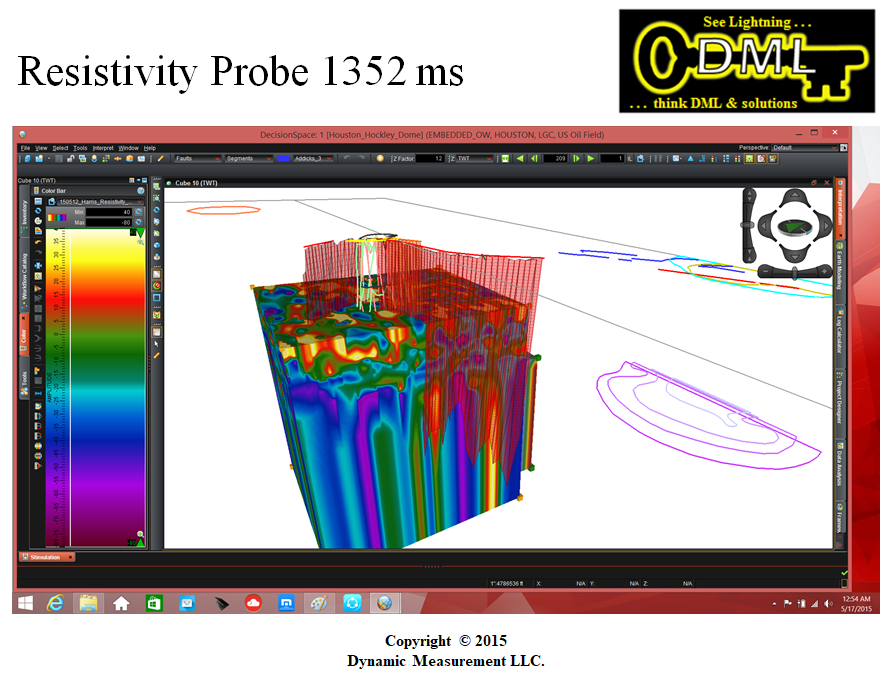
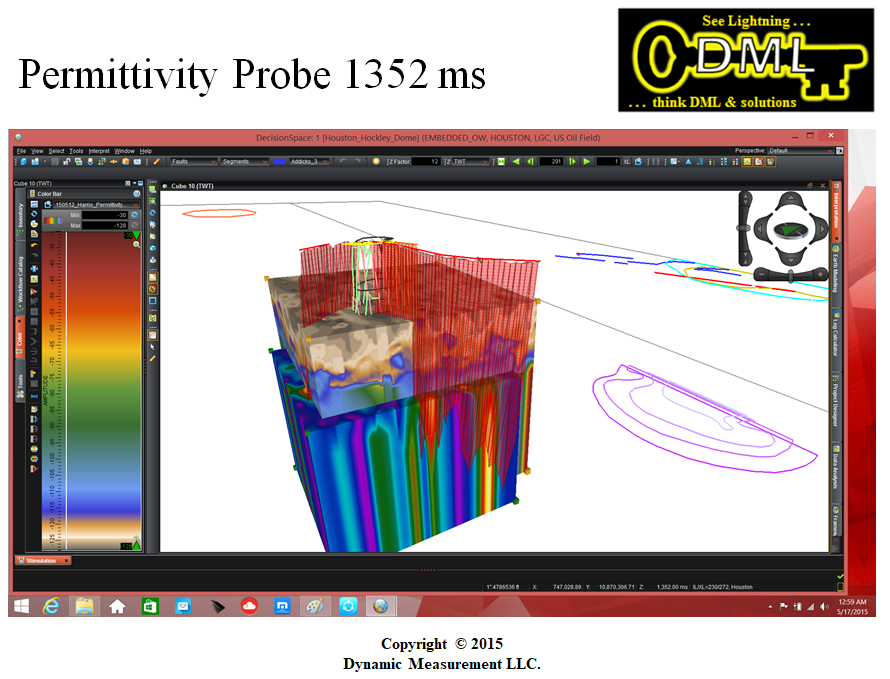
Resistivity Probe Faults 1352ms | Permittivity Probe Faults 1352ms |
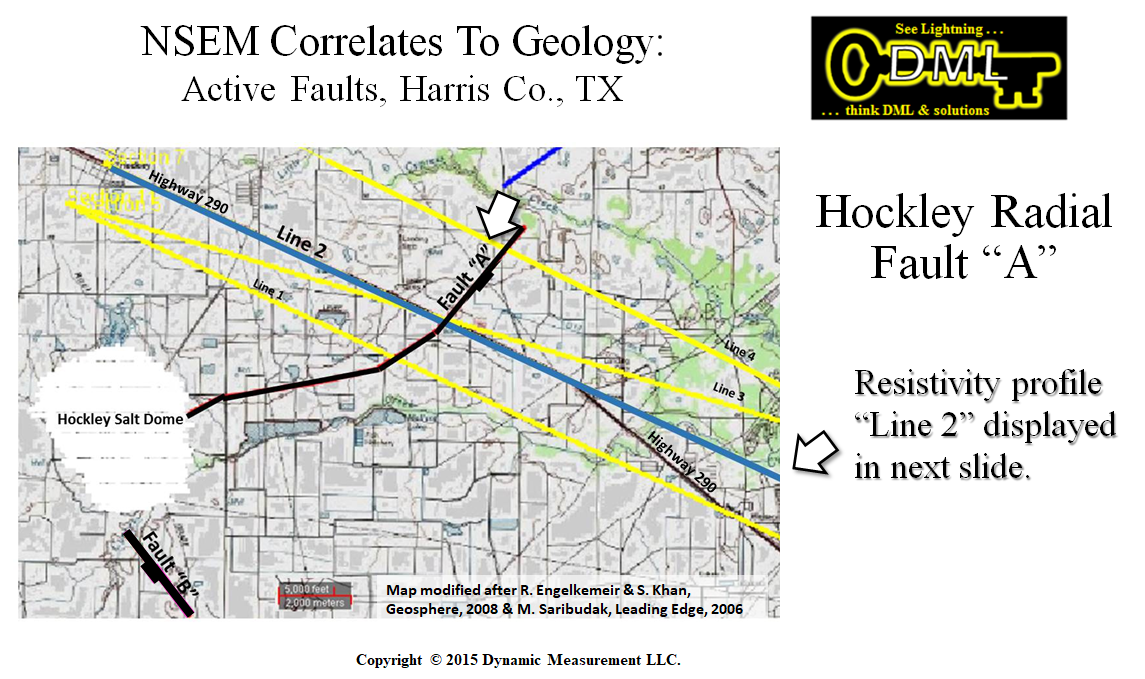
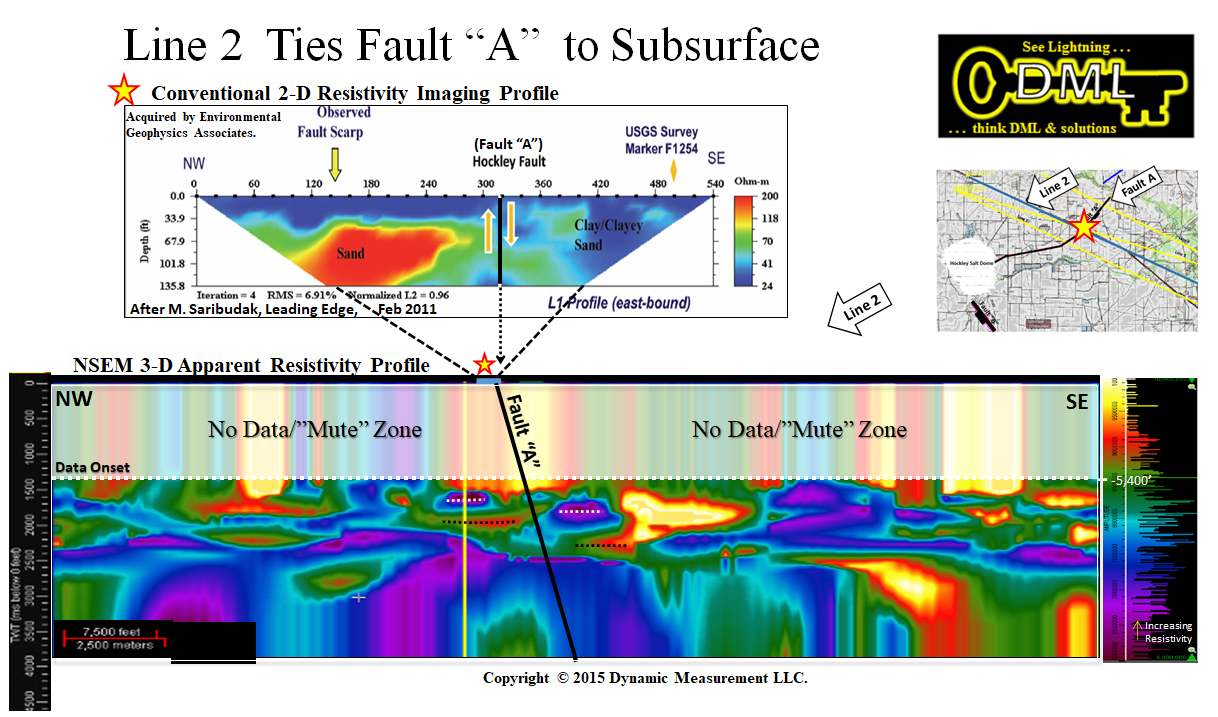
Hockley Fault "A" Line 2 Location | 2-D Restivity + Line 2 tie Fault |
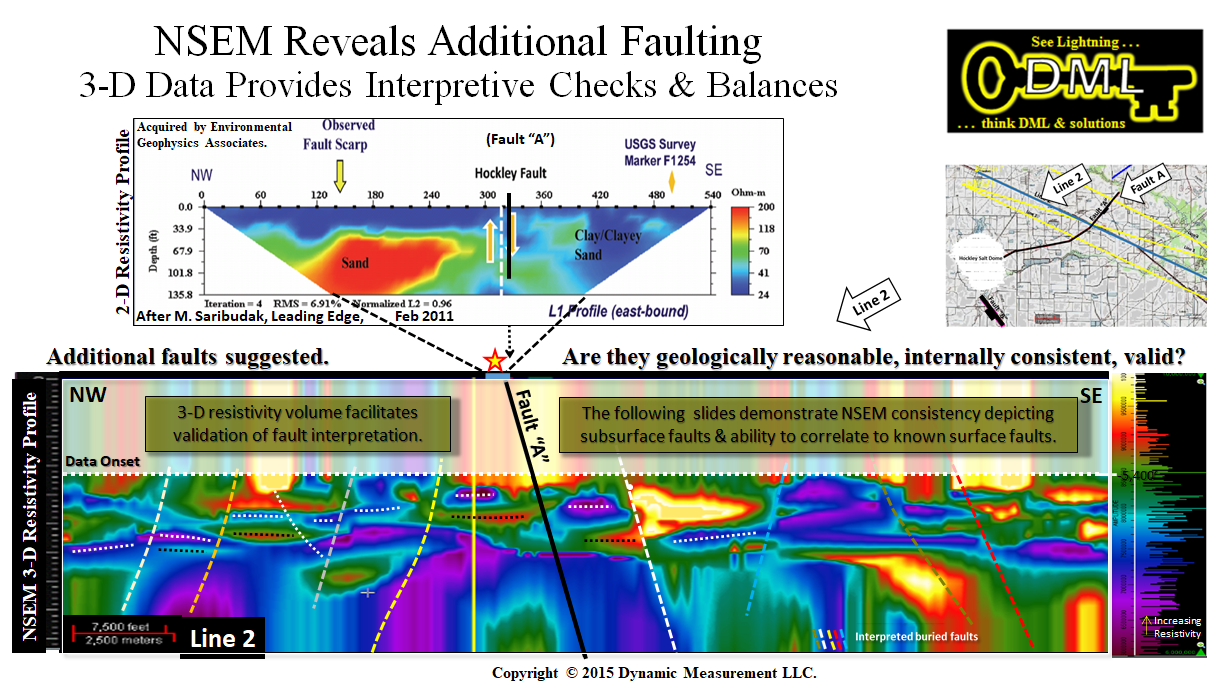
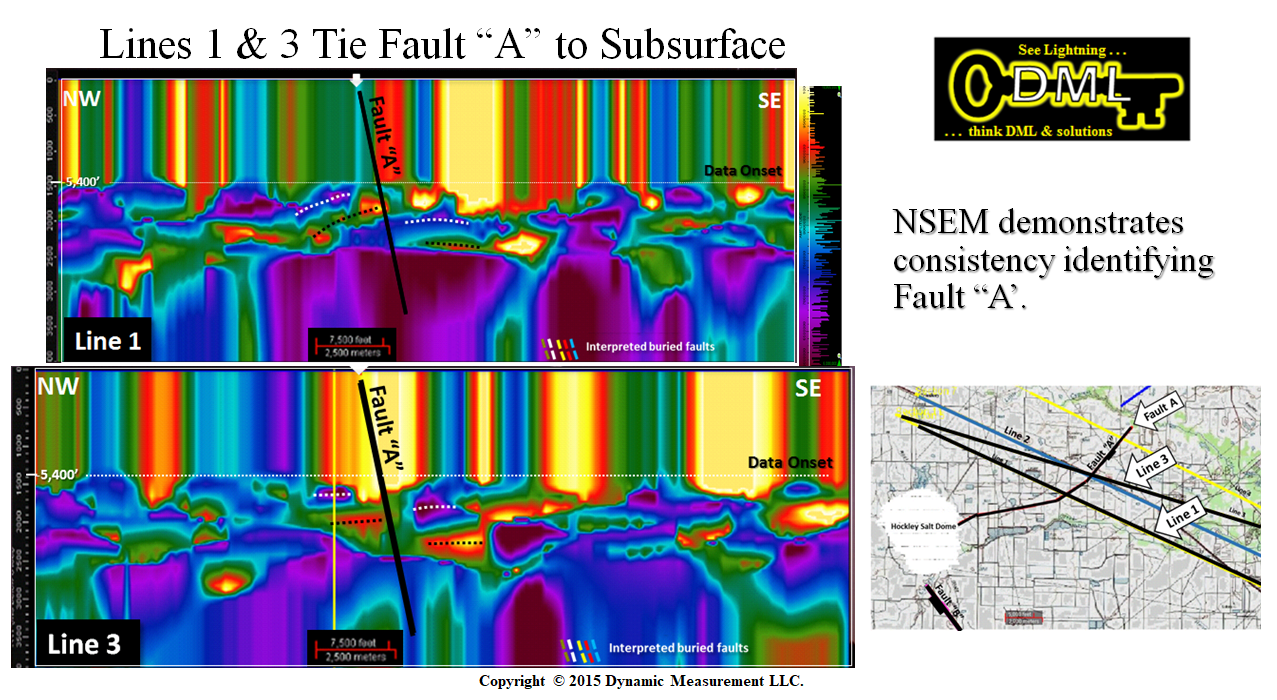
Line 2 shows additional faults | Lines 1 & 3 Tie Fault "A" |
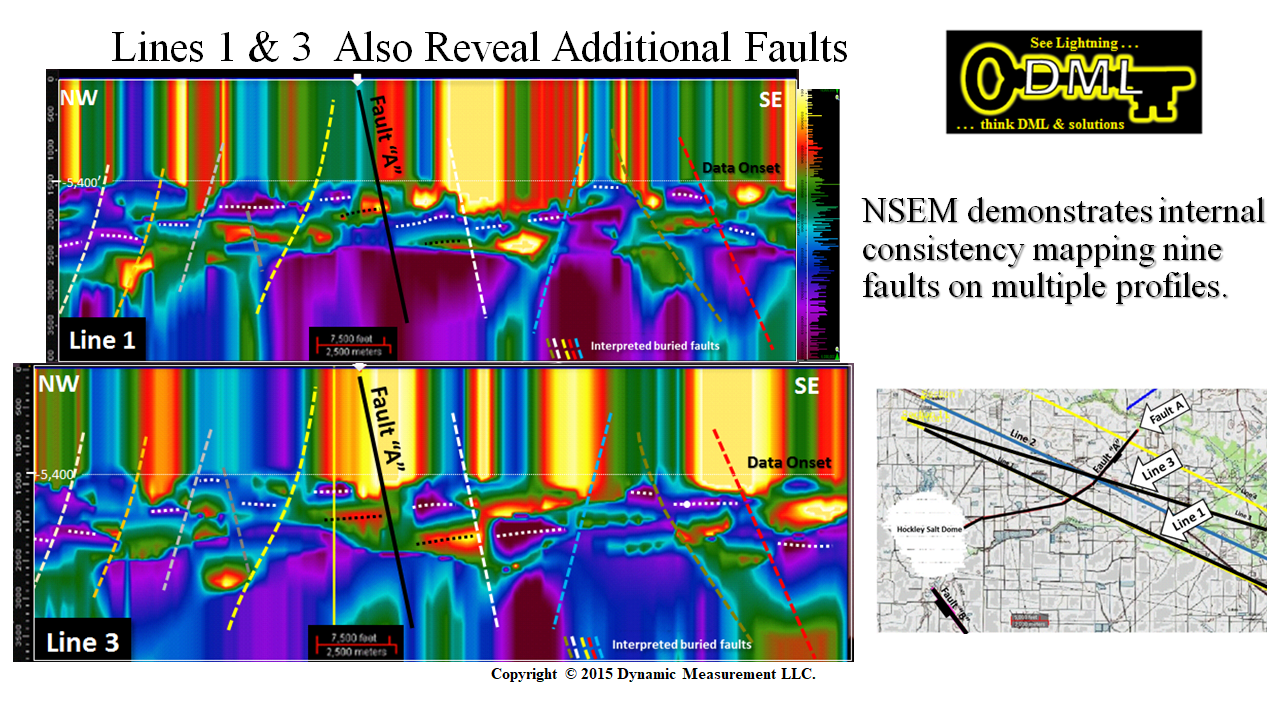
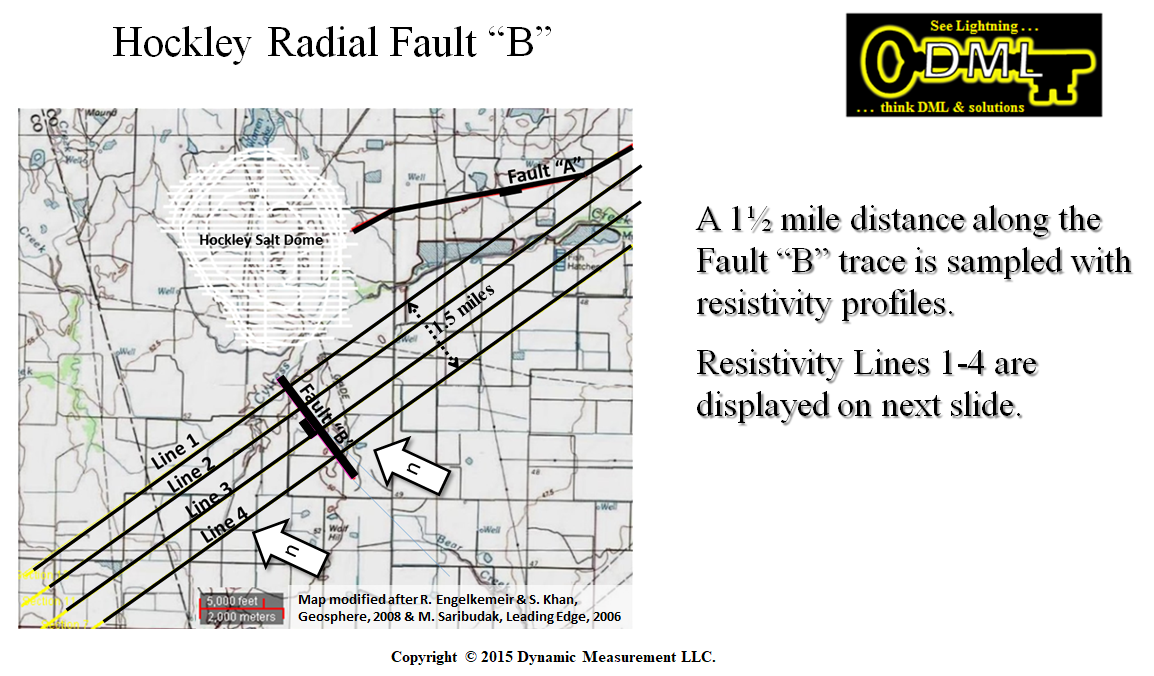
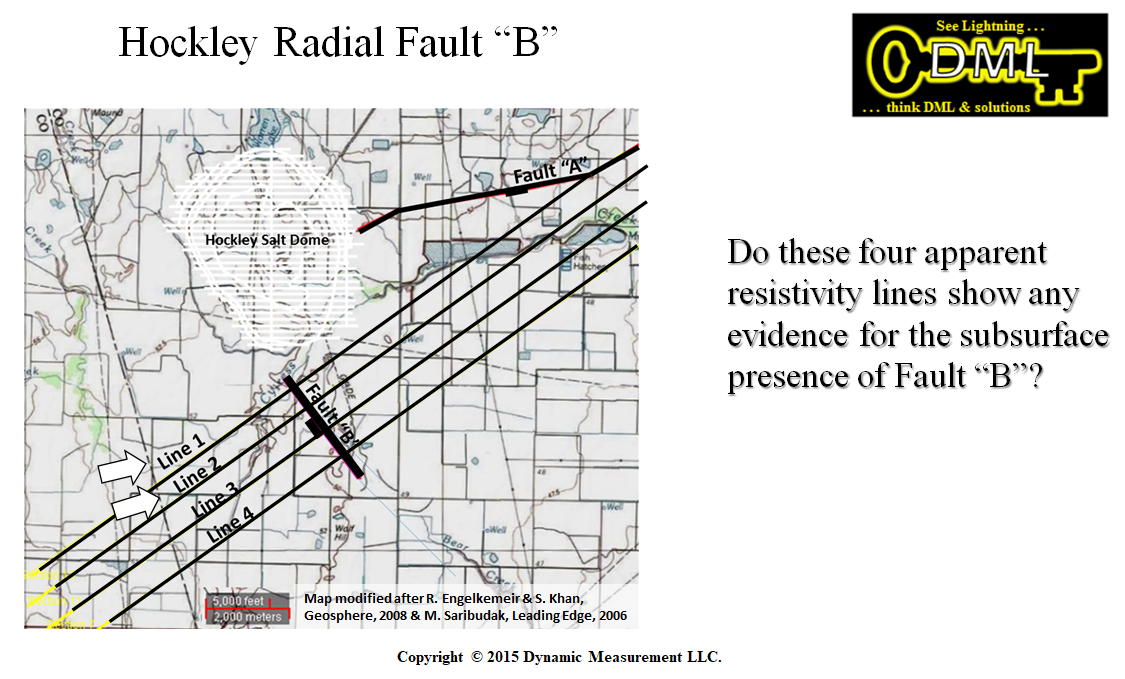
Lines 1 & 3 Show More Faults | Locations of Lines 1-4 & Fault "B" |
 |  |
 |  |
 |  |
 |  |
 |  |
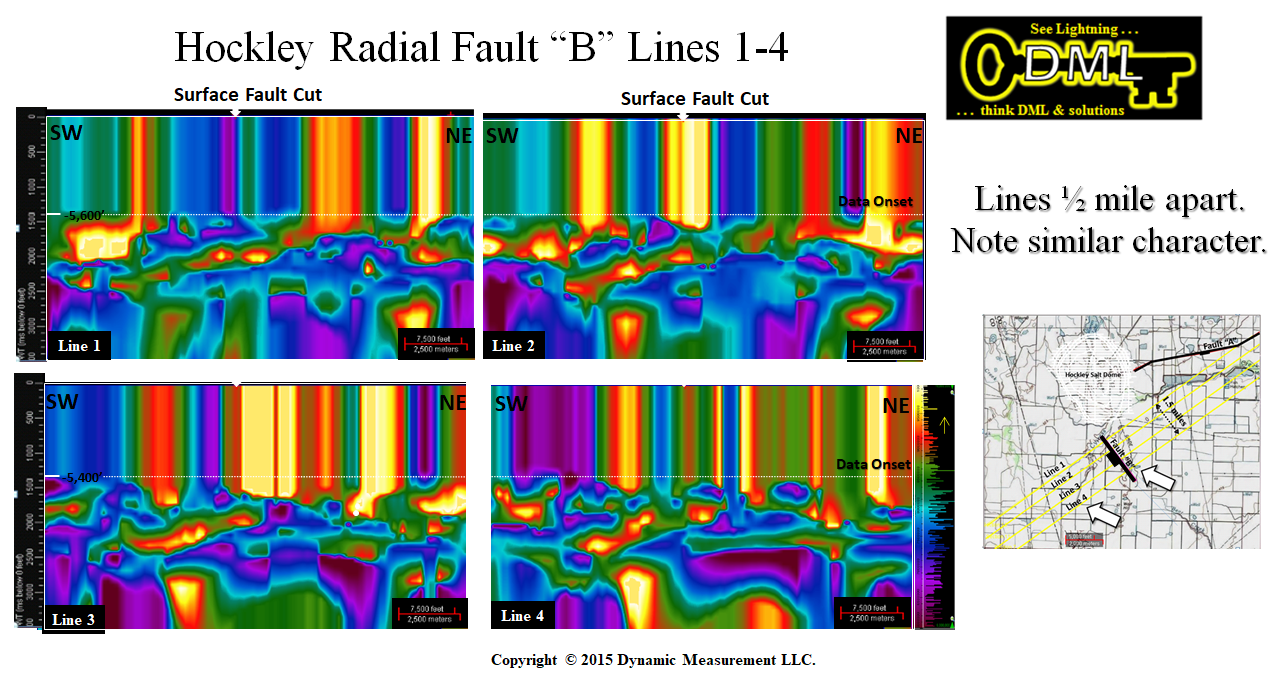
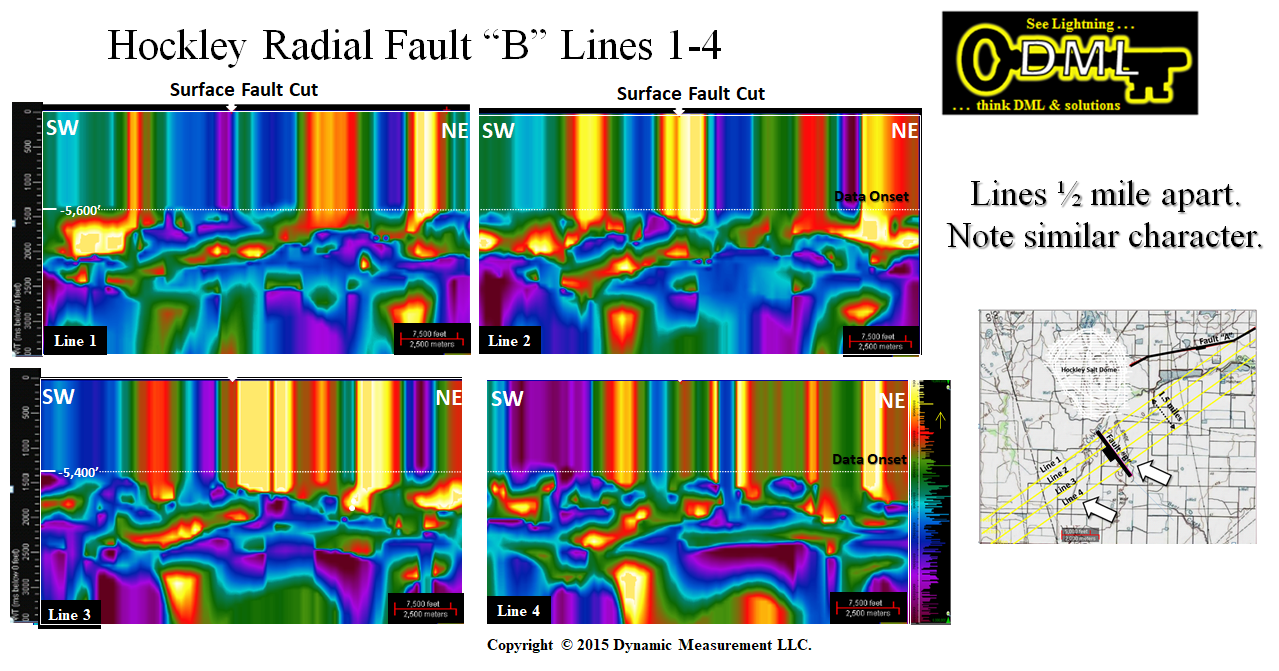
| Lines 1-4 Resistivity | Lines 1-4 Similar Data Character |
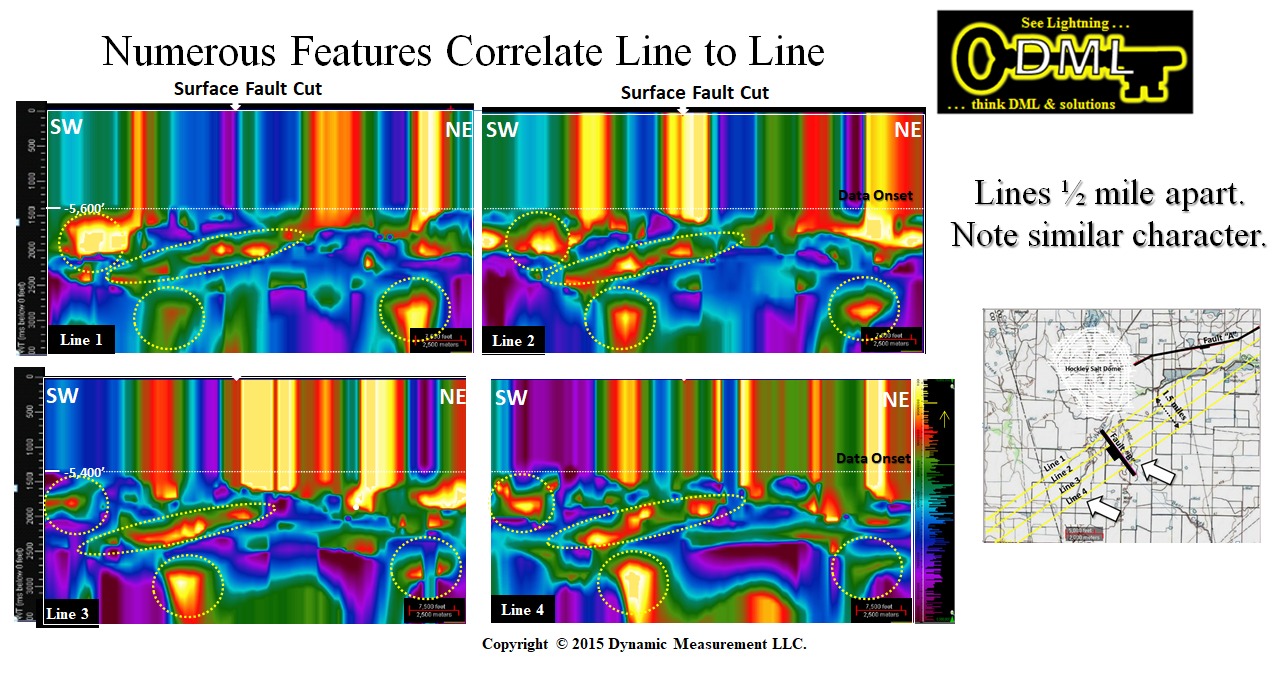
Lines 1-4 Many Similar Features | Locations of Lines 1-2 & Fault "B" |
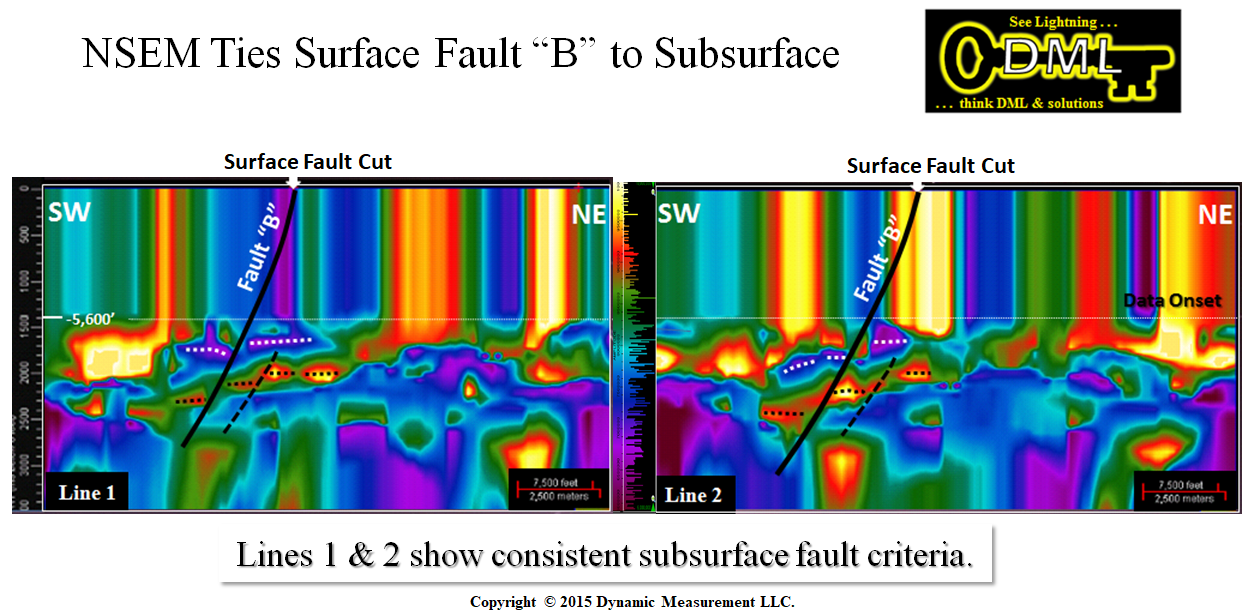
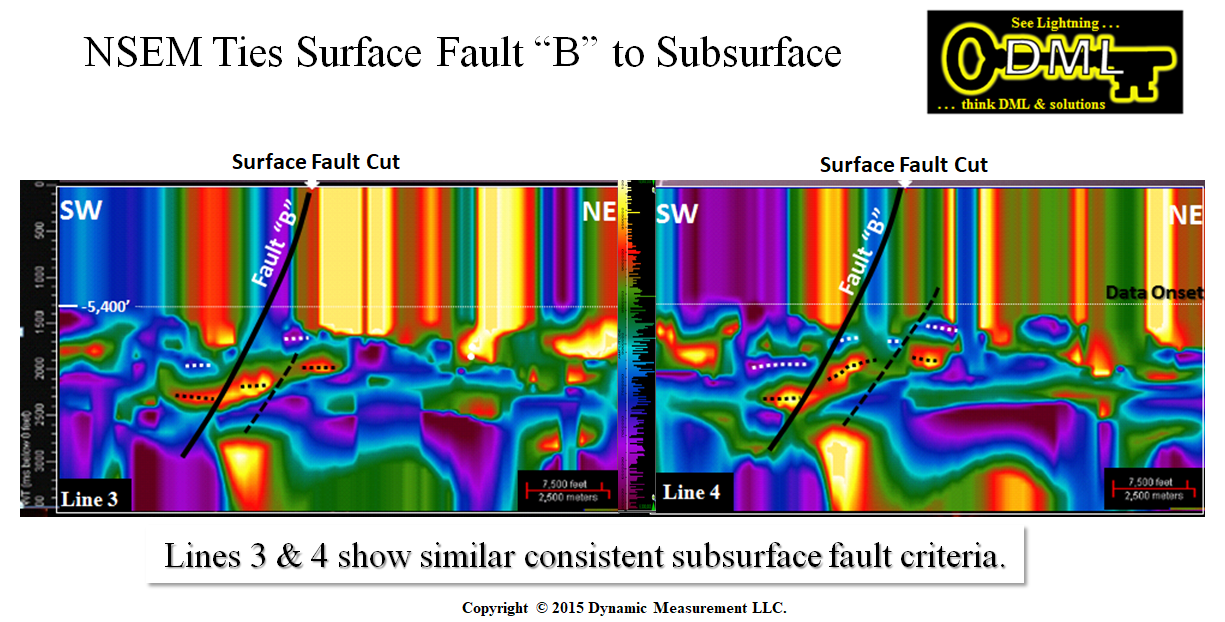
Lines 1 & 2 and Fault "B" | Lines 3 & 4 and Fault "B" |
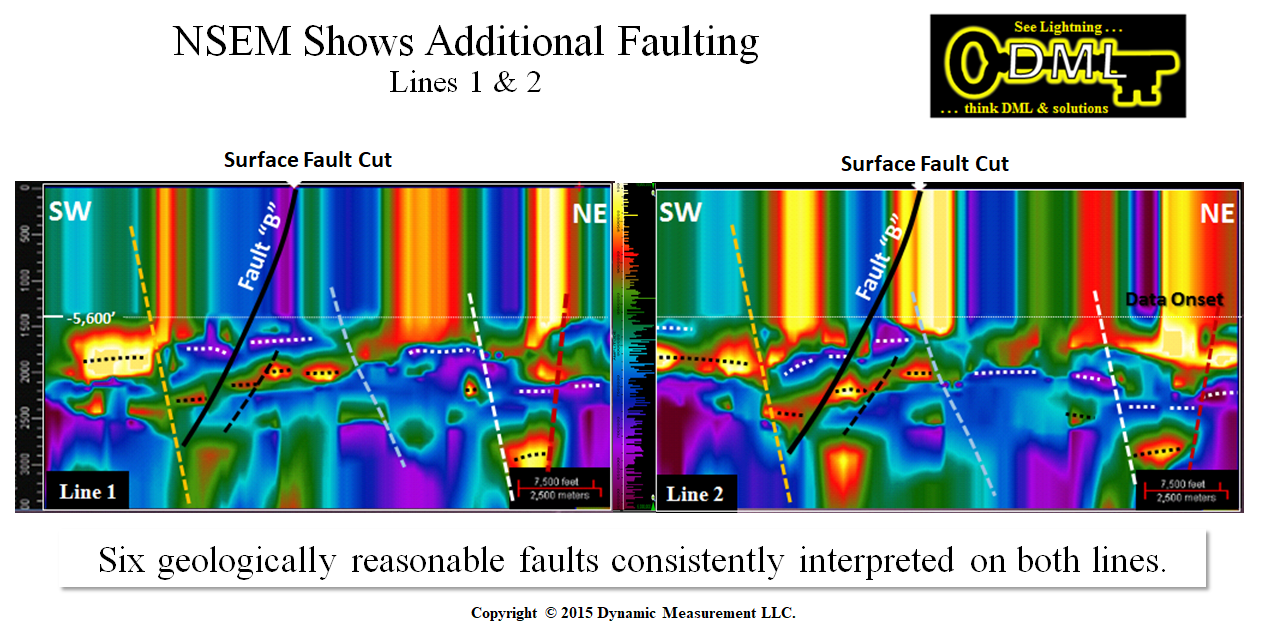
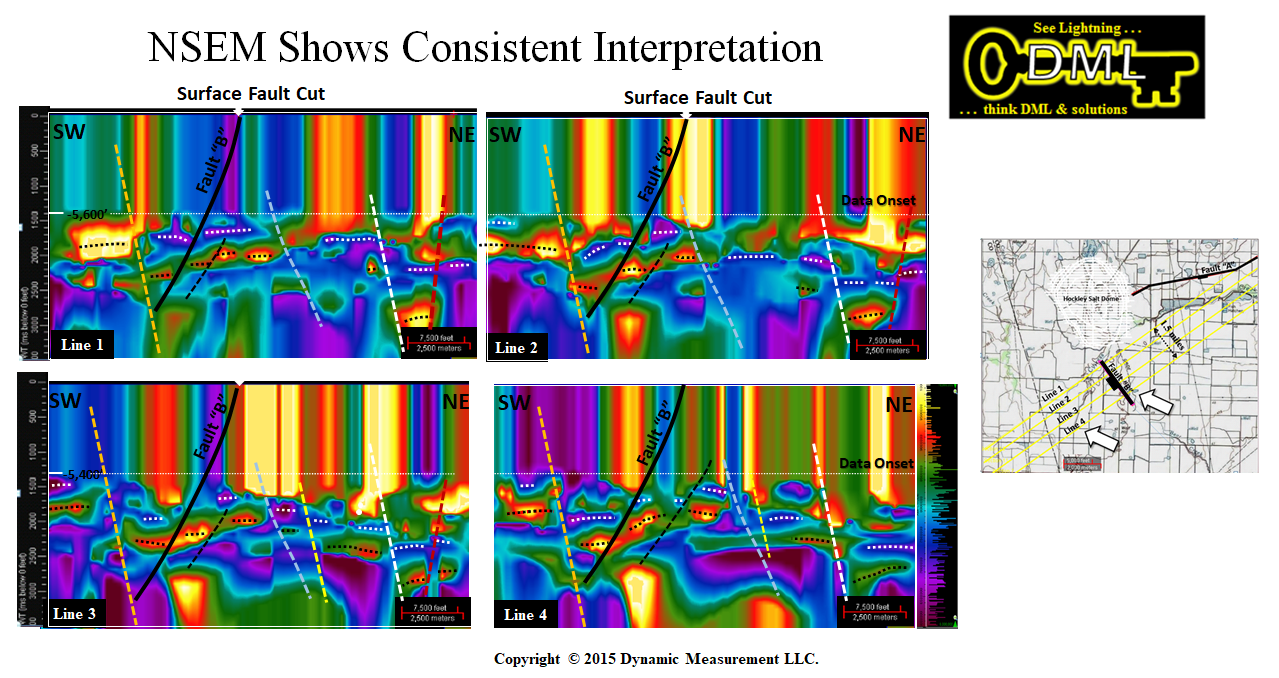
Lines 1 & 2 and Other Faults | Lines 1-4 & Fault "B" at Surface |
Lines 1-4 & Other Consistent Faults | Lines 1-4 & Similar Features |
 |  |
 |  |
 |  |
 |  |
 |  |
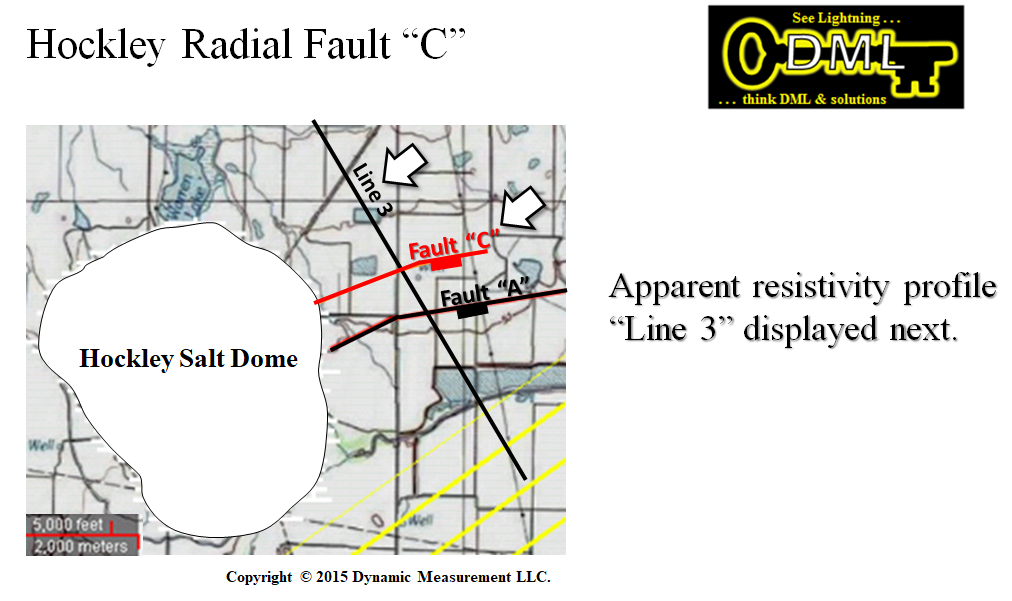
| Location of Line 3 & Fault "C" | 2-D Restivity + Line 3 tie Fault C |
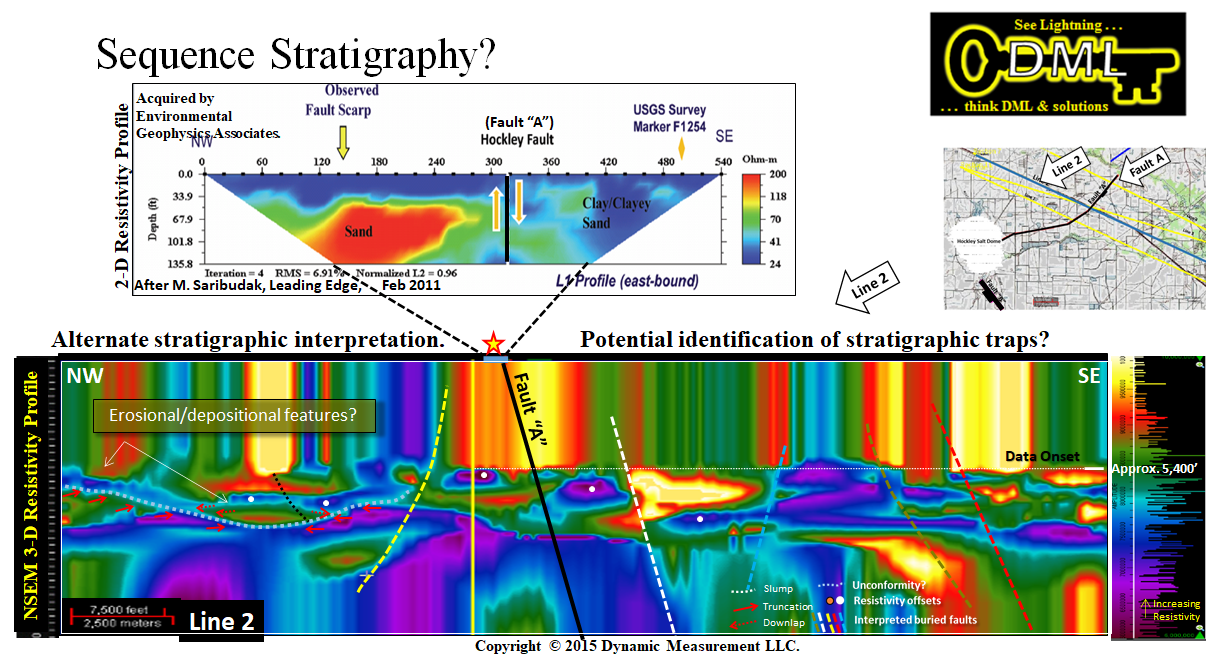
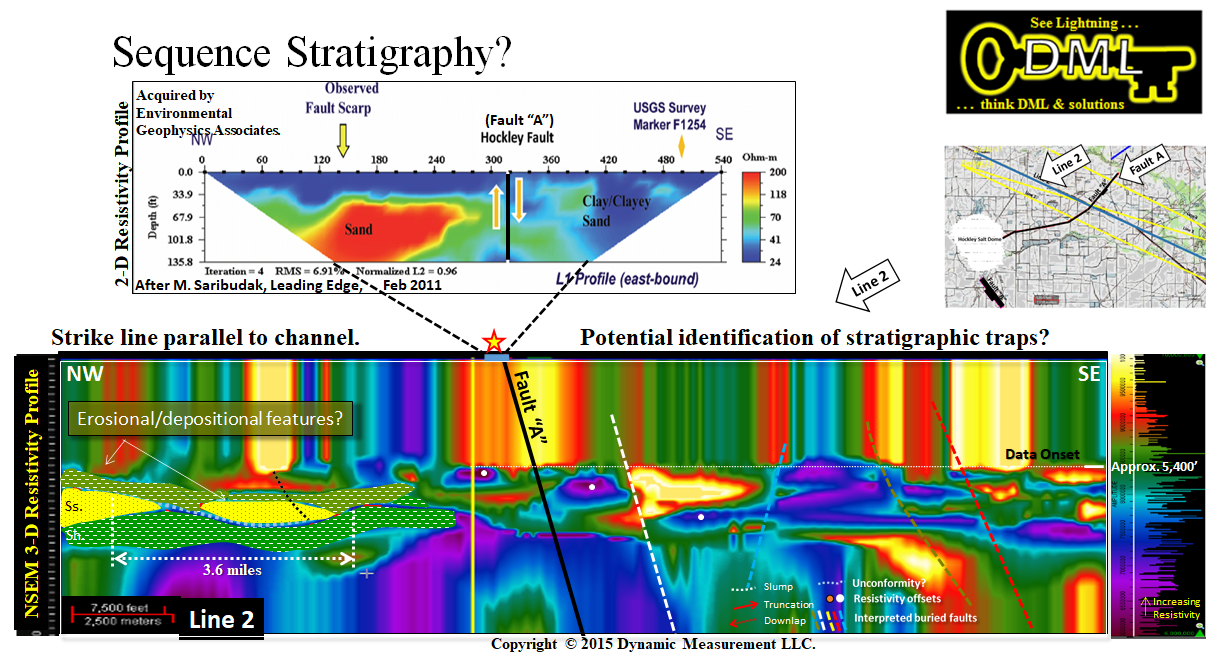
Line 2 Sequence Stratigraphy | Line 2 Features Depositional |
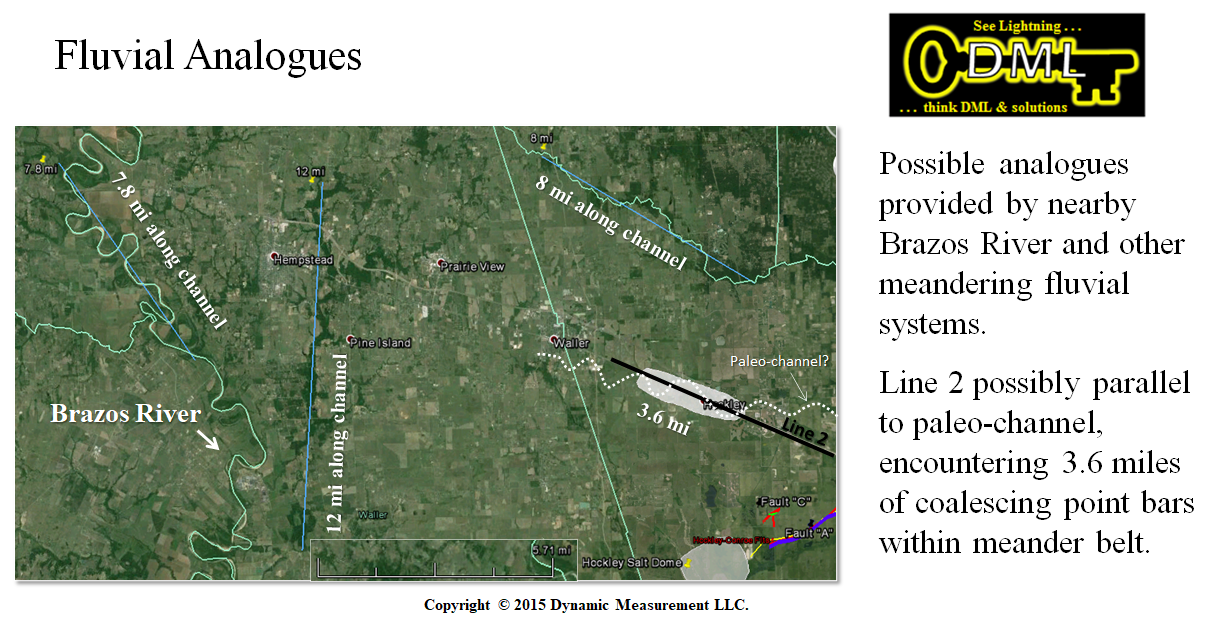
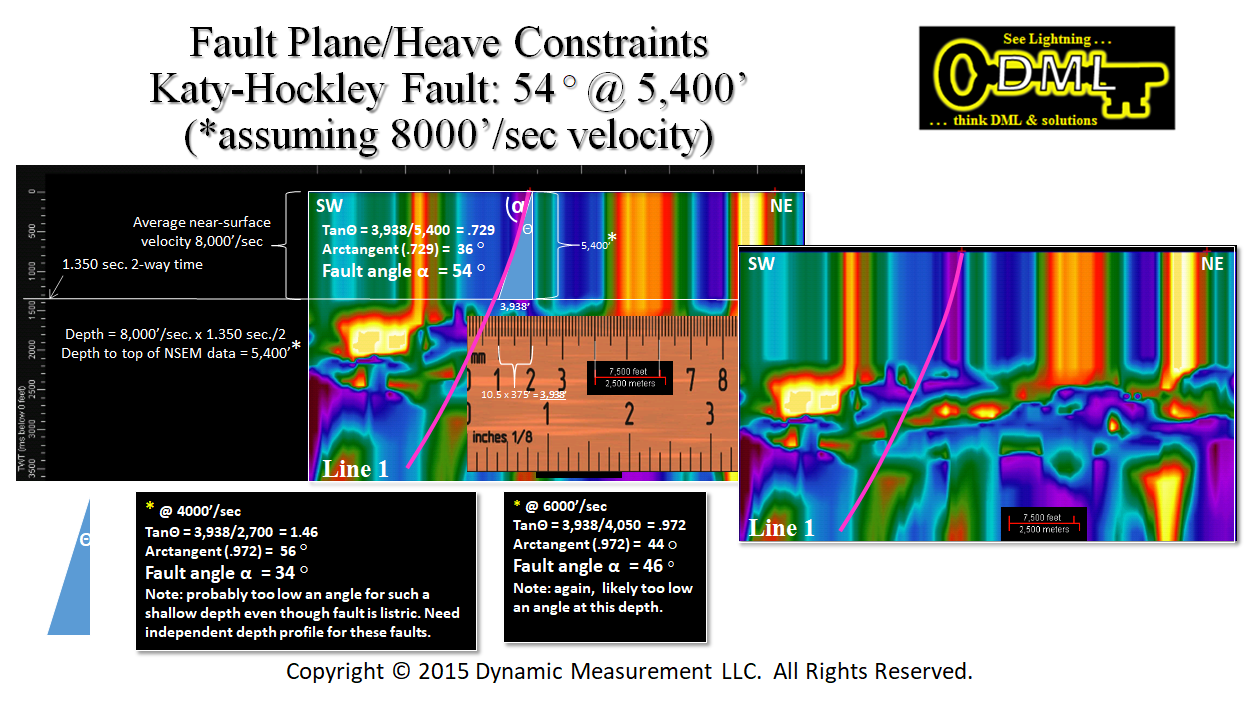
Modern Fluvial Analogs in Area | Fault Plane / Heave Constraints |
Stretch Resistivity Across Fault | Stretch Permittivity |
3 Data Sets Across Fault | 4 Data Sets Across Fault |
 |  |
 |  |
 |  |
 |  |
 |  |
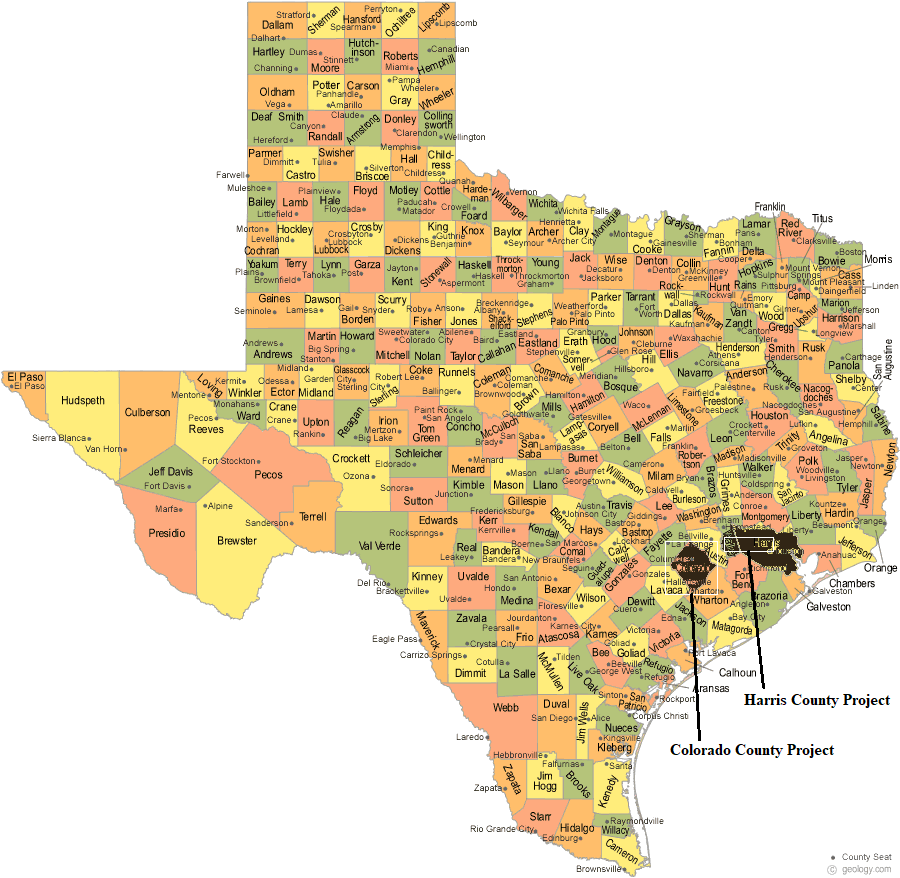
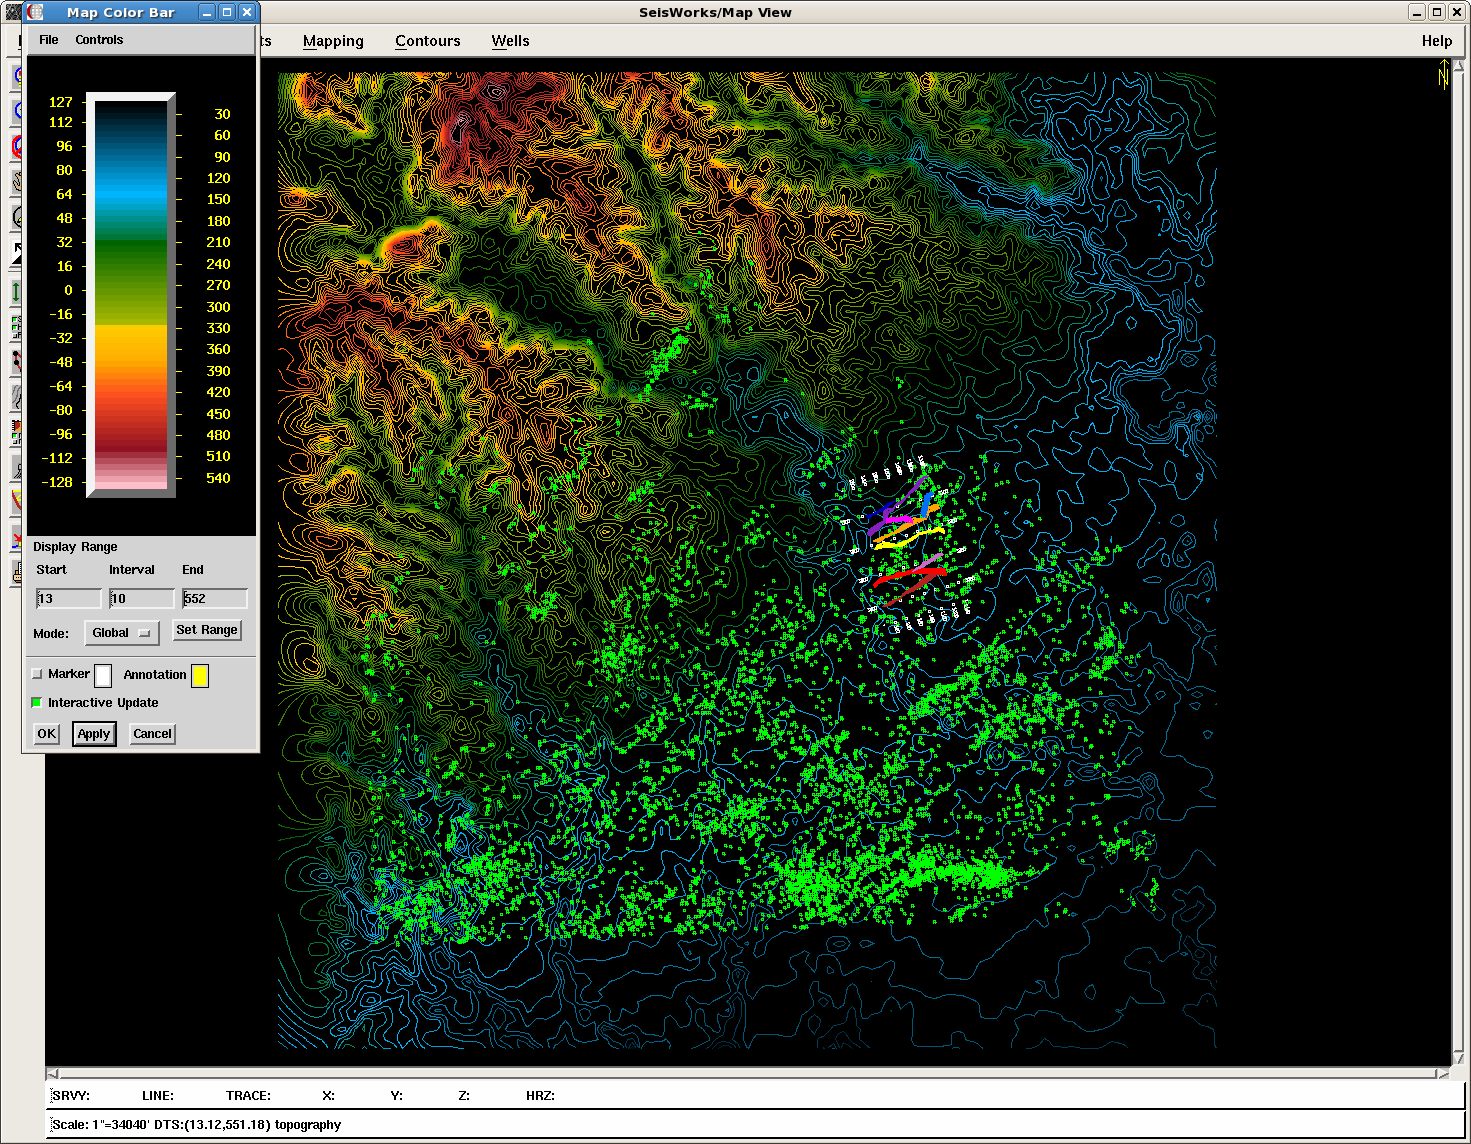
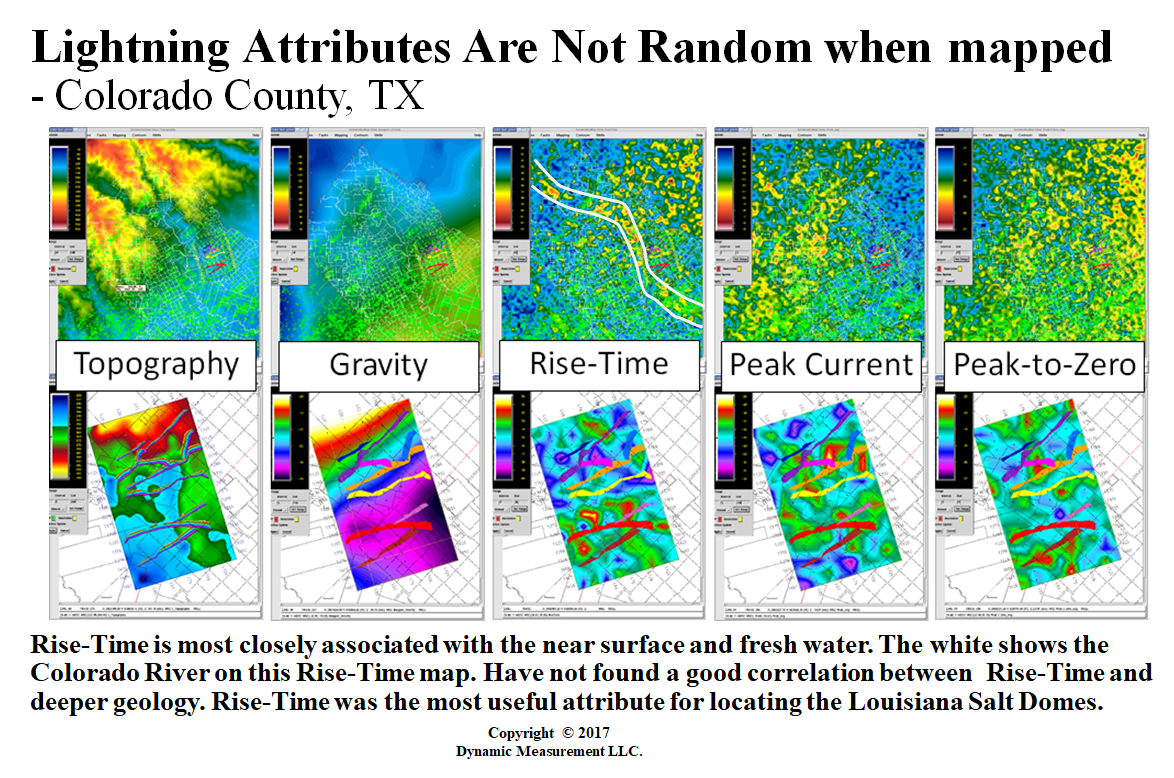
| Colorado County Houston County Locations | Topography, Wells, Echo 3D Survey Faults |
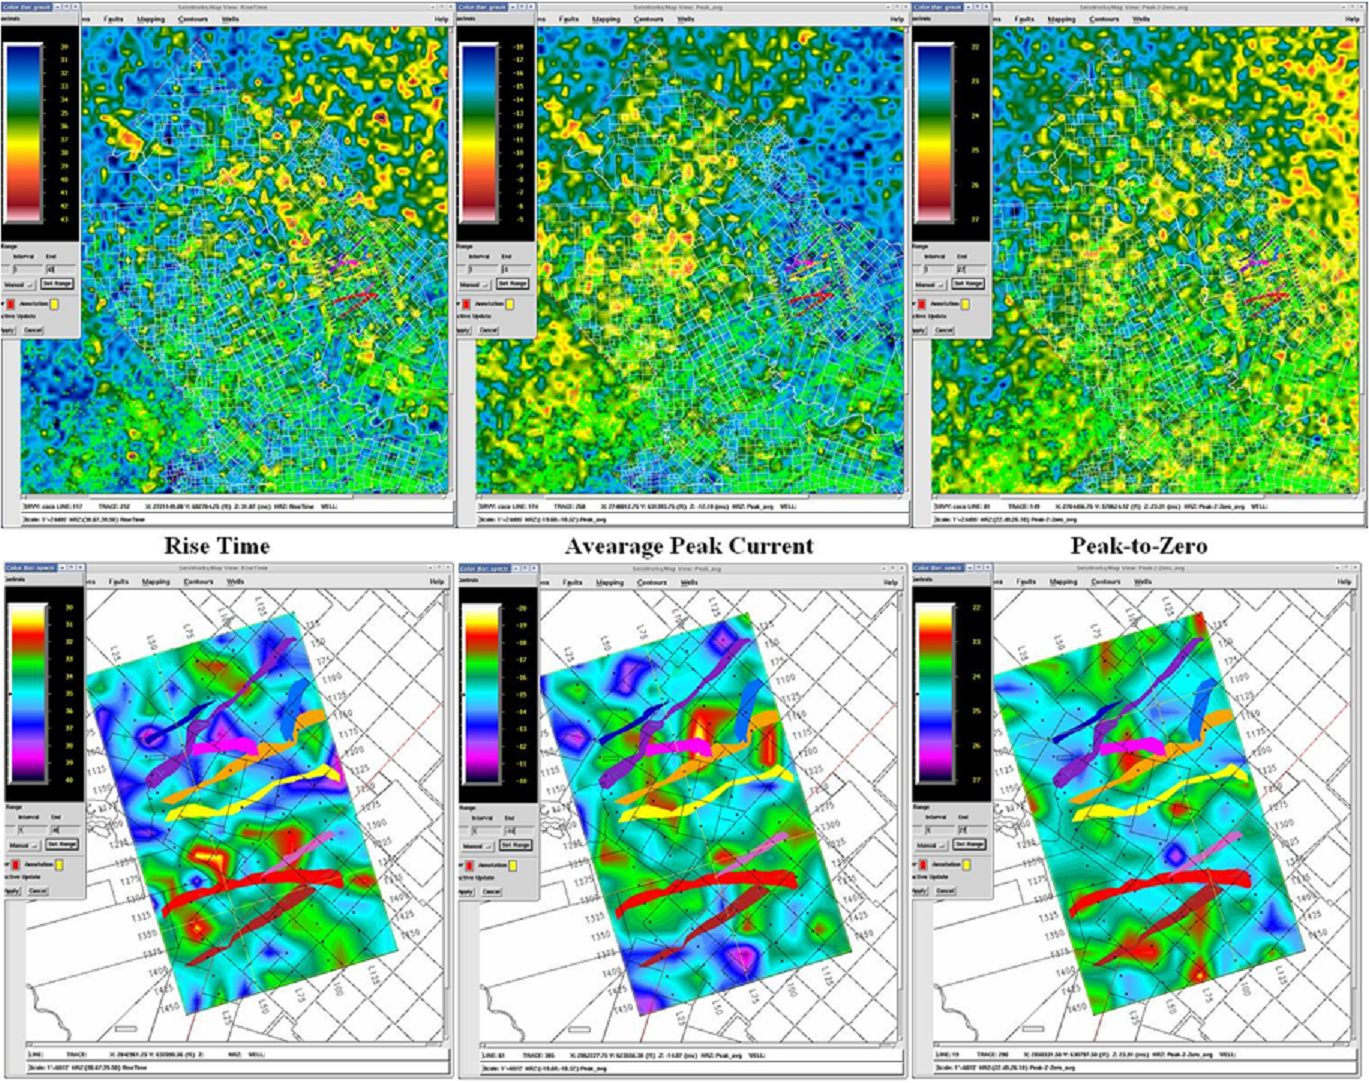
Topo, Gravity, Rise-Time, Peak Current, & P2Z | Rise-Time, note Colorado River Strong Events |
Rise-Time with Colorado County Boundary | Rise-Time with 3-D Seismic Faults |
Peak Current, note Strong Events on West | Peak Current with 3-D Seismic Faults |
Peak-to-Zero, note Strong Events on East | Peak-to-Zero with 3-D Seismic Faults |
 |  |
 |  |
 |  |
 |  |
 |  |
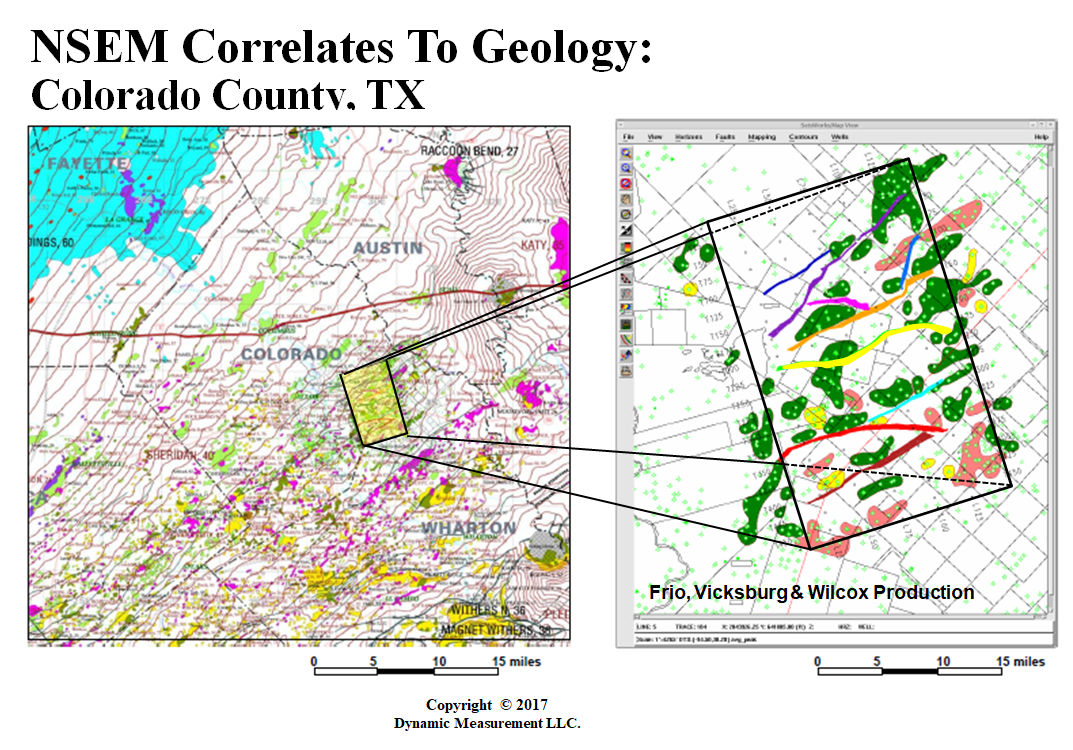
| Comparing Rise-Time, Peak Current, & P2Z | Location Showing NSEM Correlates to Geology |
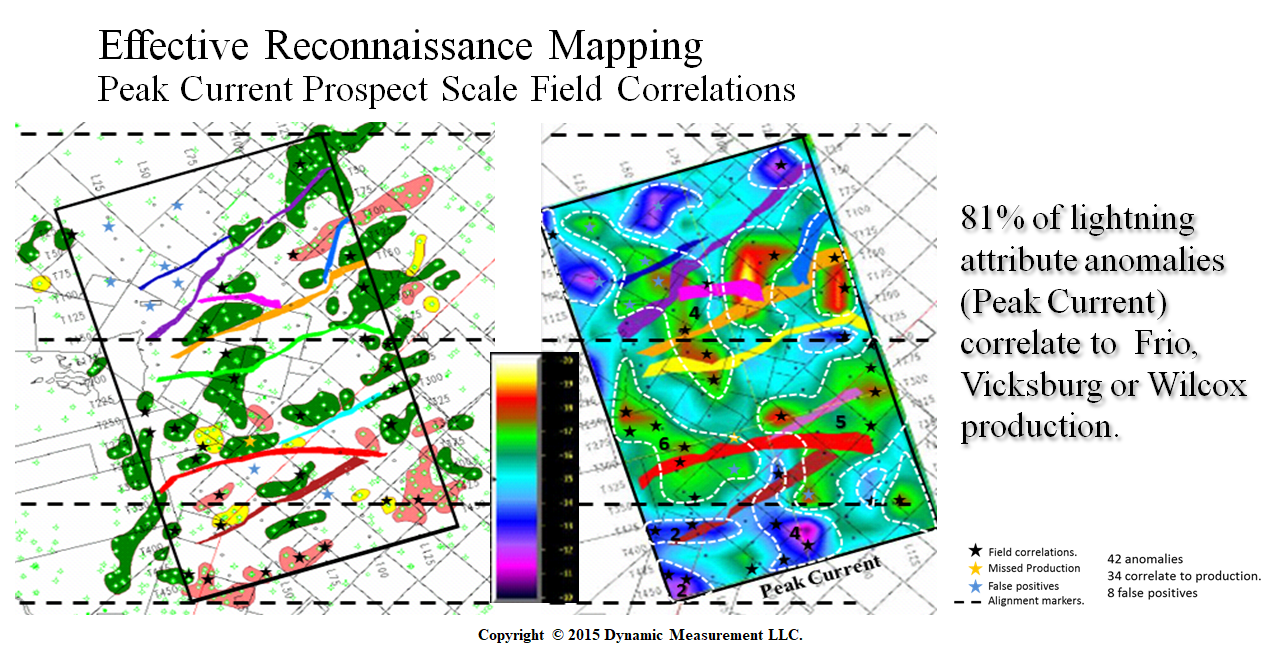
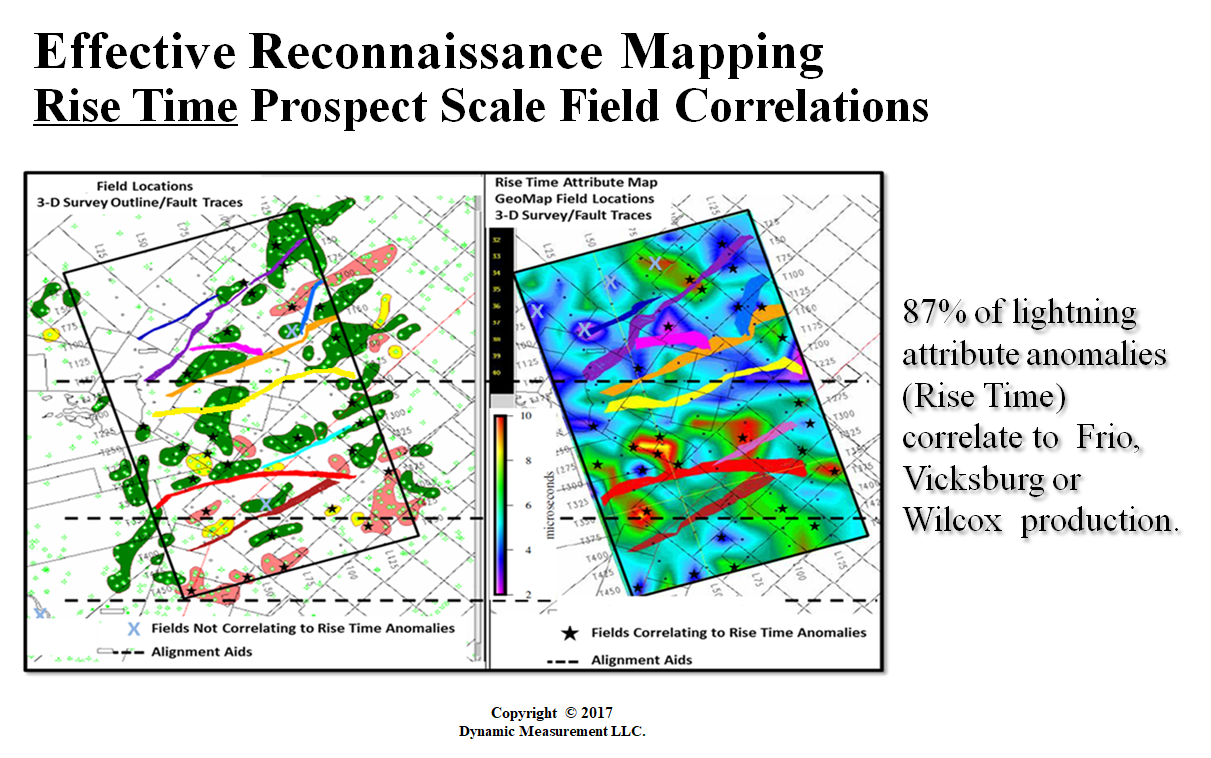
81% High PC Correlate to Production | 87% High RT Correlate to Production |
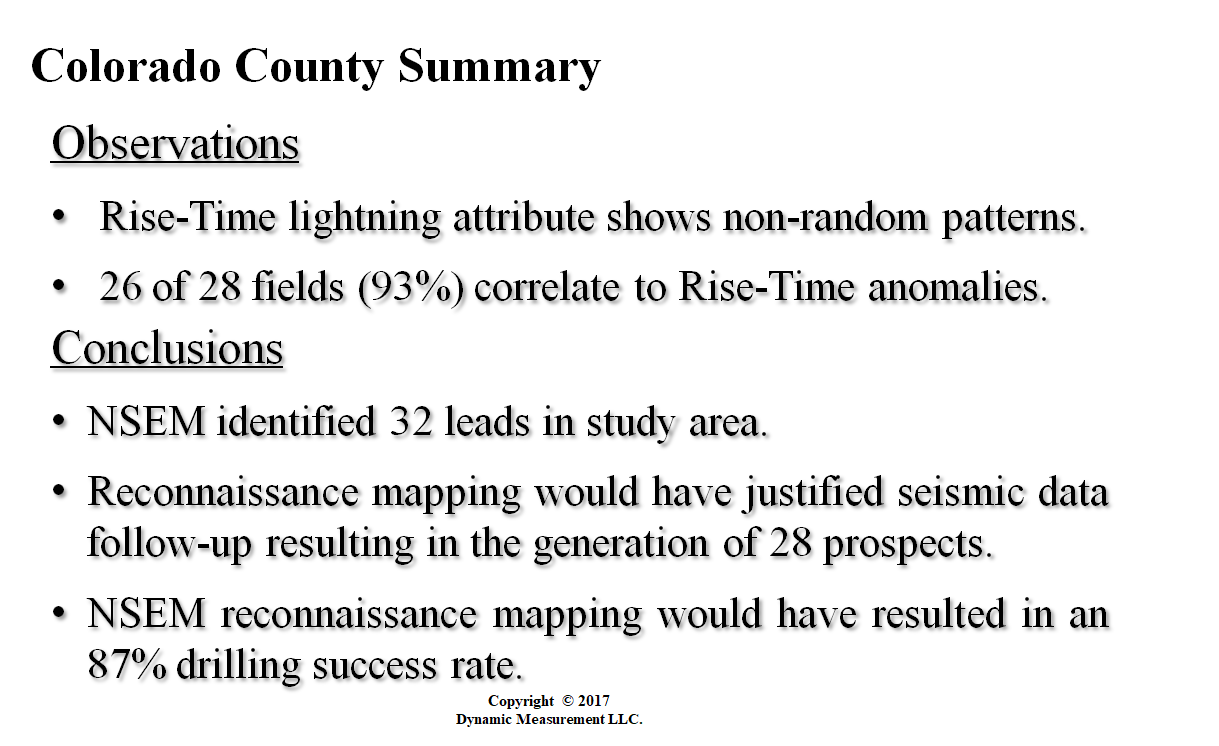
Colorado County Lightning Summary | Topography with Ewing Faults |
Rise-Time with Ewing Faults | Peak Current with Ewing Faults |
Peak-to-Zero with Ewing Faults | Peak-to-Zero with Ewing Faults |
 |  |
 |  |
 |  |
 |  |
 |  |
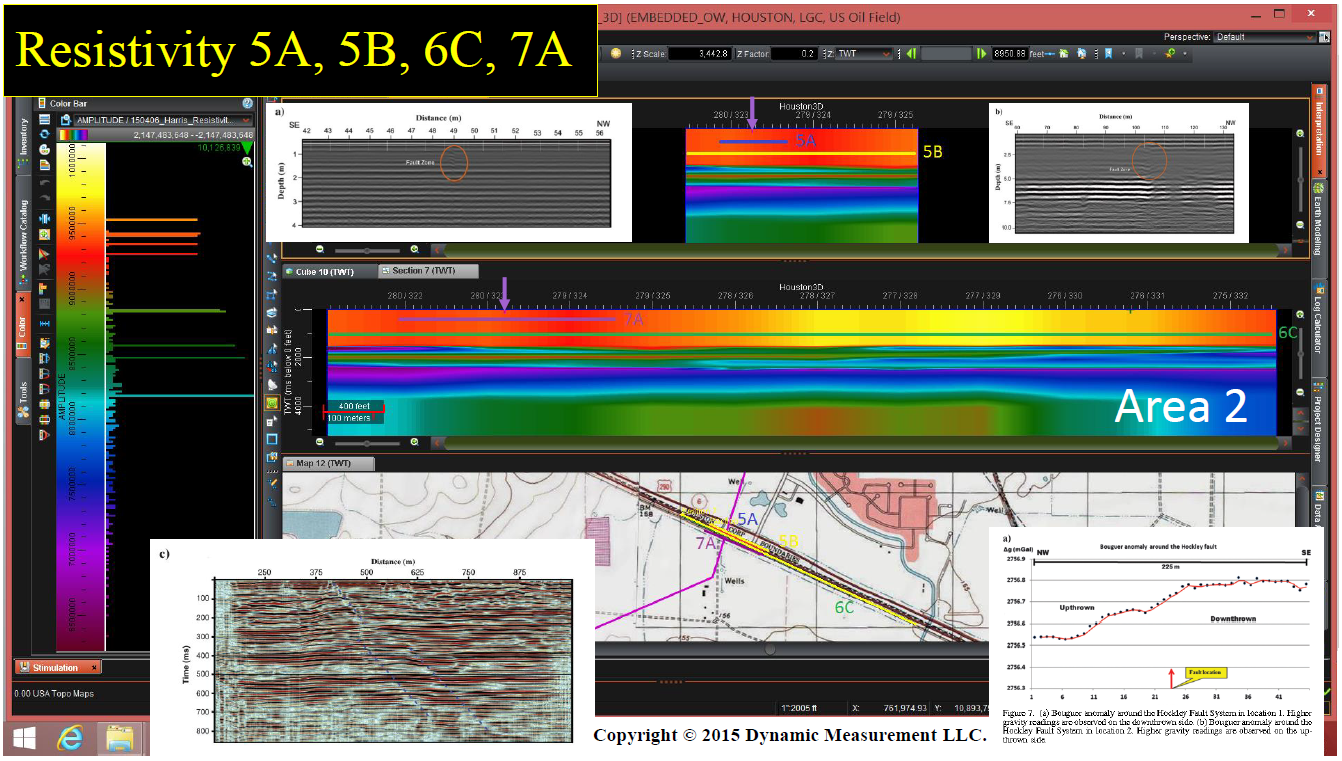
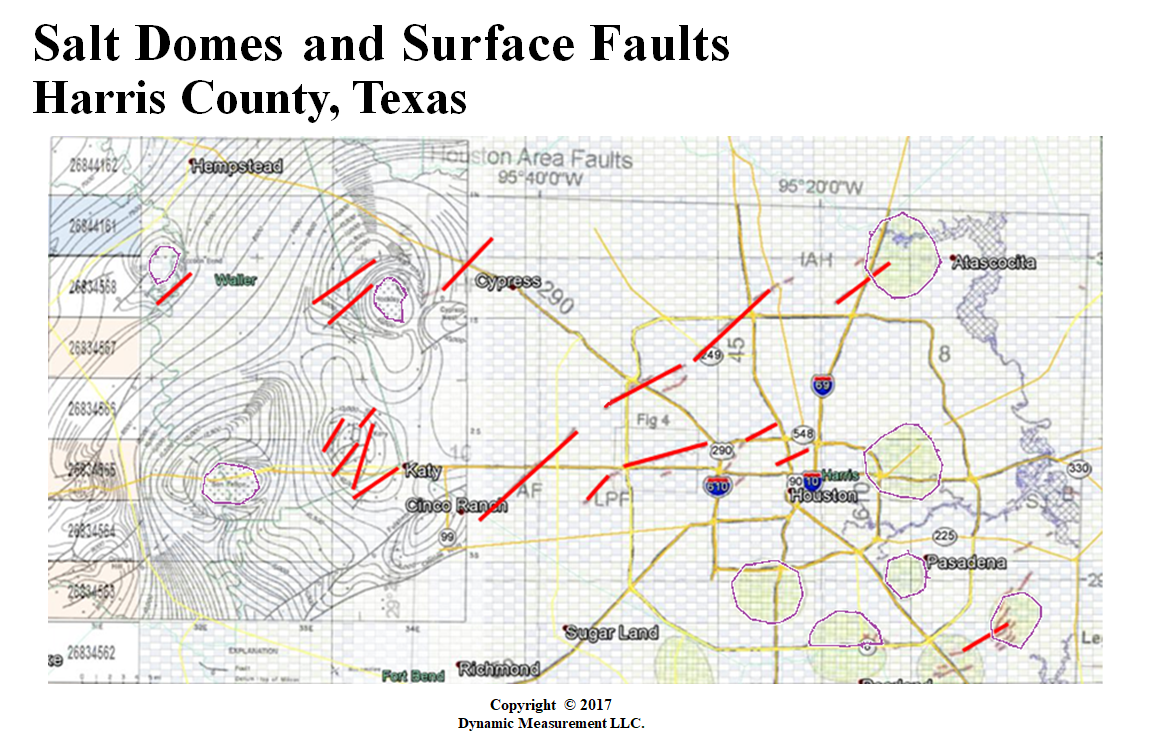
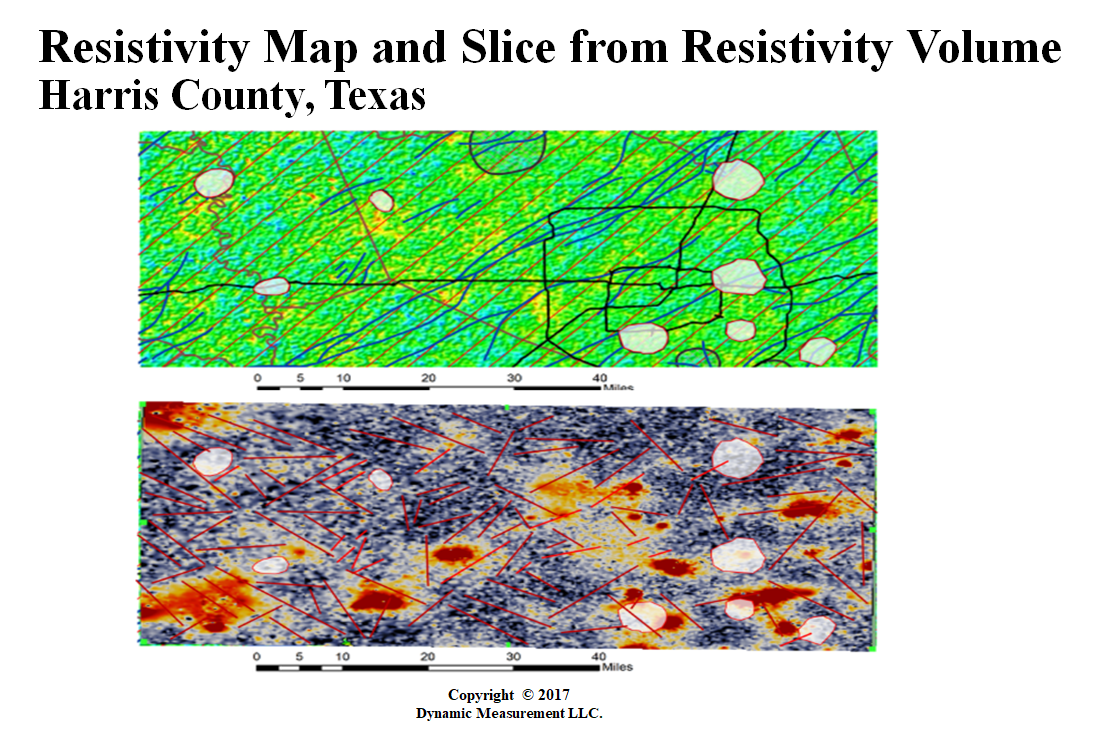
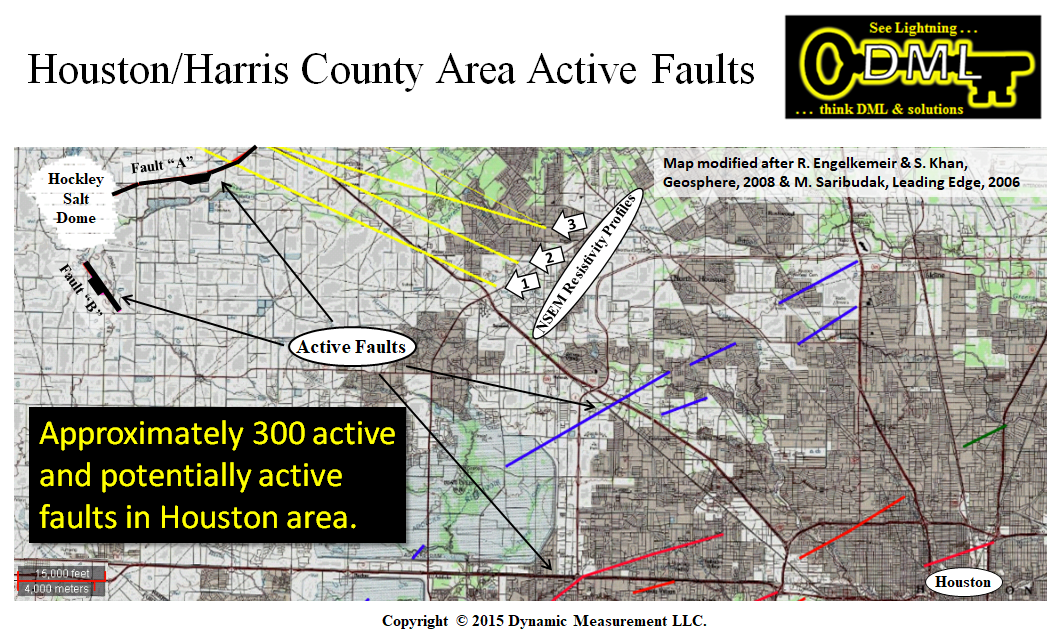
| Salt Domes & Surface Faults Harris County, TX | Resistivity Map and Slice, Harris County, TX |
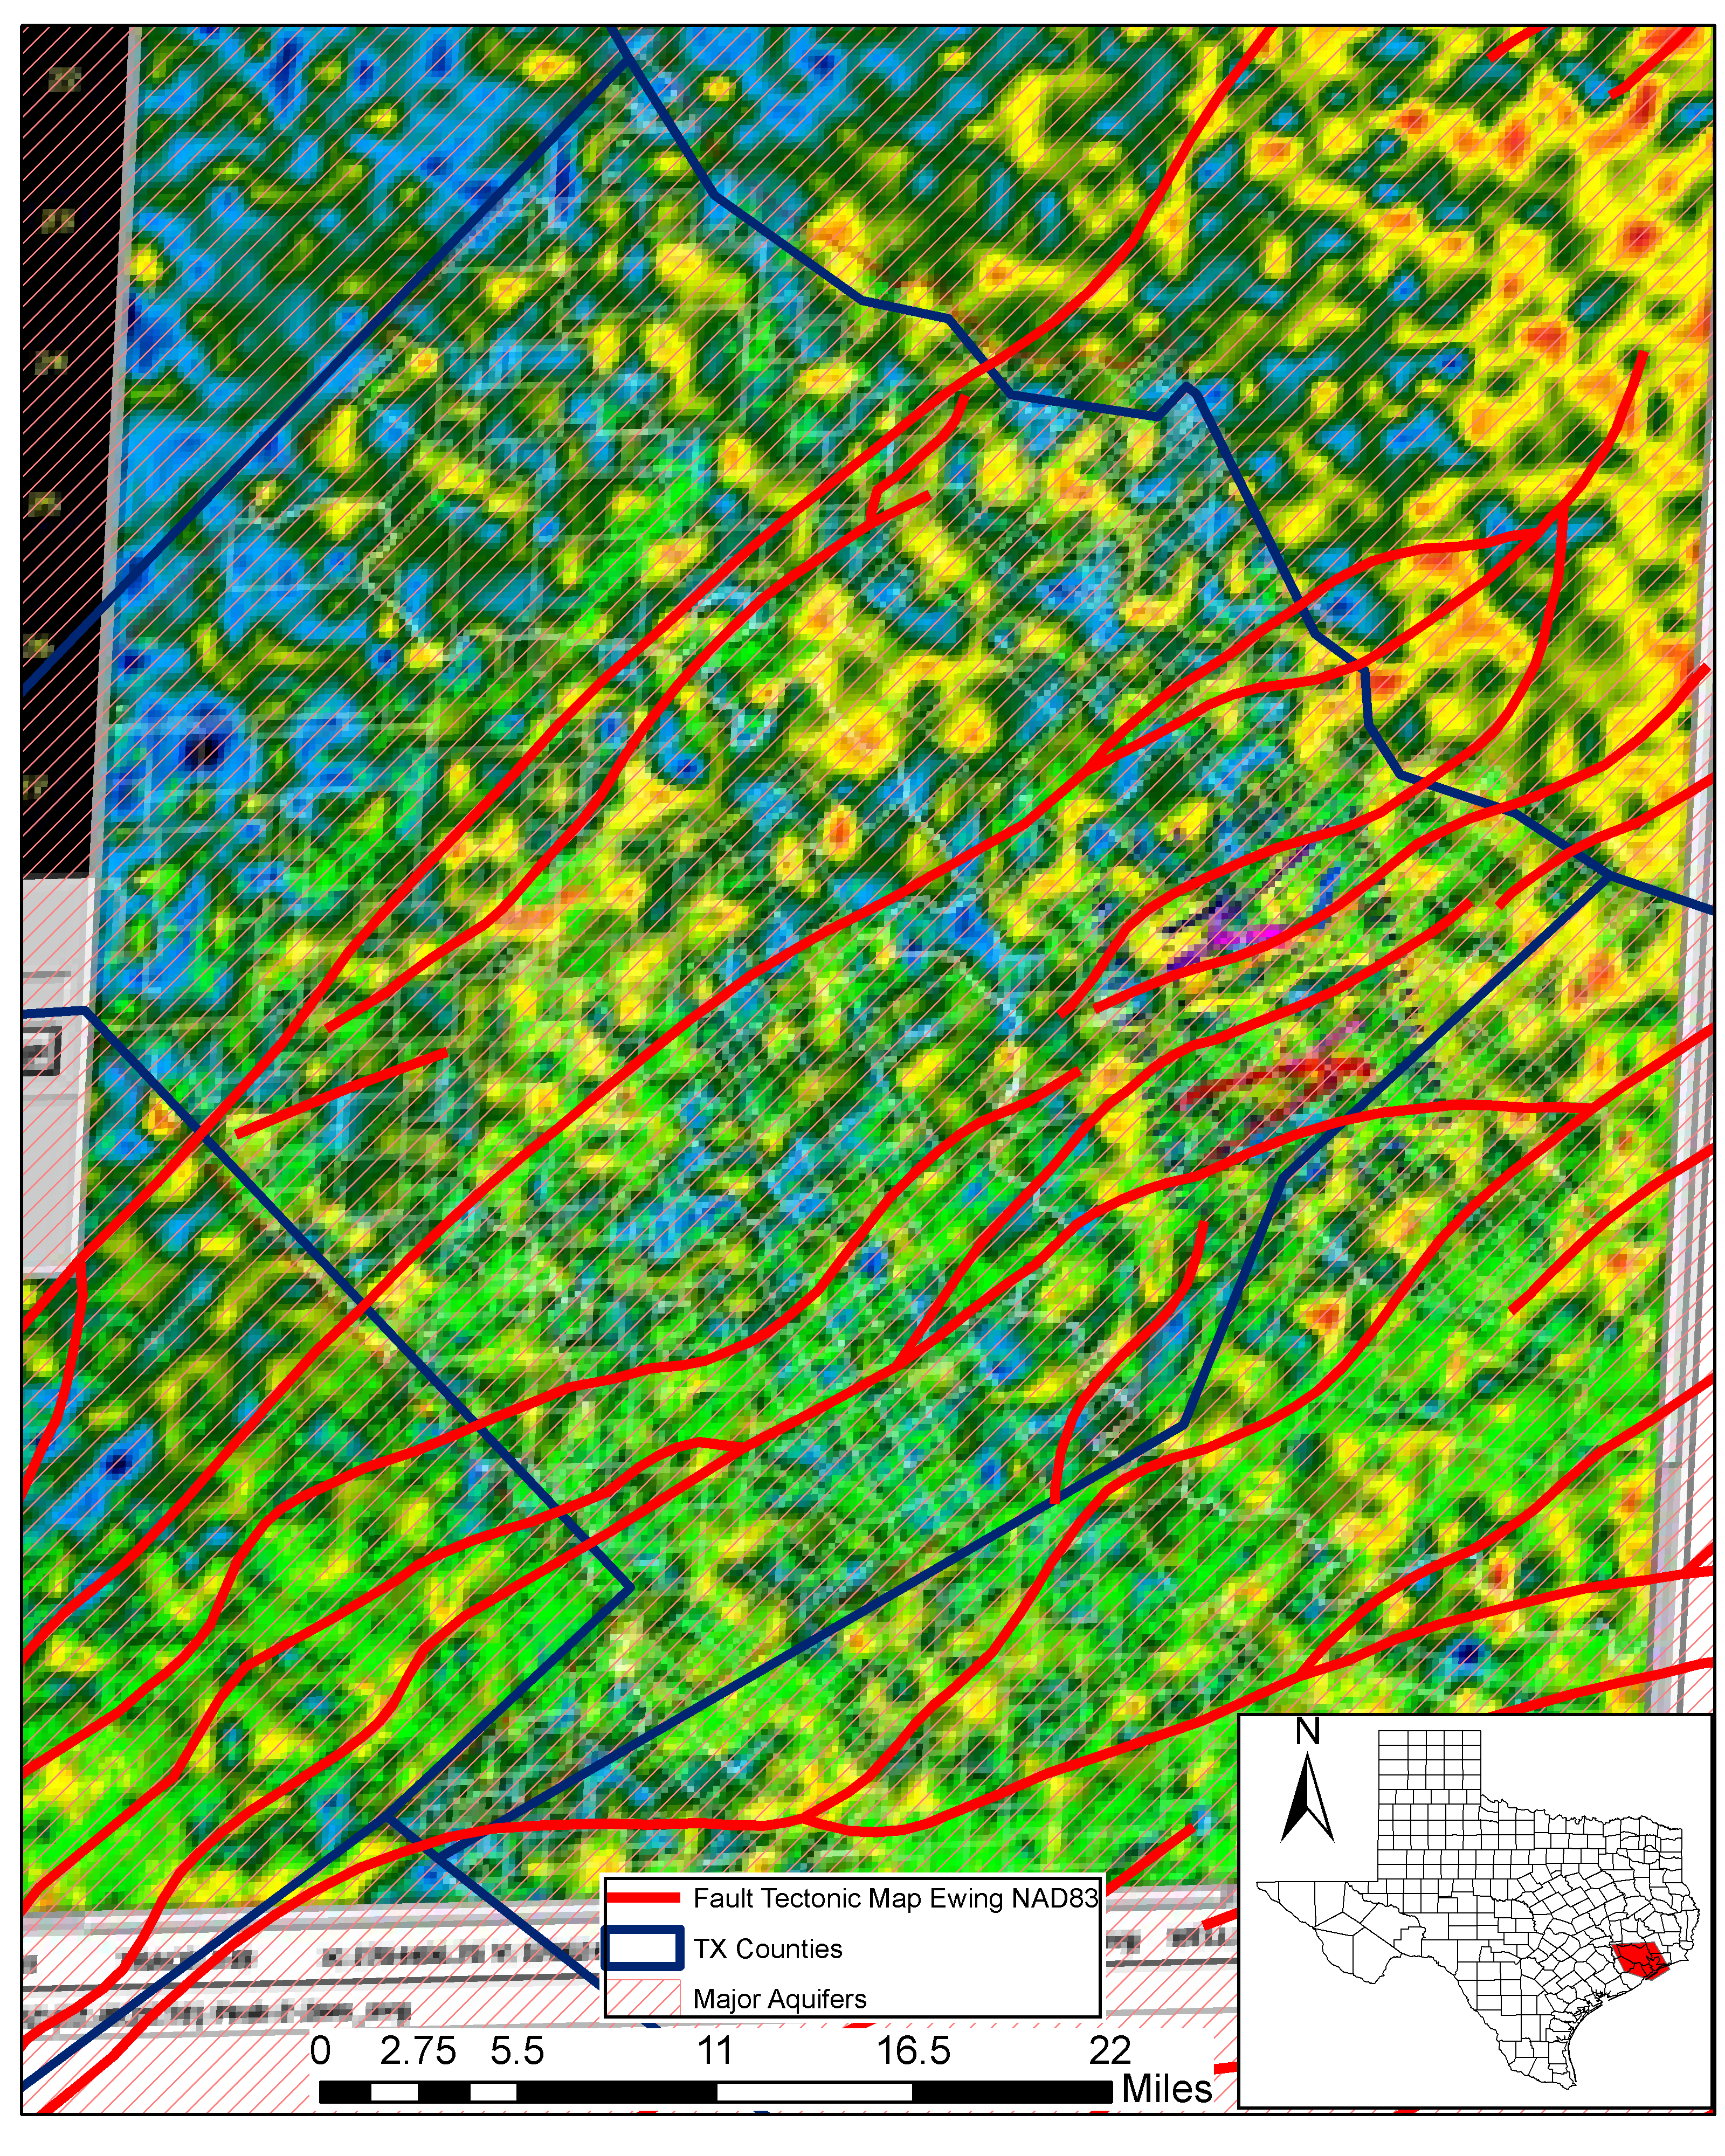
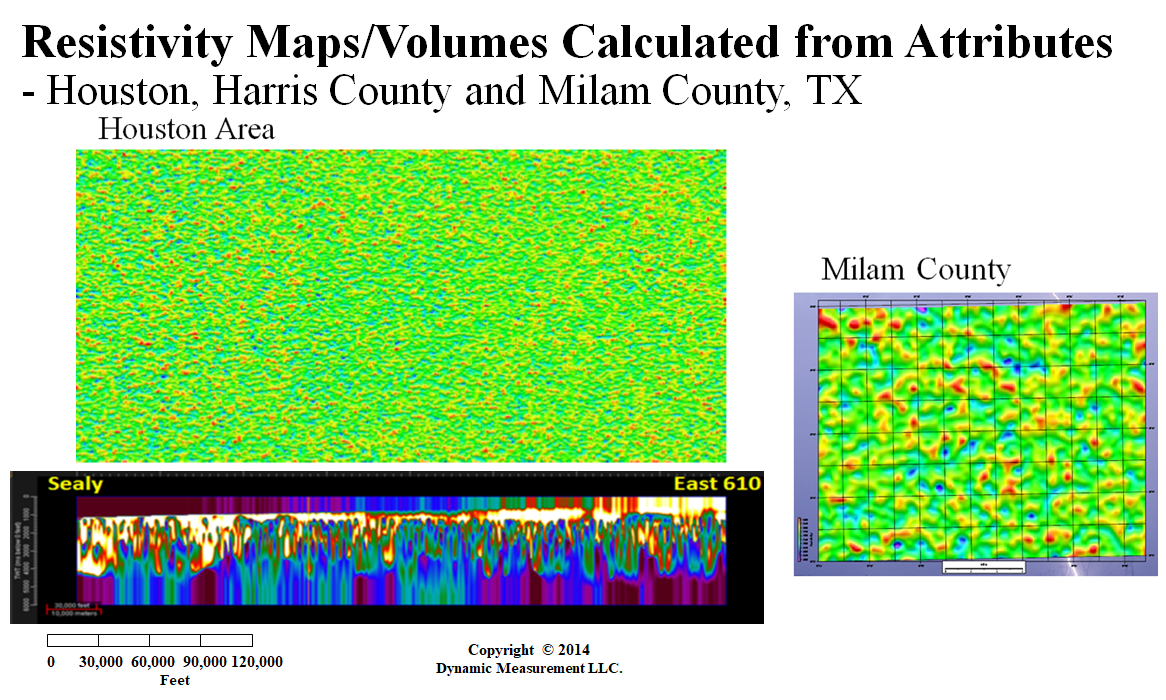
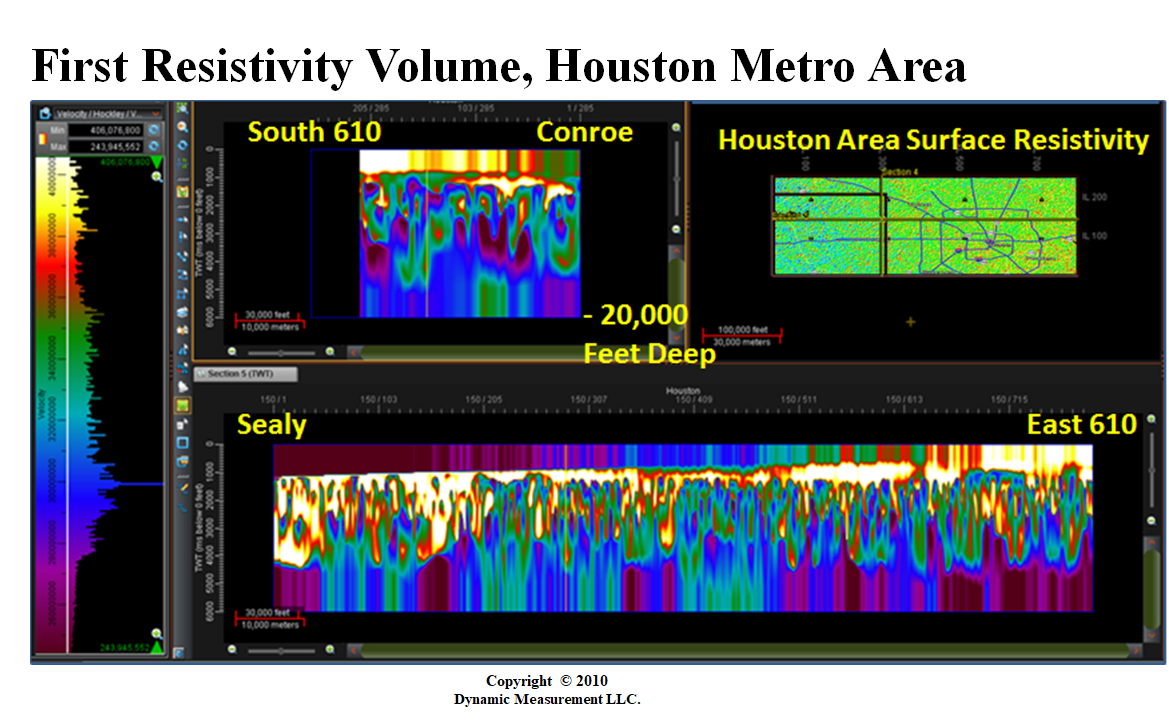
Resistivity Map & Section Harris & Map Milam Co. | Resistivity S-N & W-E Sections & Map Houston, Tx |
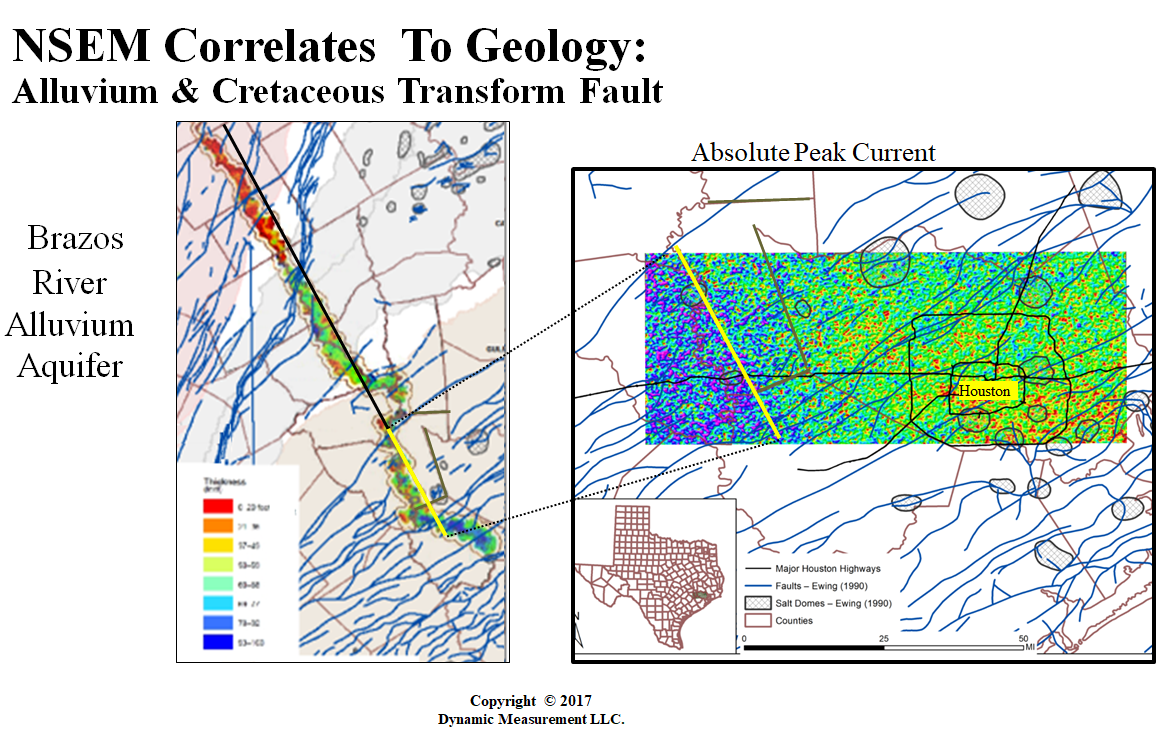
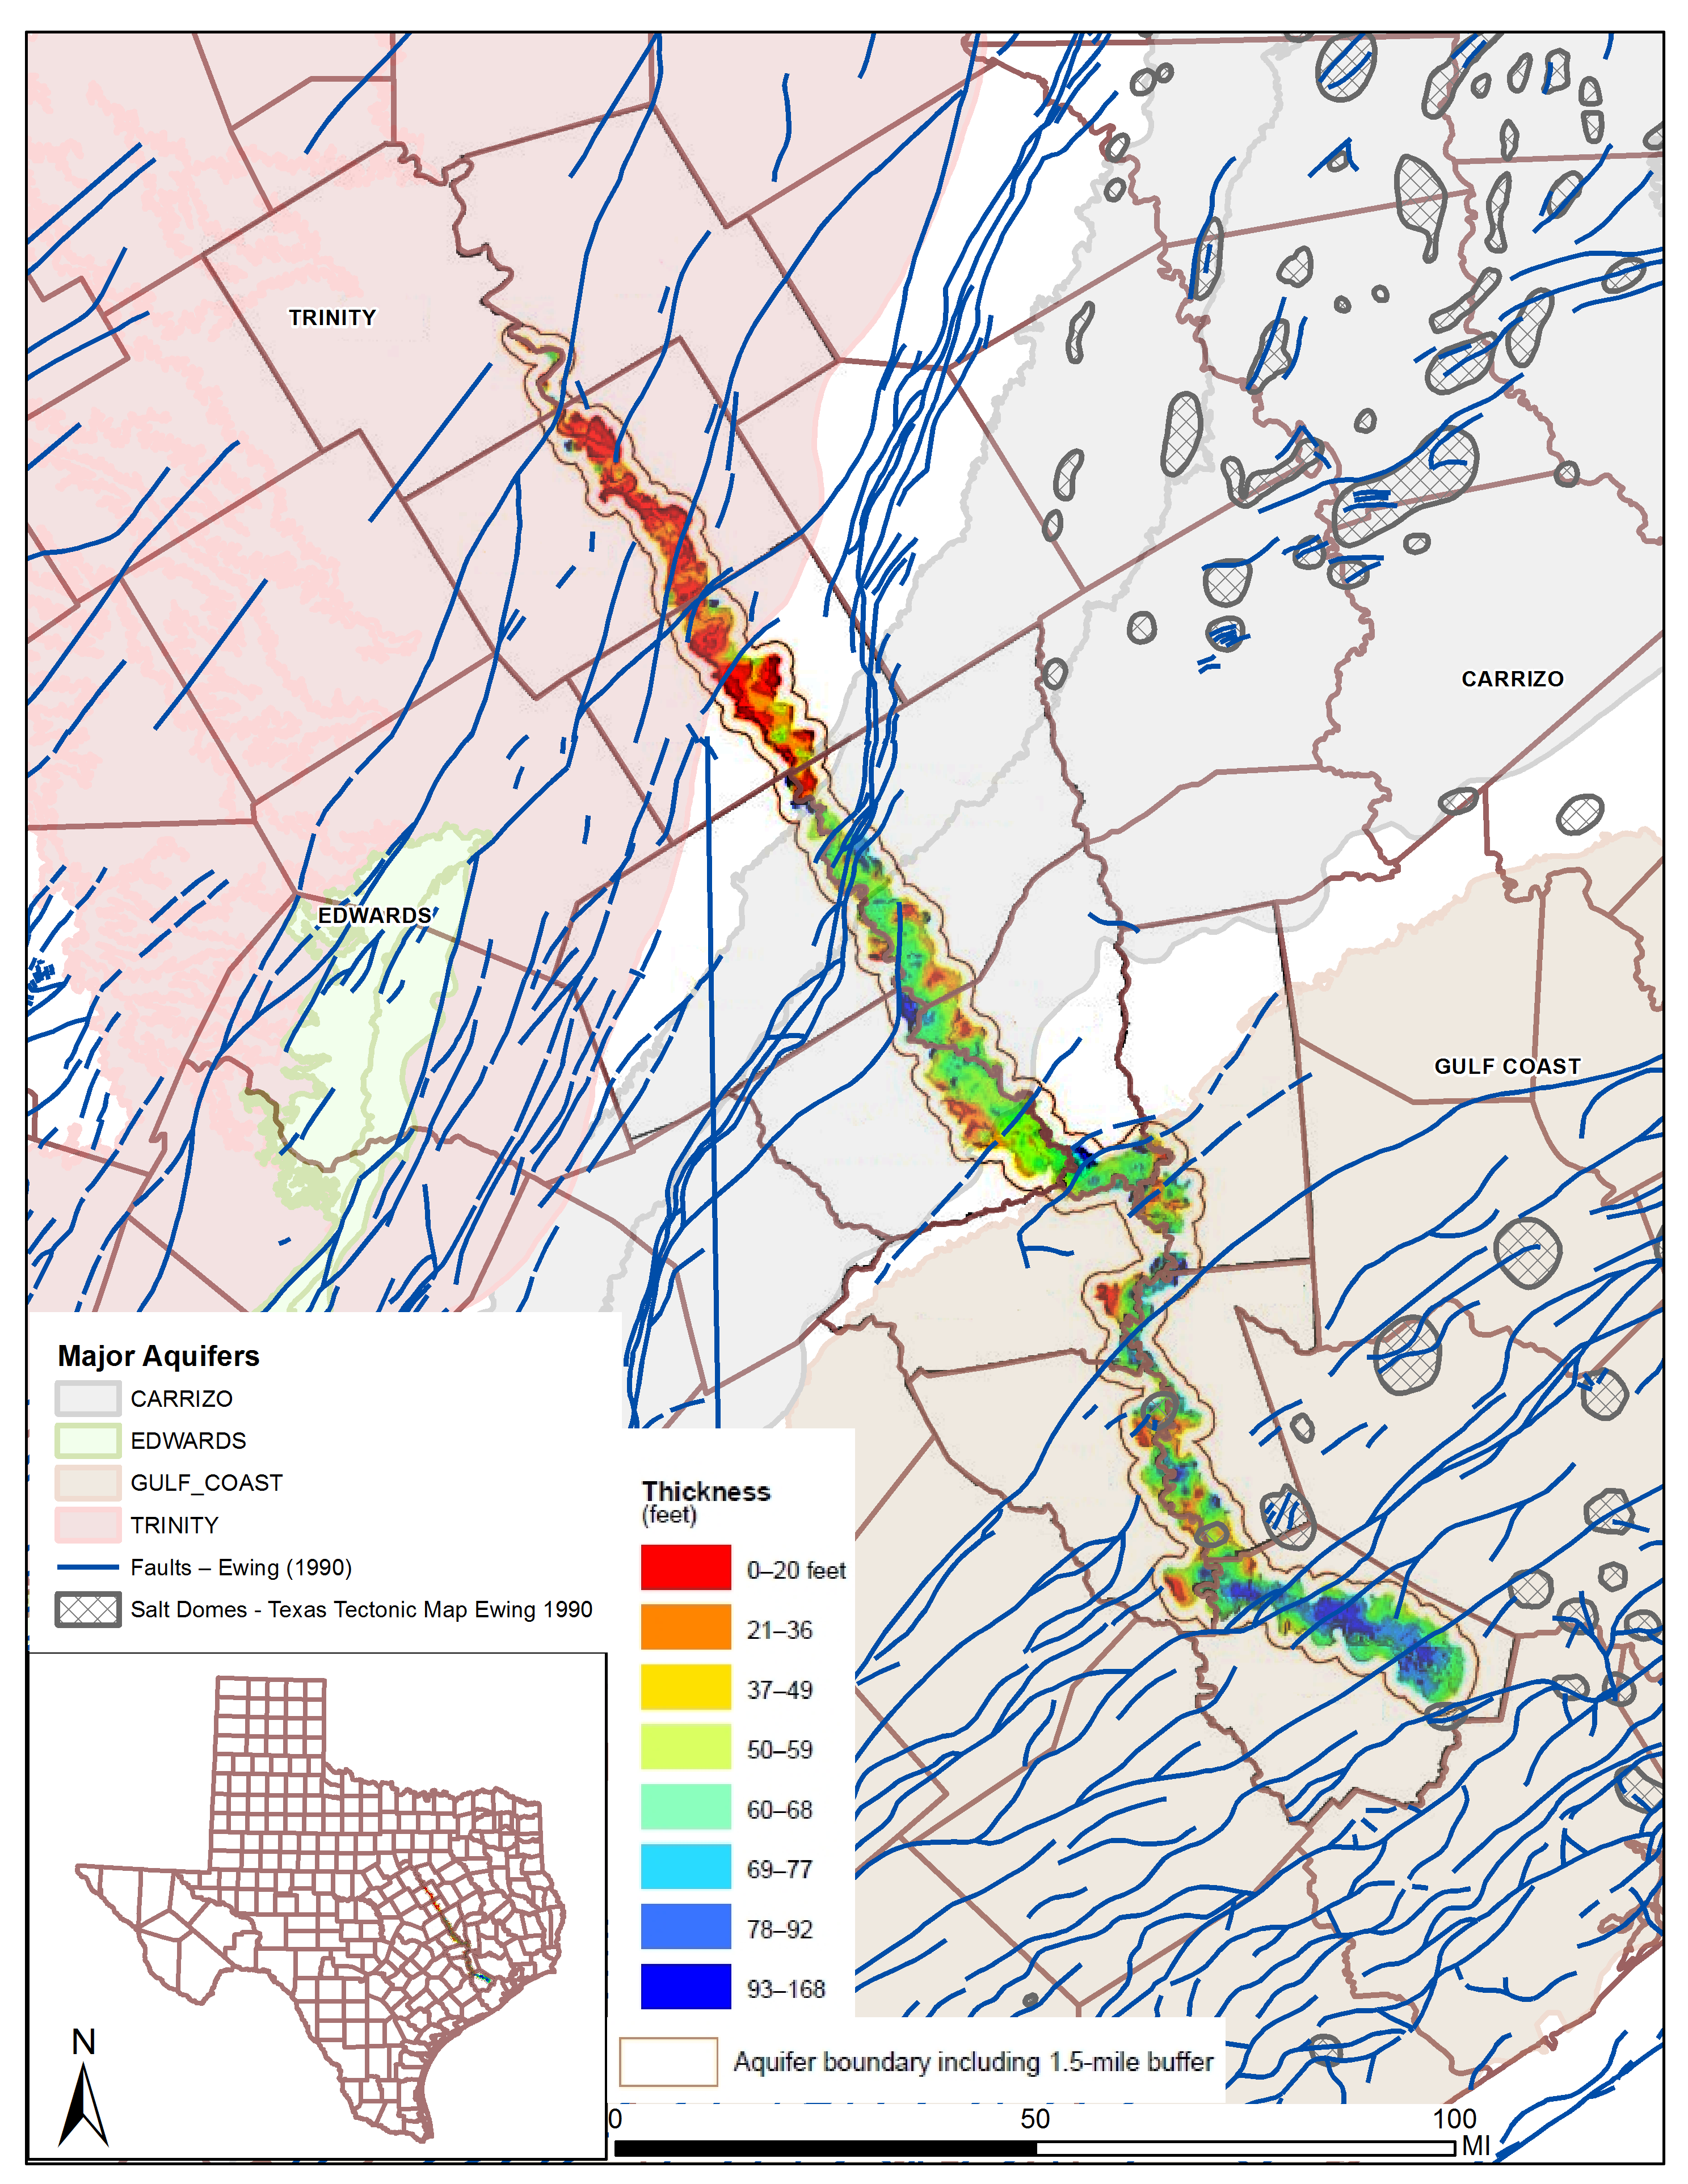
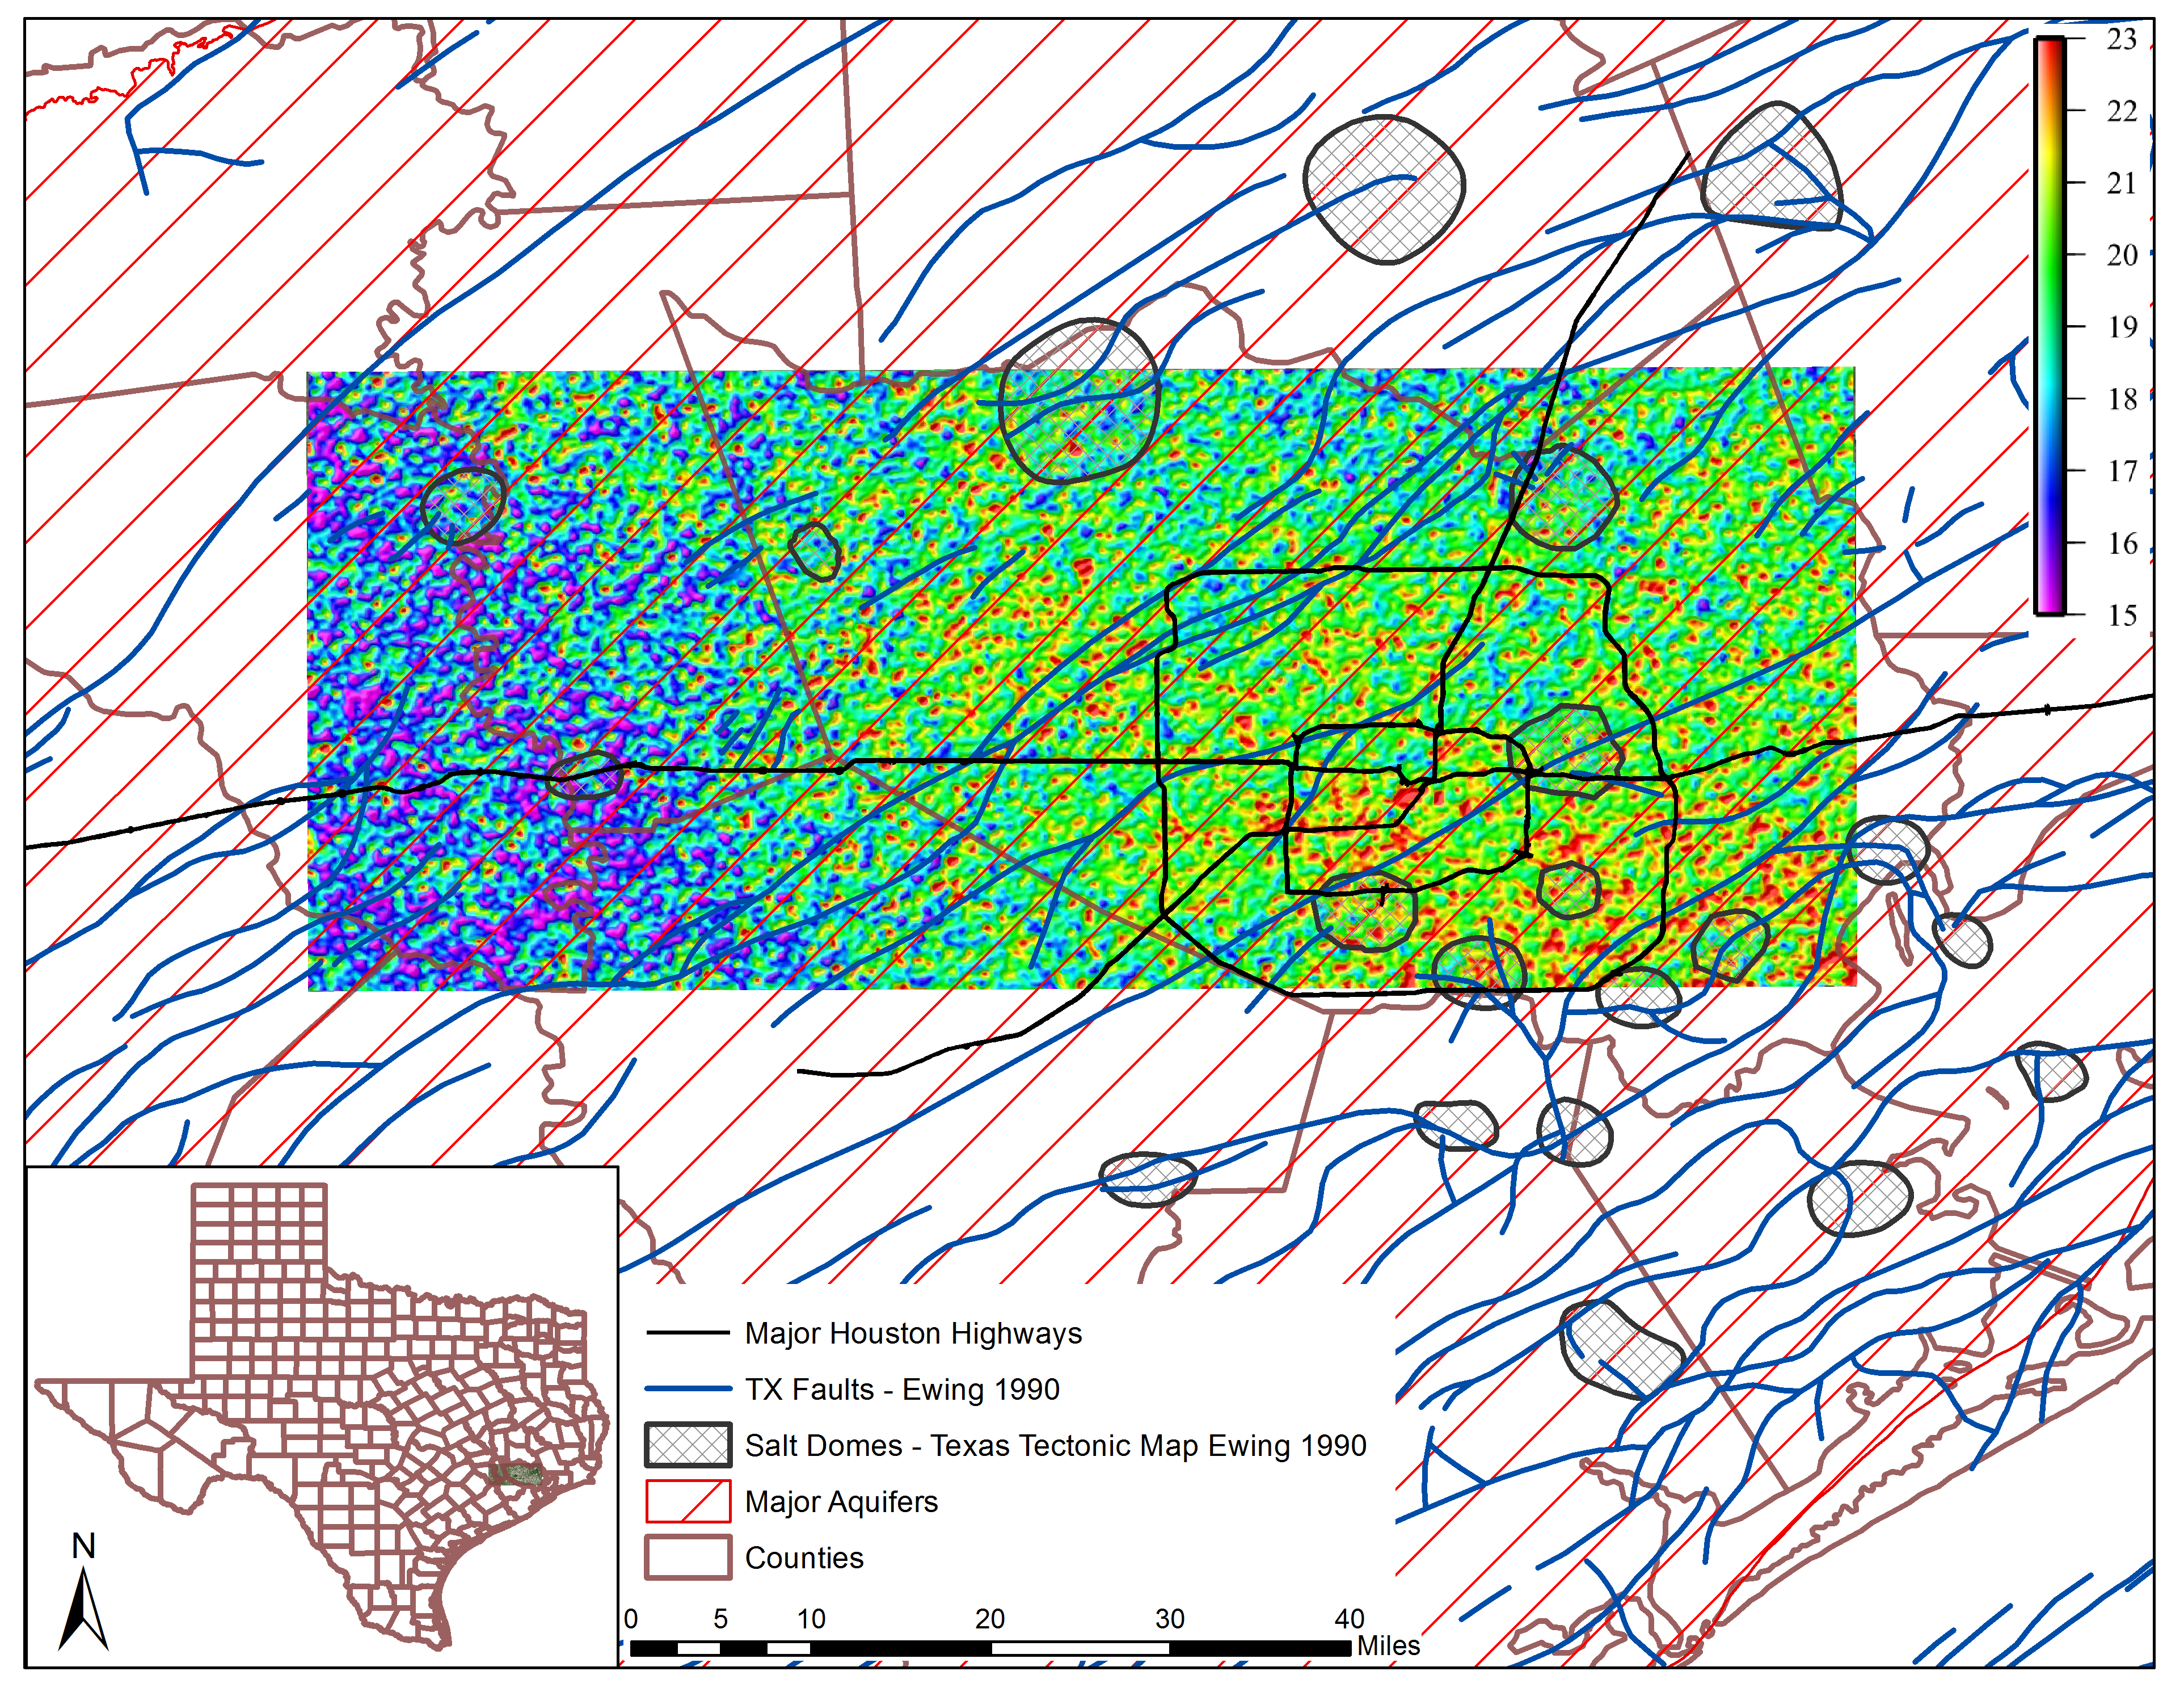
Brazos River Alluvium Aquifer & Peak Current | Brazos River Alluvium Aquifer, South Texas |
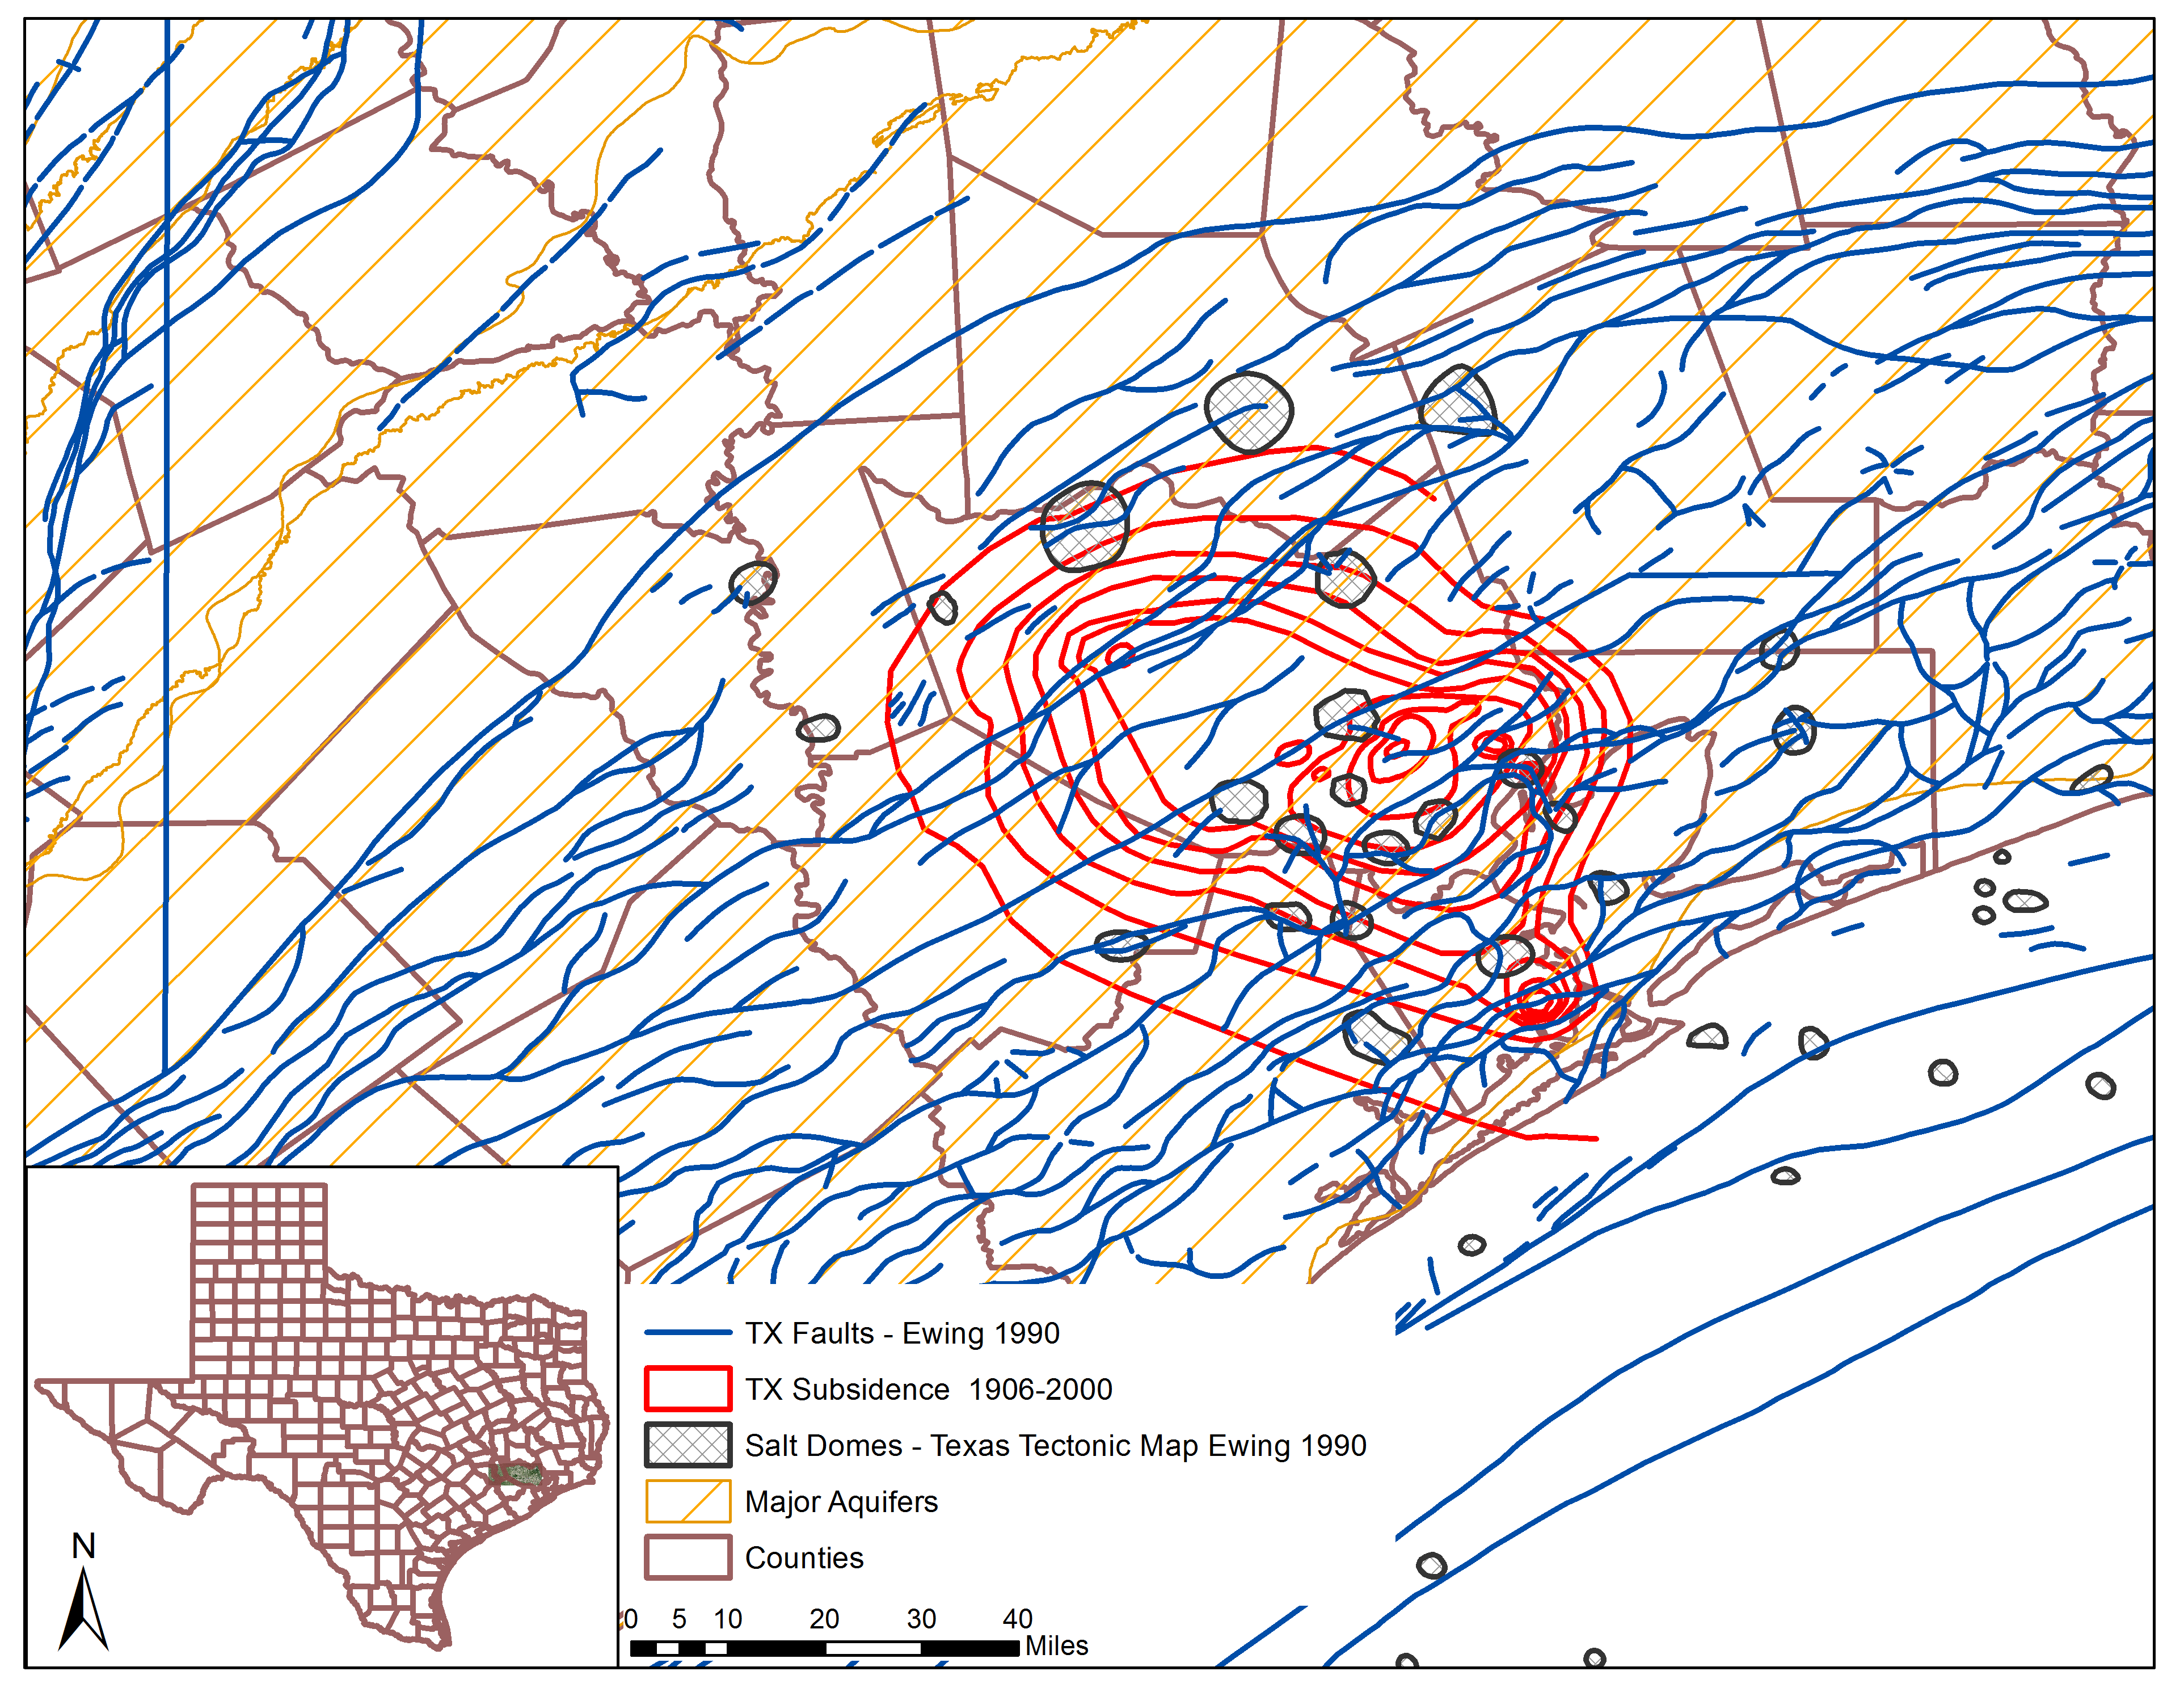
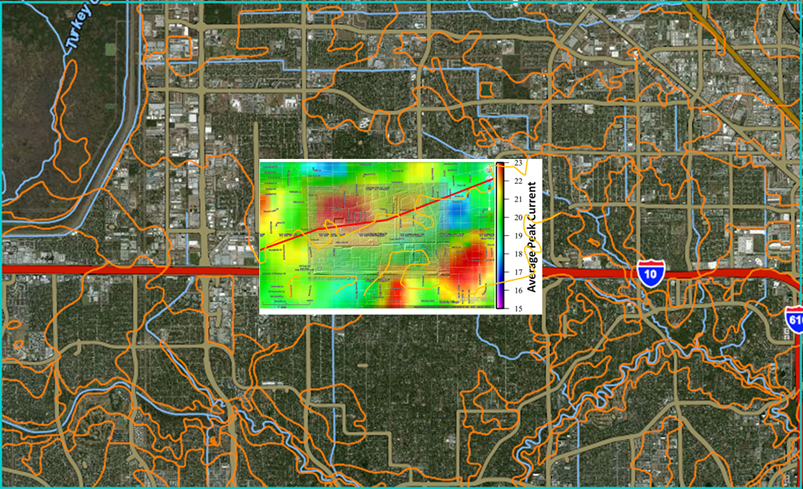
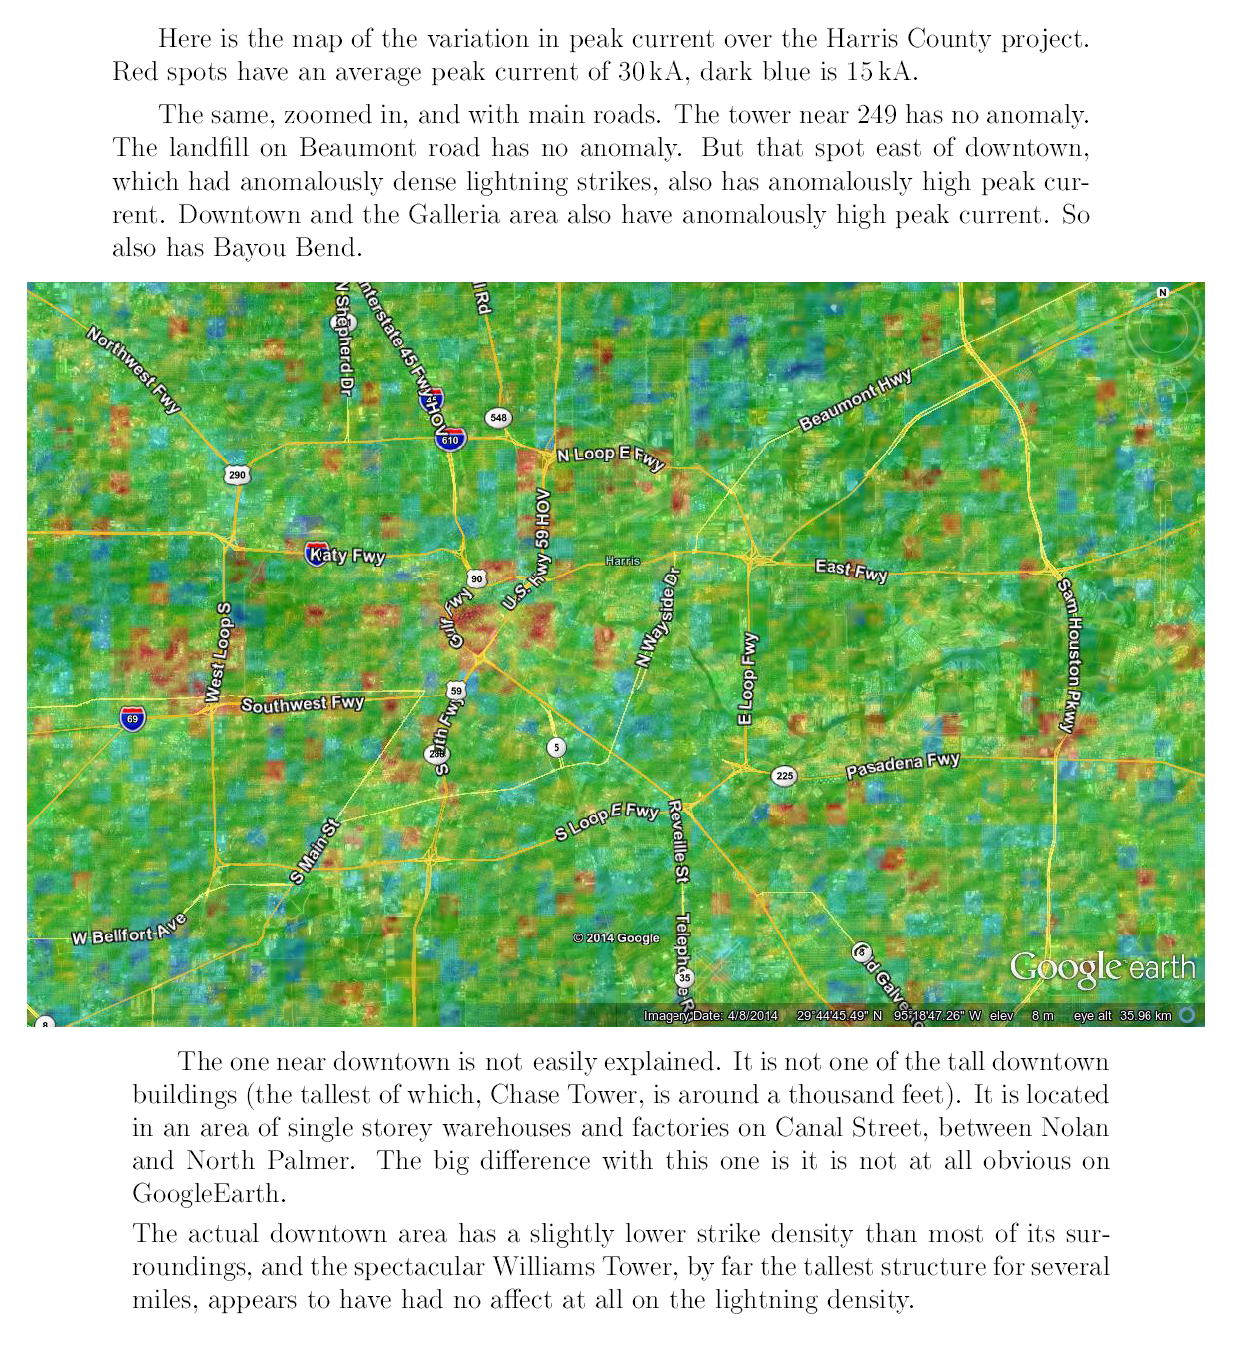
Average Peak Current Houston Texas Area | Subsidence and Surface Faults Houston TX Area |
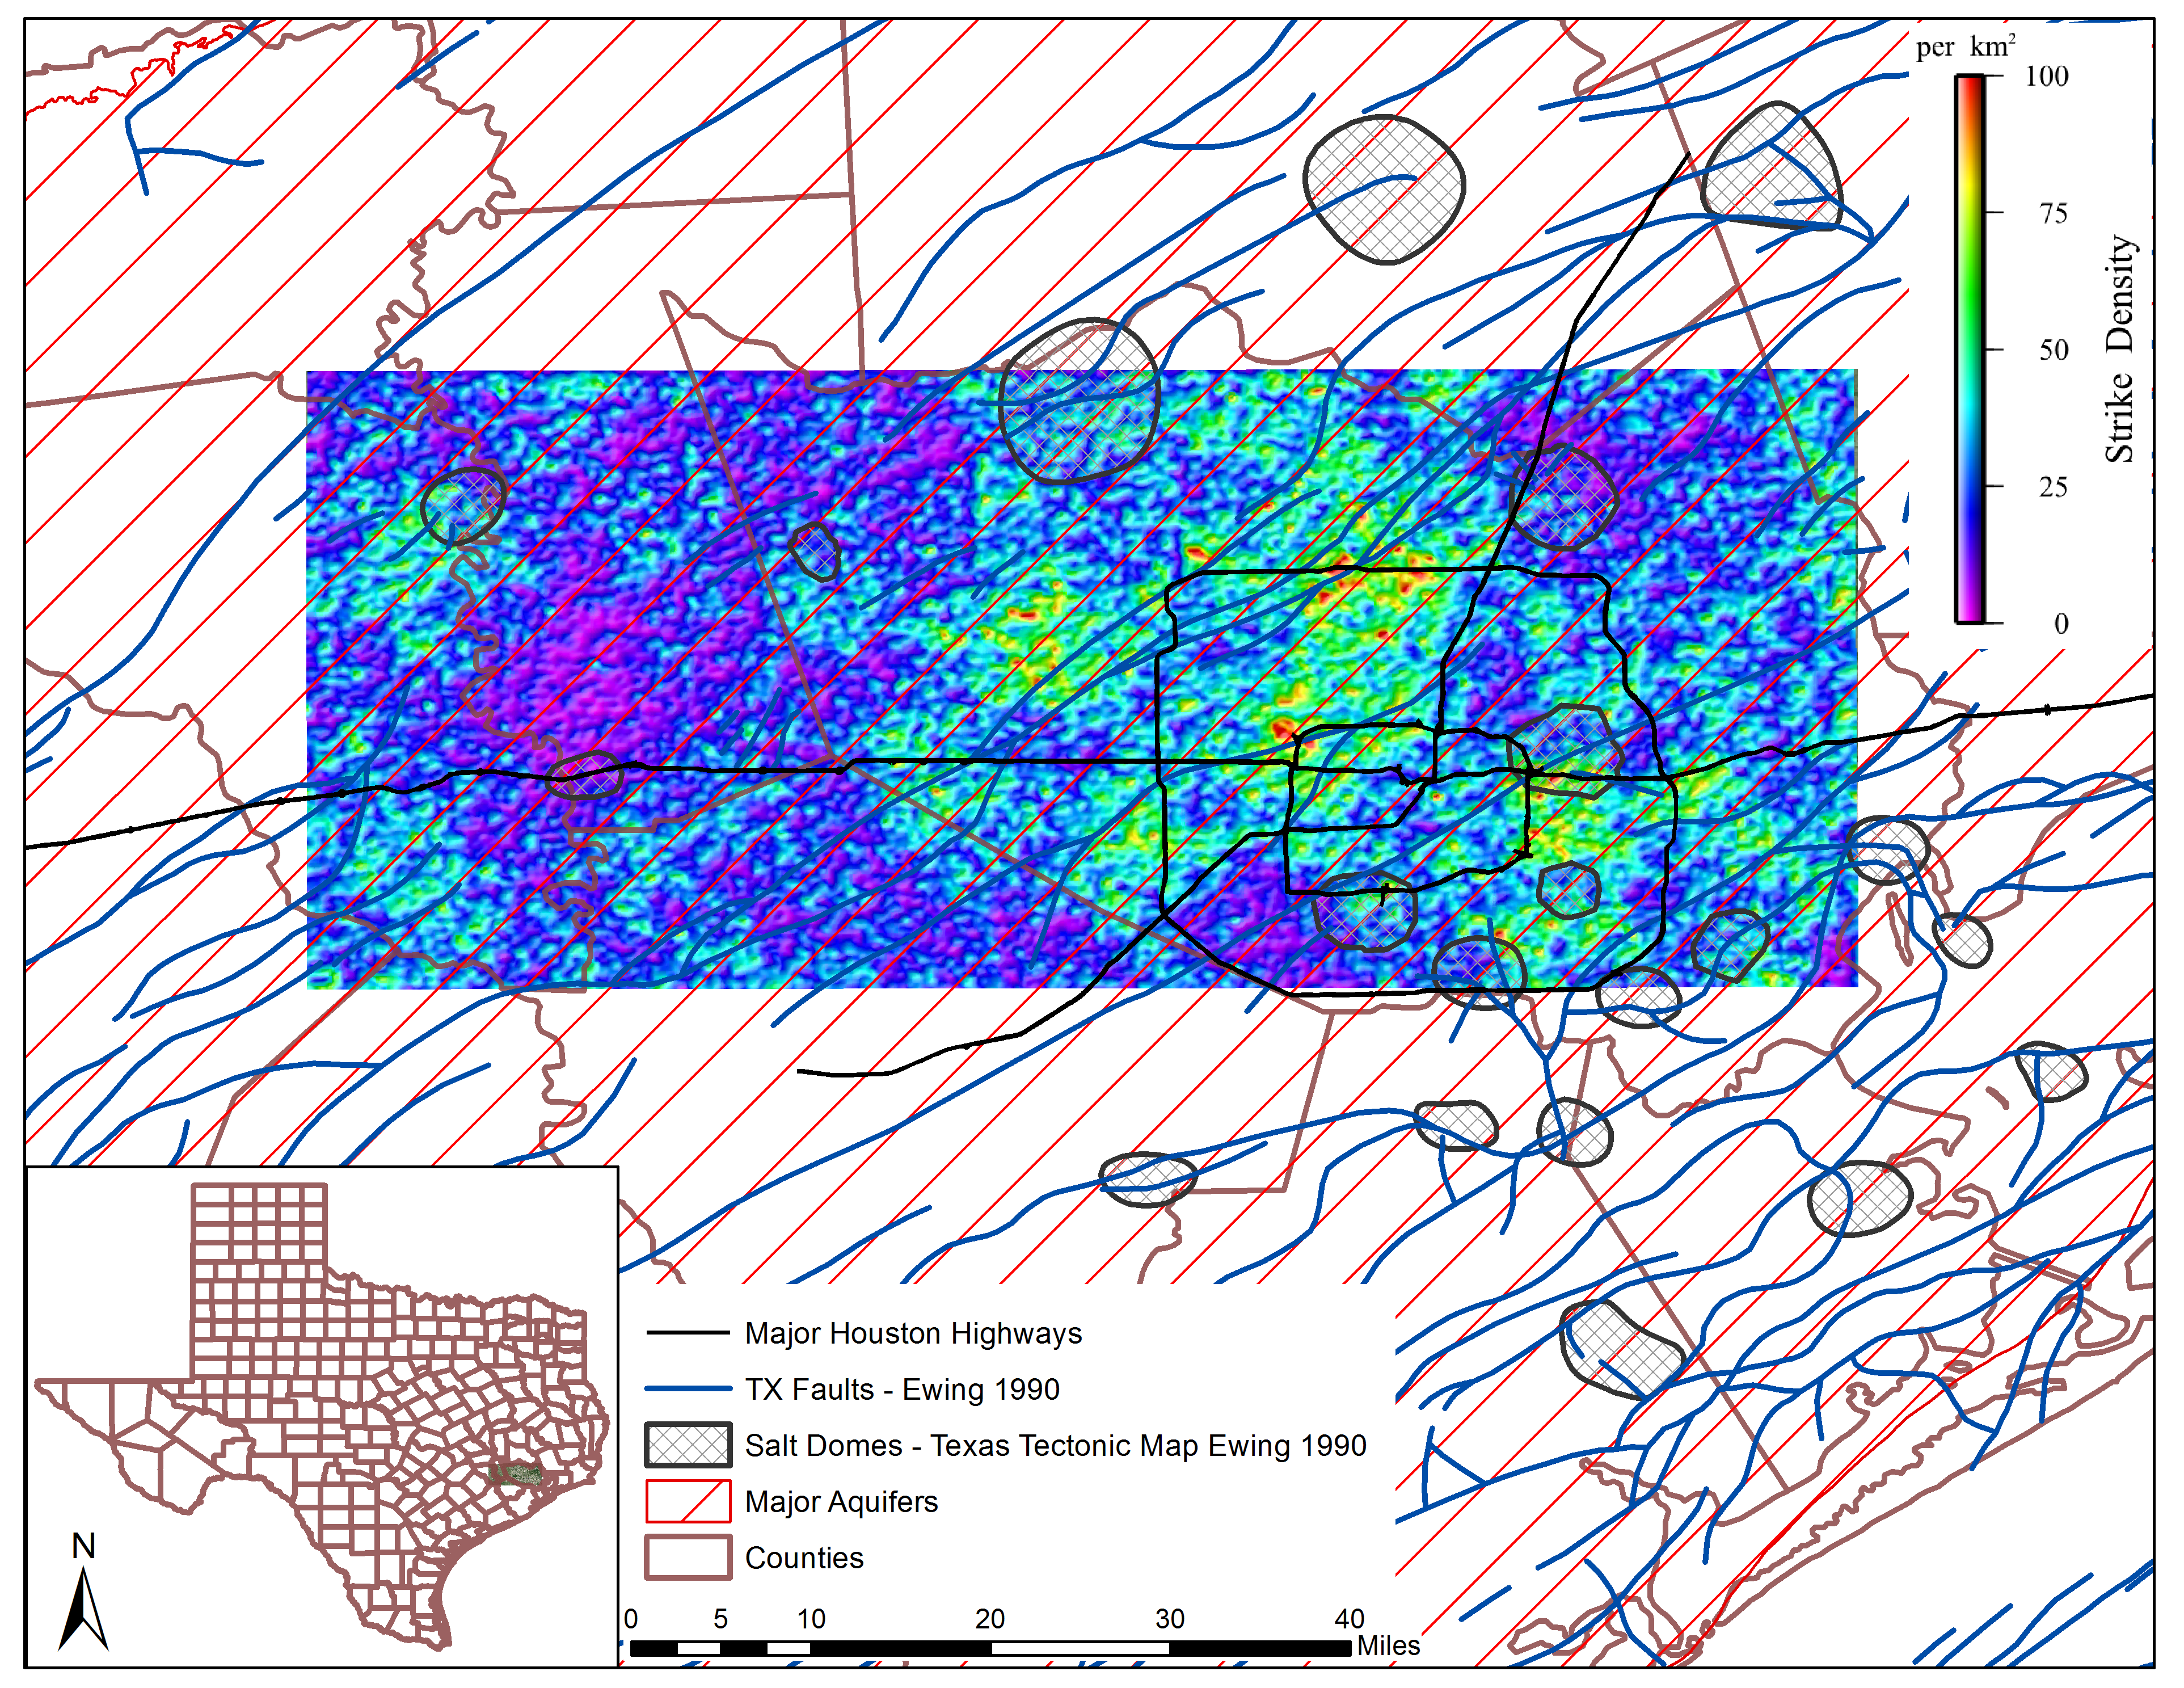
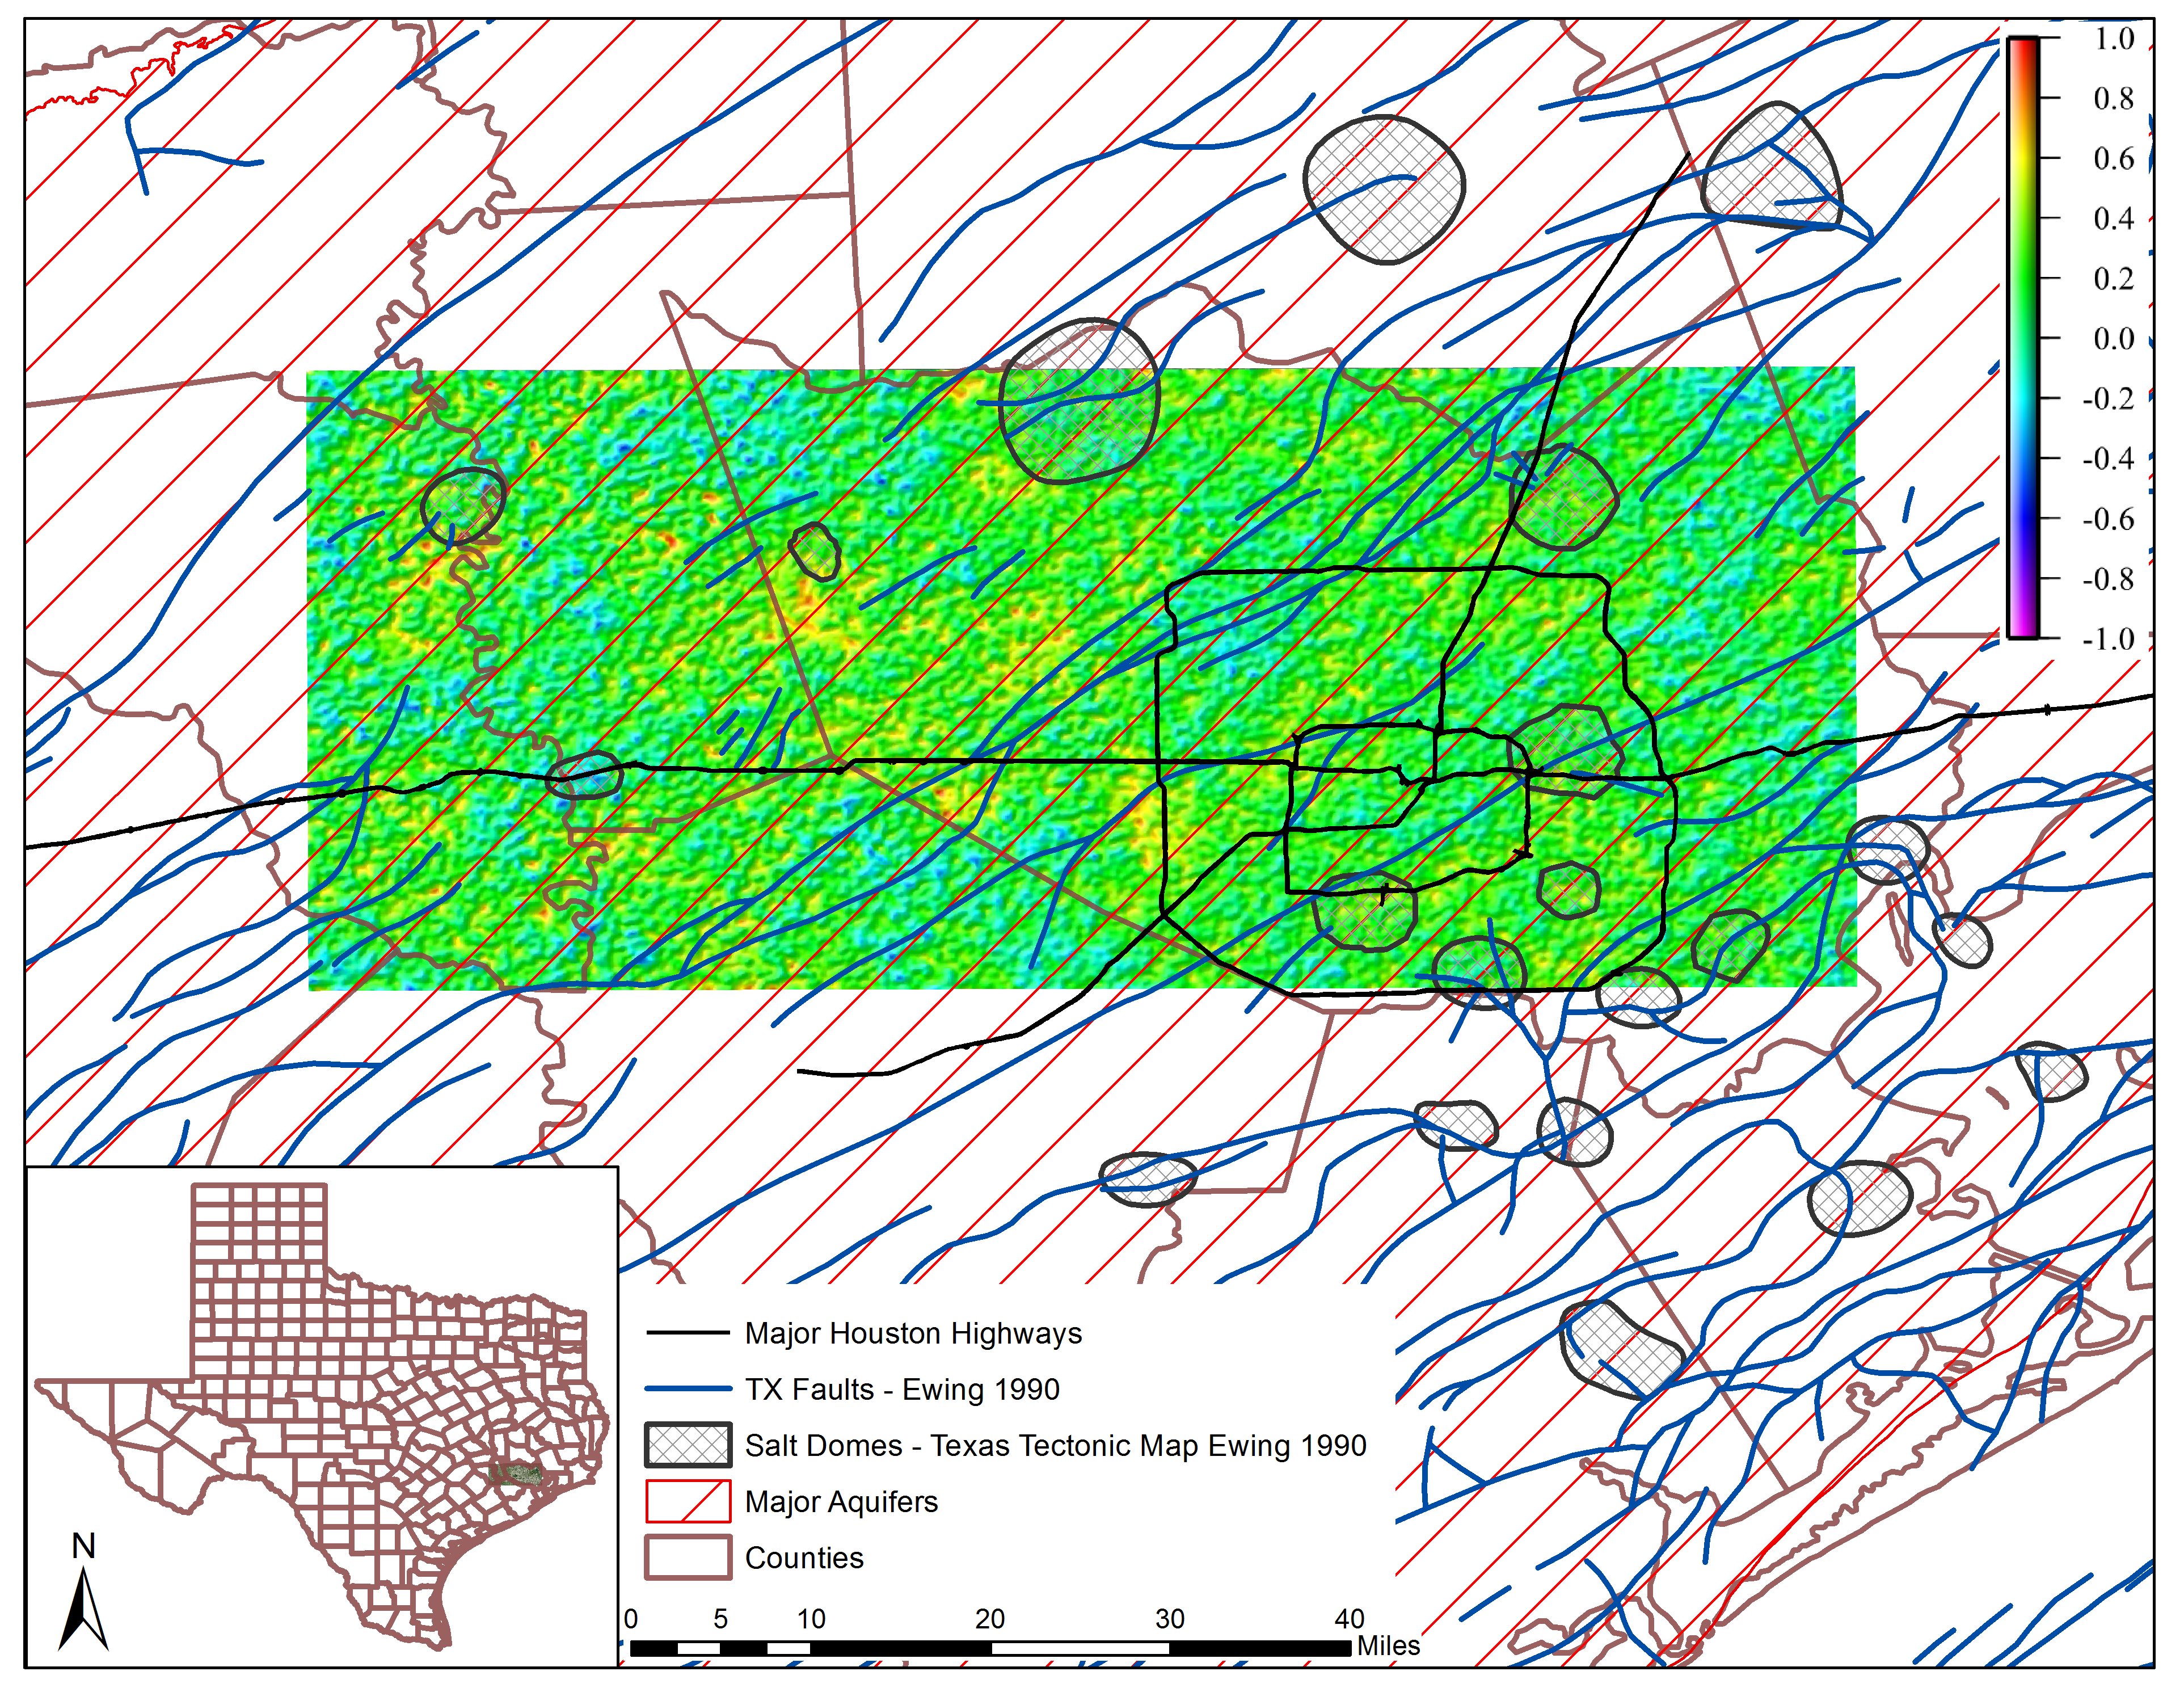
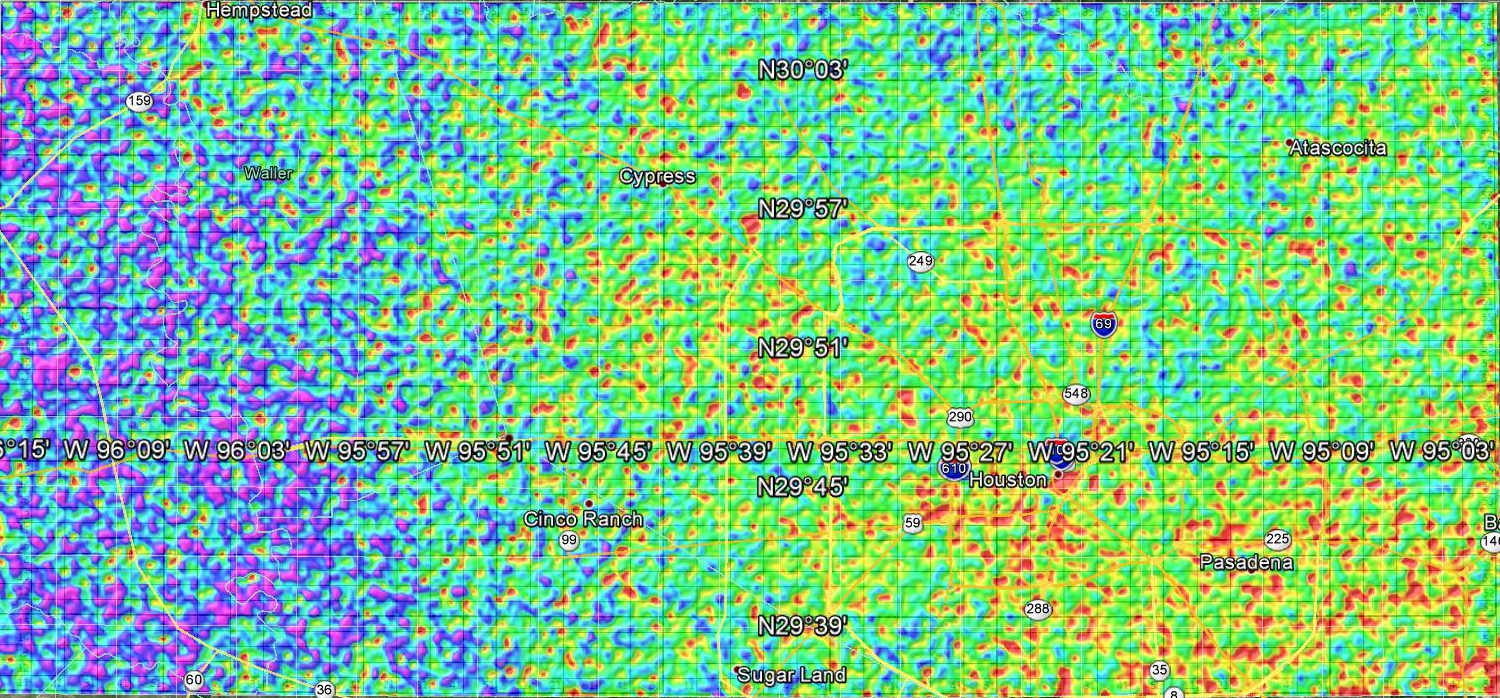
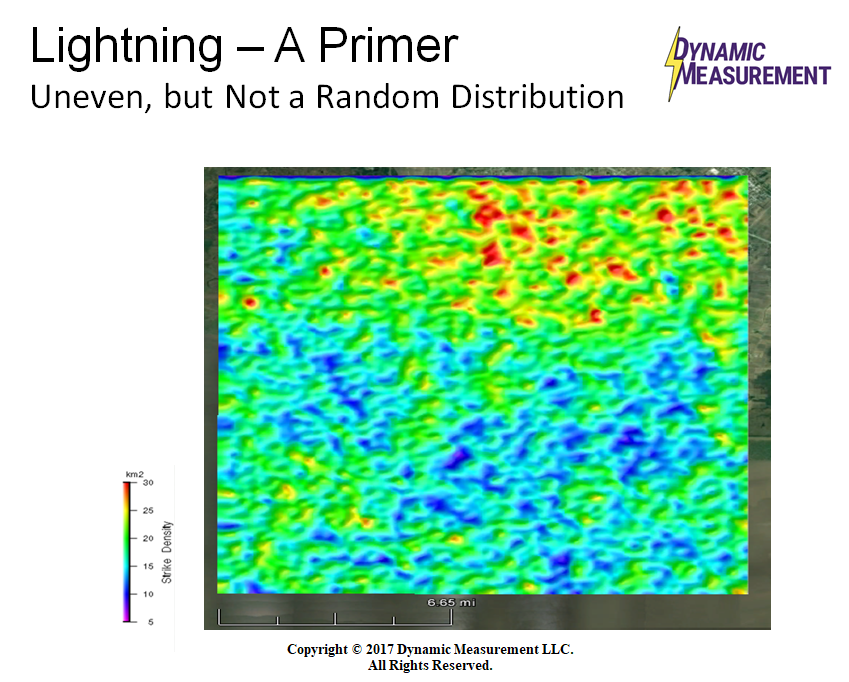
Strike Density Houston Texas Area | Strikes at Gradient of High Tide Houston Area |
 |  |
 |  |
 |  |
 |  |
 |  |
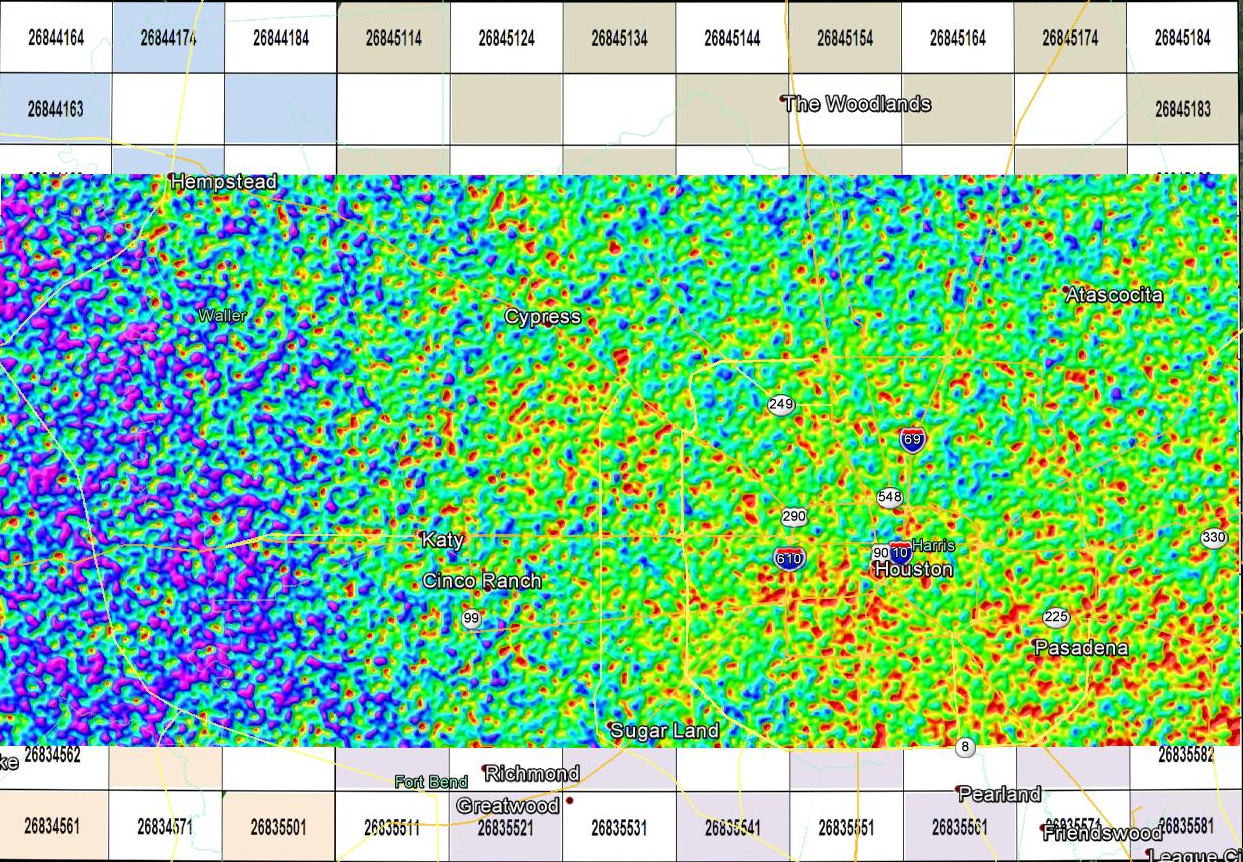
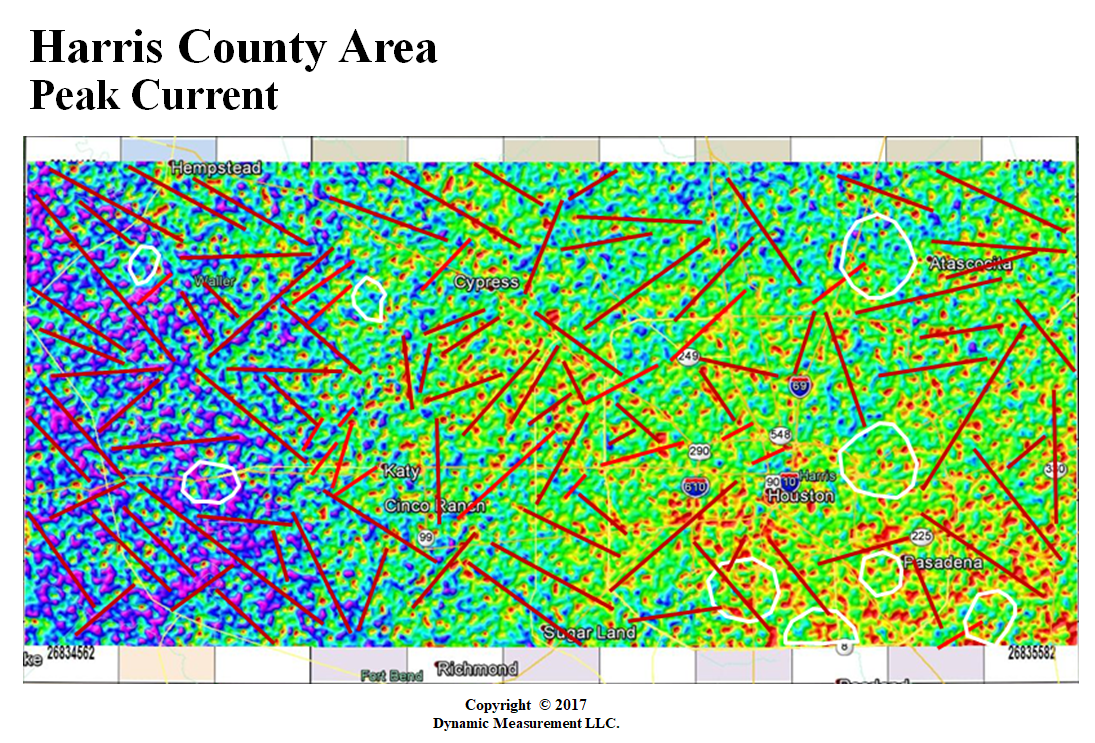
| Peak Current with GoogleEarth Culture Houston | Peak Current with IG Background Houston Area |
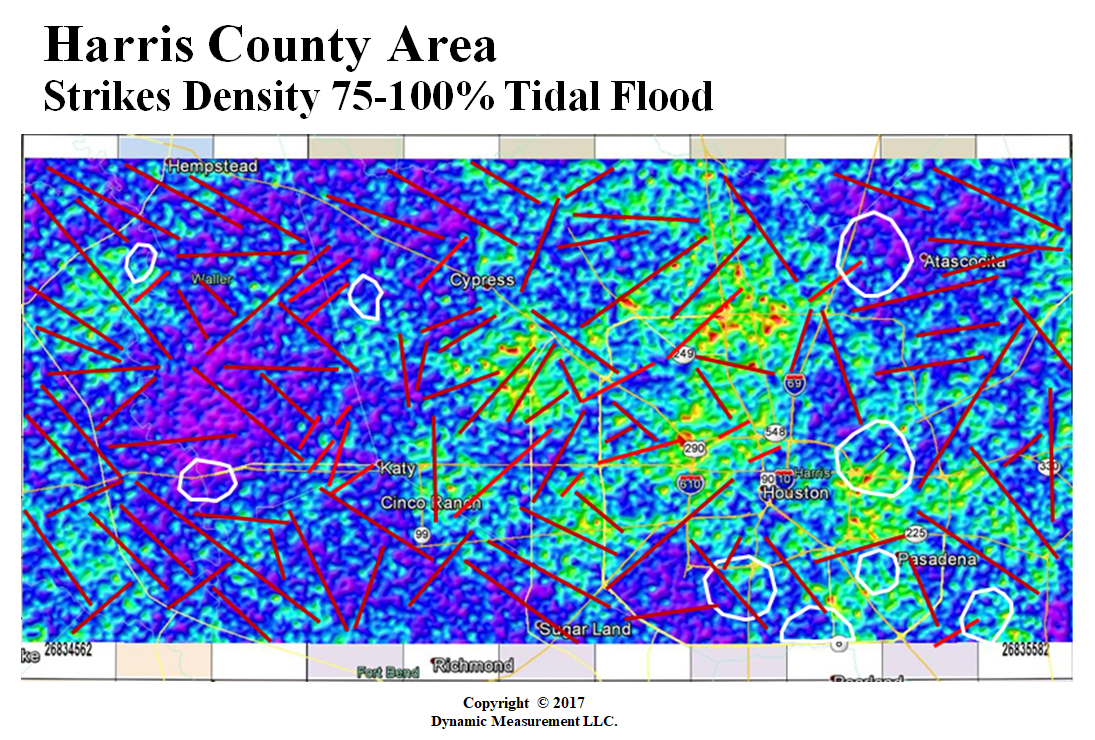
Strike Density 75-100% Tidal Flood + Faults Houston | Peak Current Interpretation of Fault Houston |
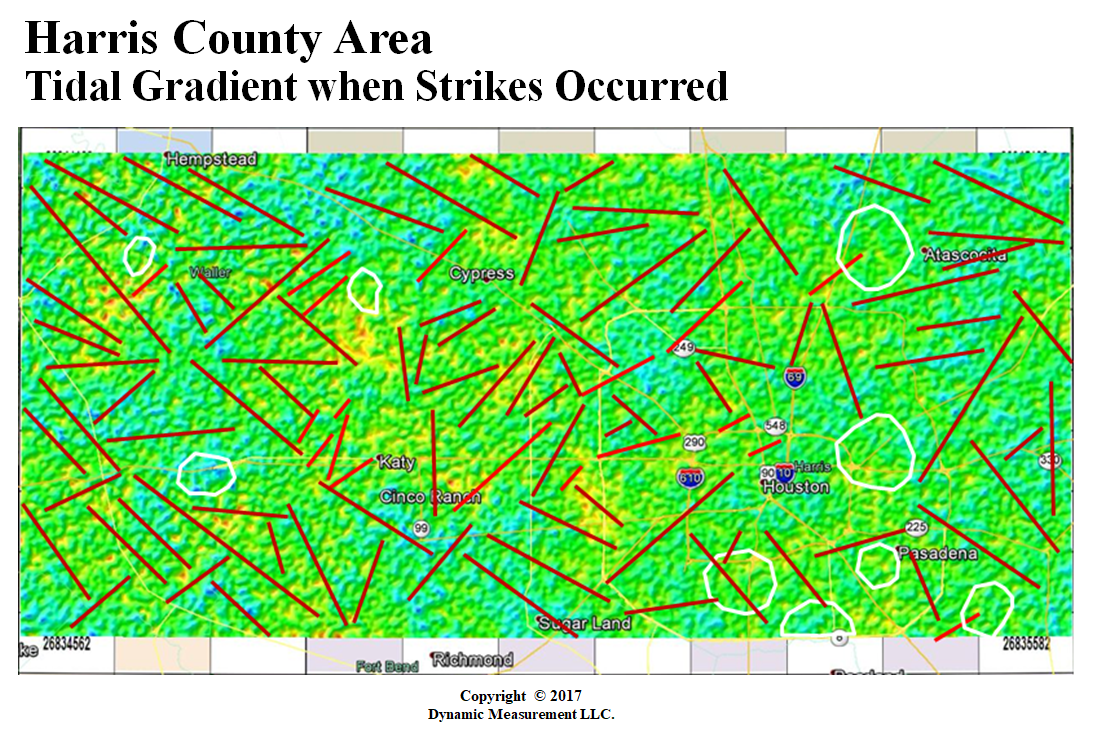
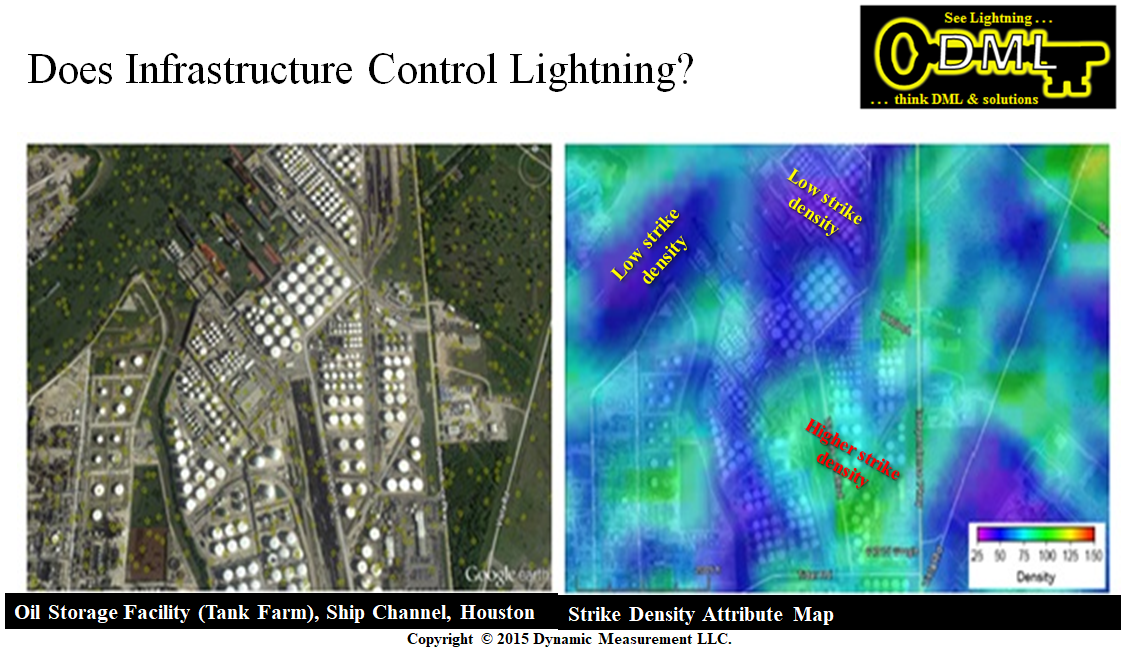
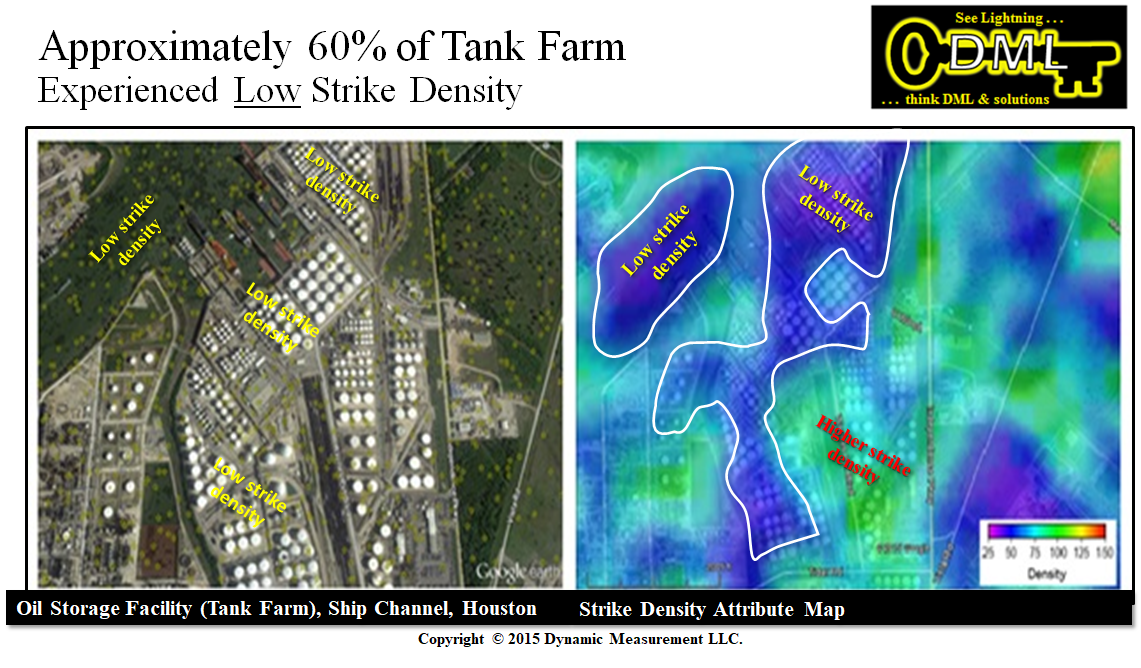
Tidal Gradient when Strikes Occurred + Faults | Tank Farm Ship Chanel Houston + Strike Density |
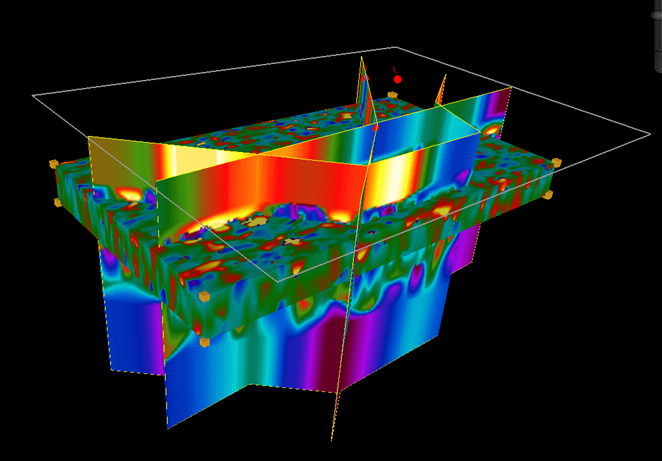
Low/High Strike Density Tank Farm Houston | Resistivity 3-D Probe Cross-Sections Houston |
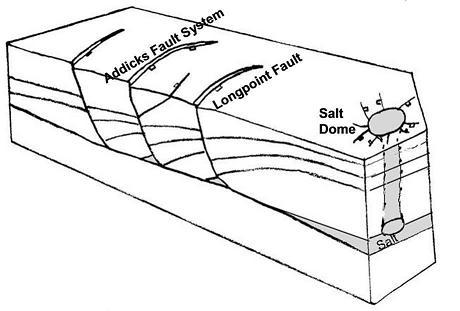
Surface Faults West Houston Texas Area | Long Point Growth Fault Cartoon Houston |
 |  |
 |  |
 |  |
 |  |
 |  |
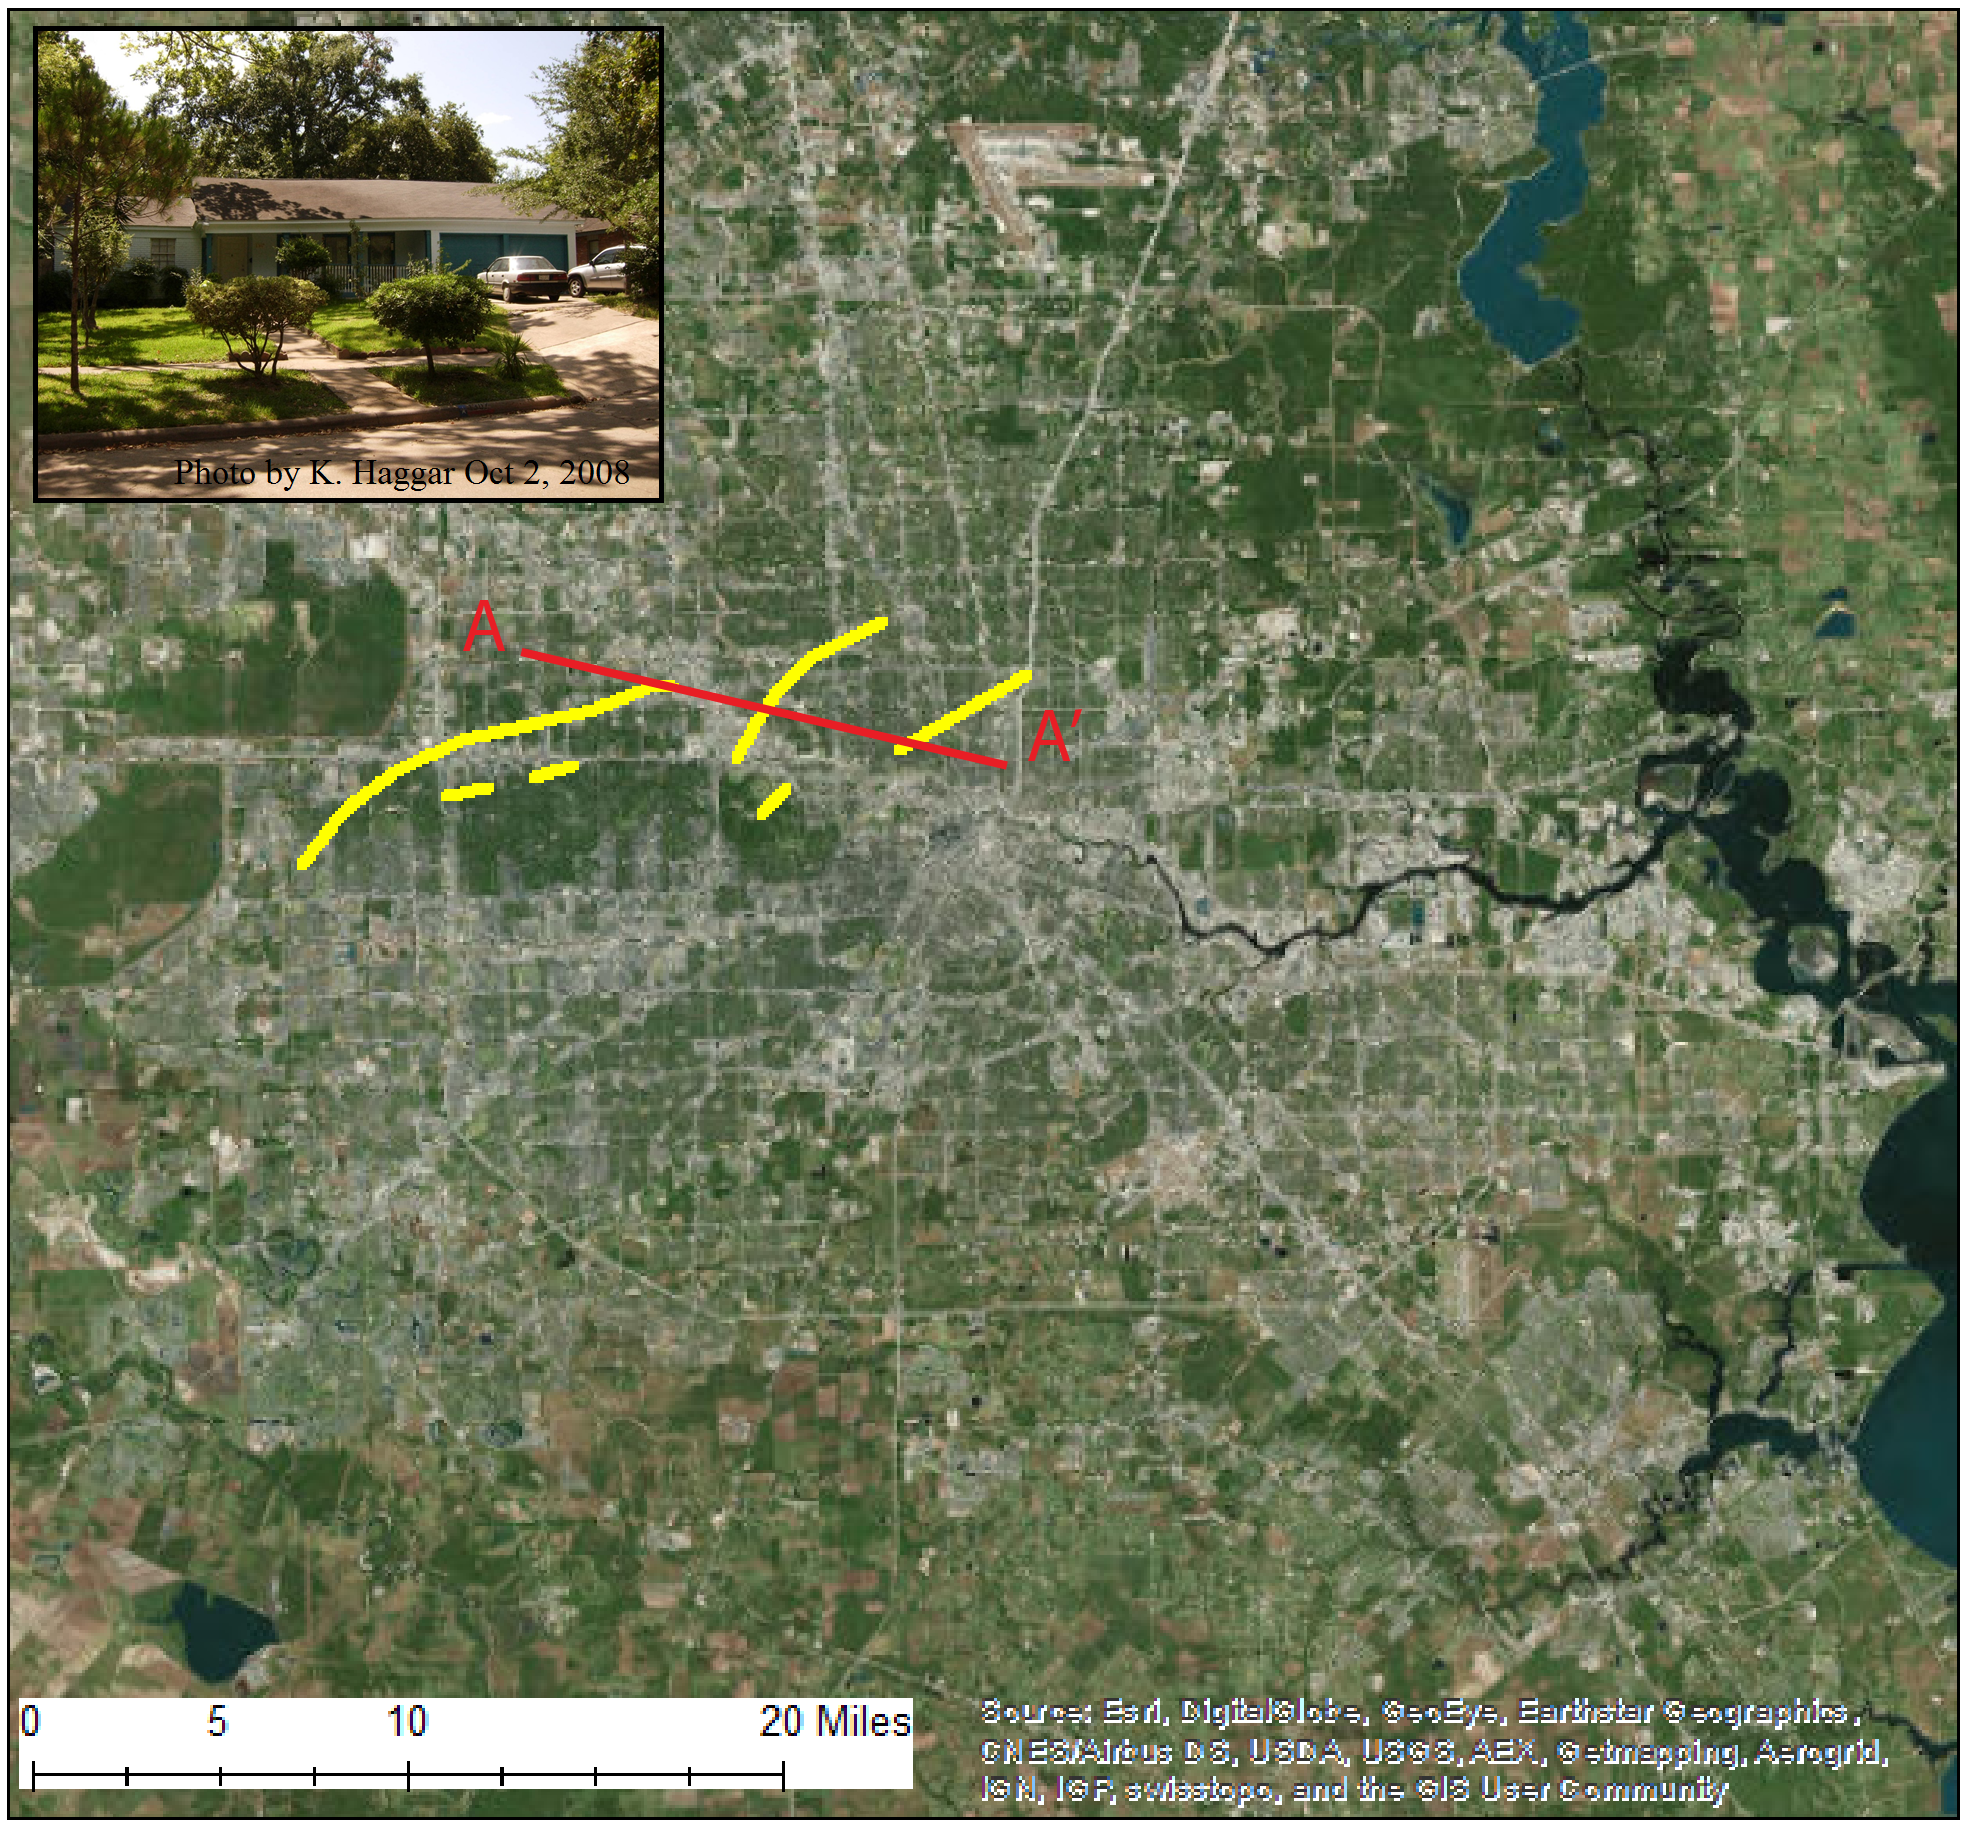
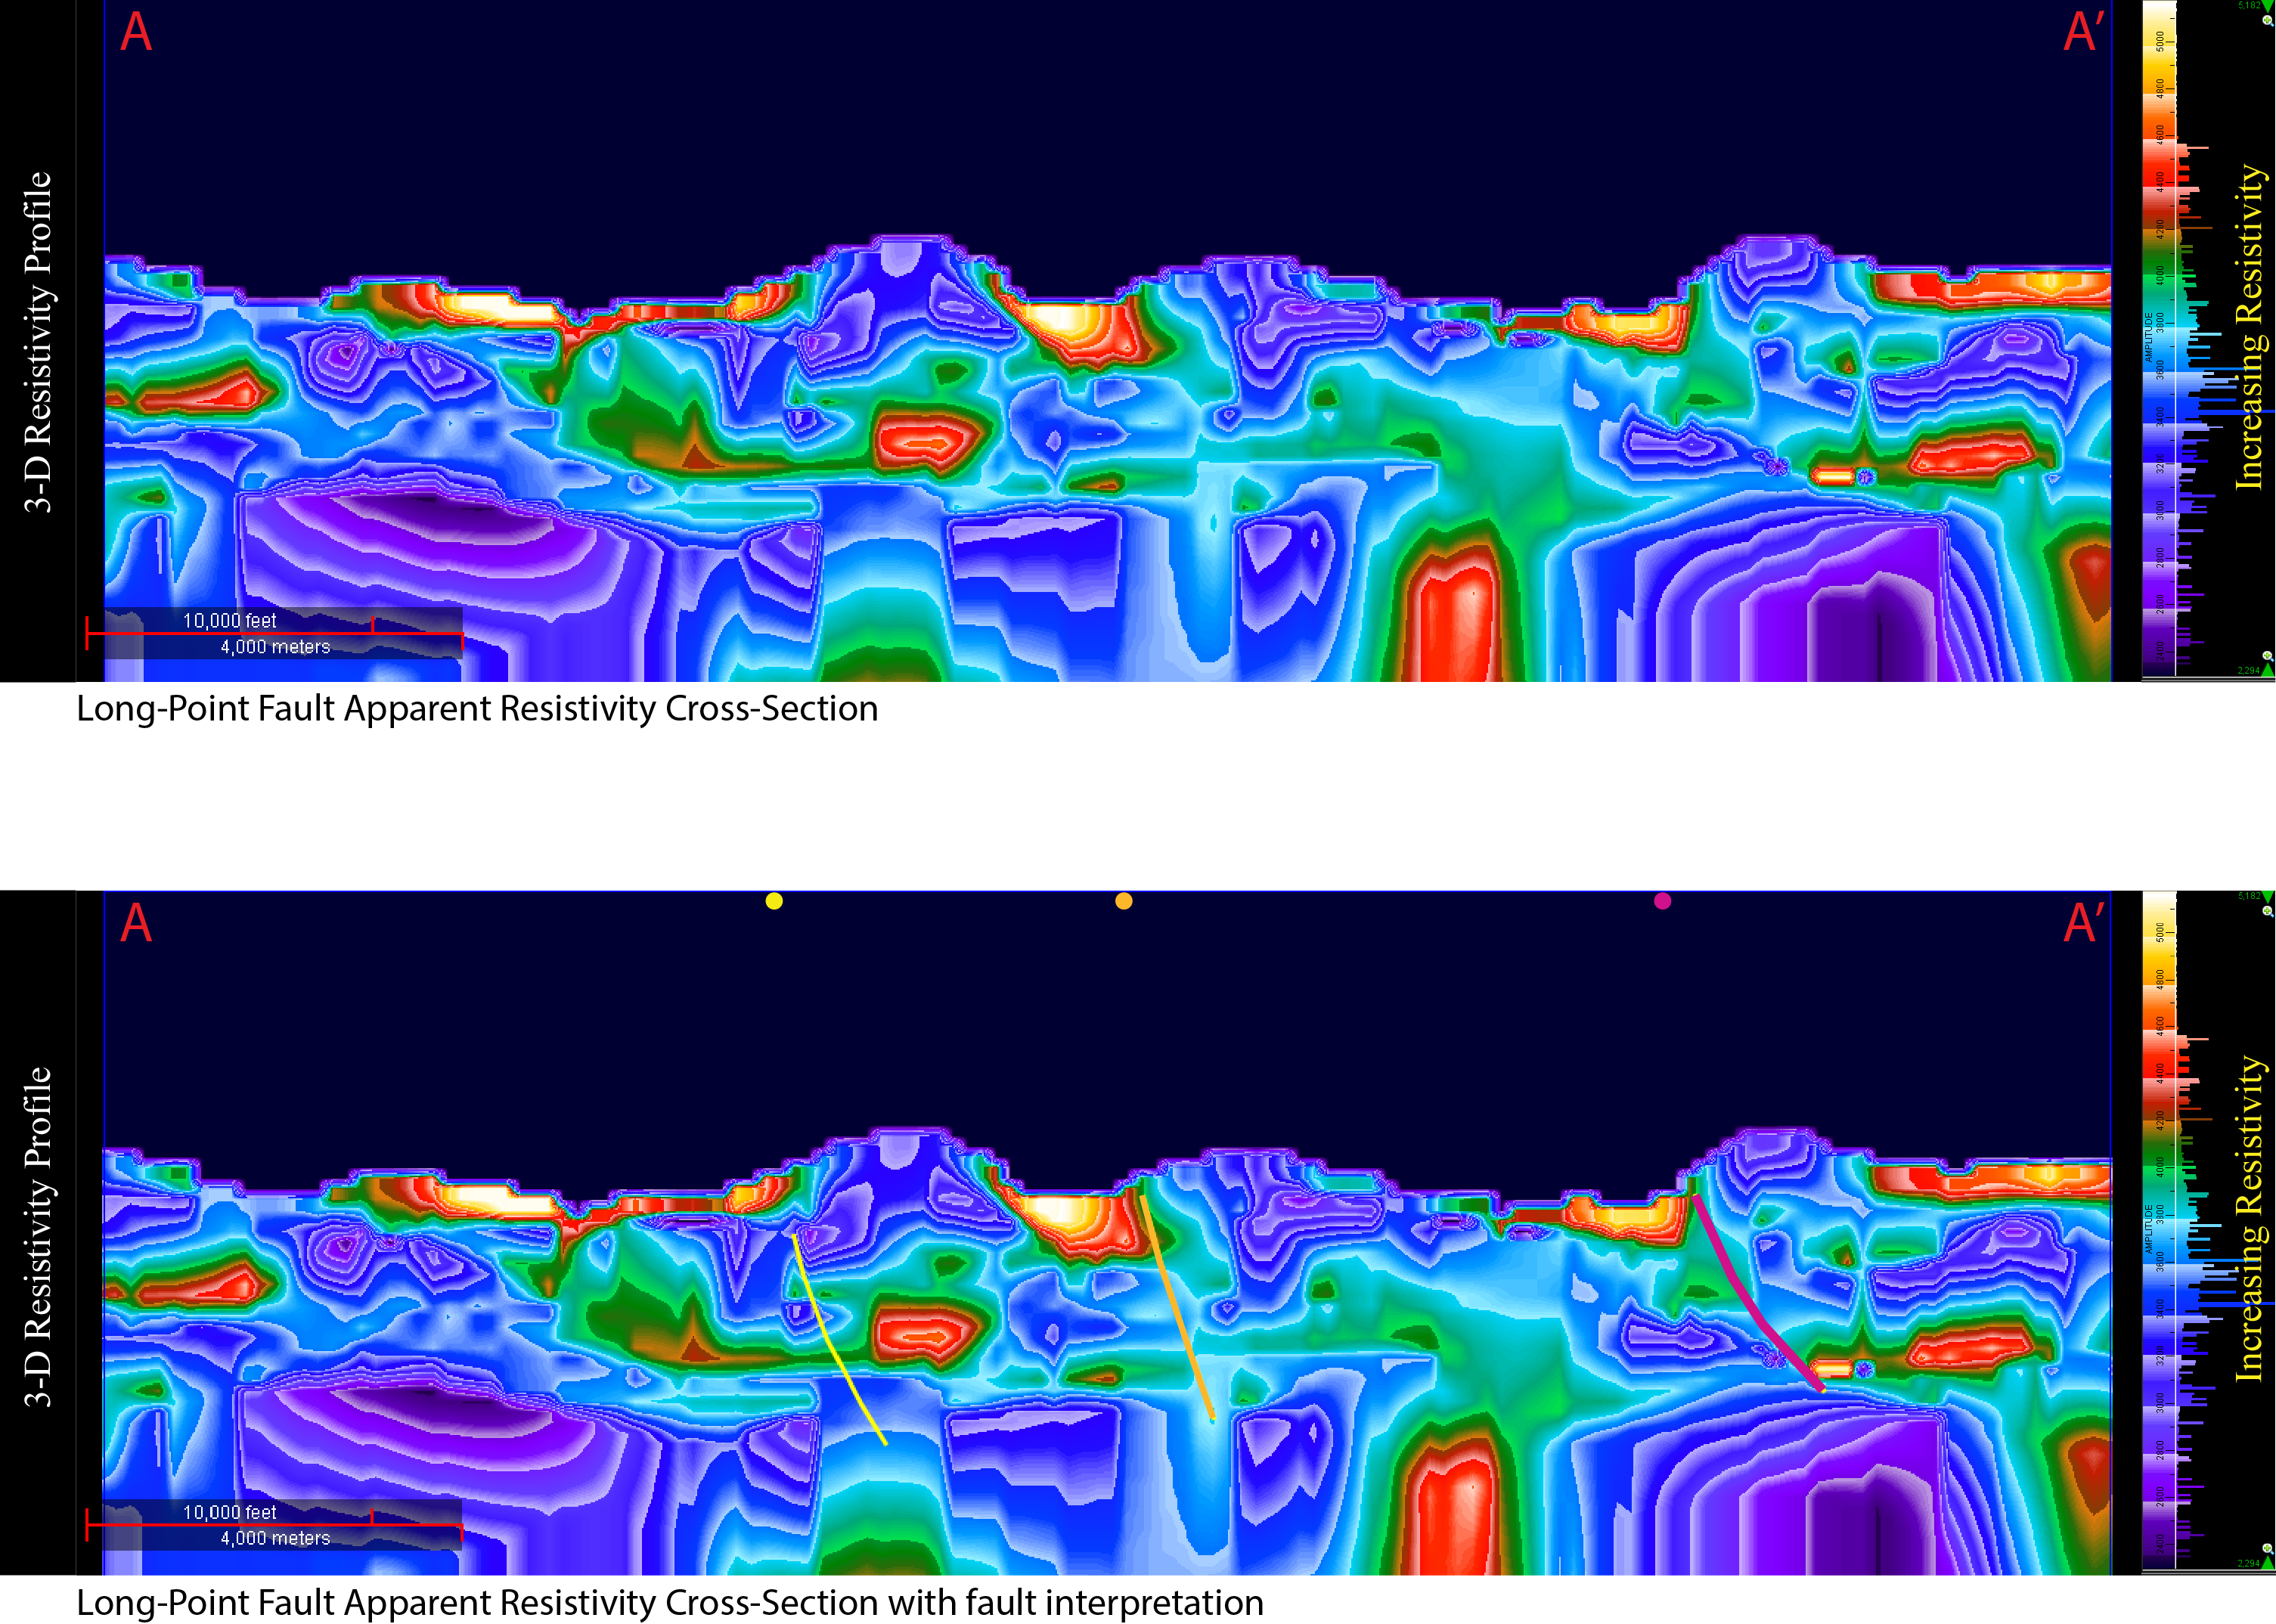
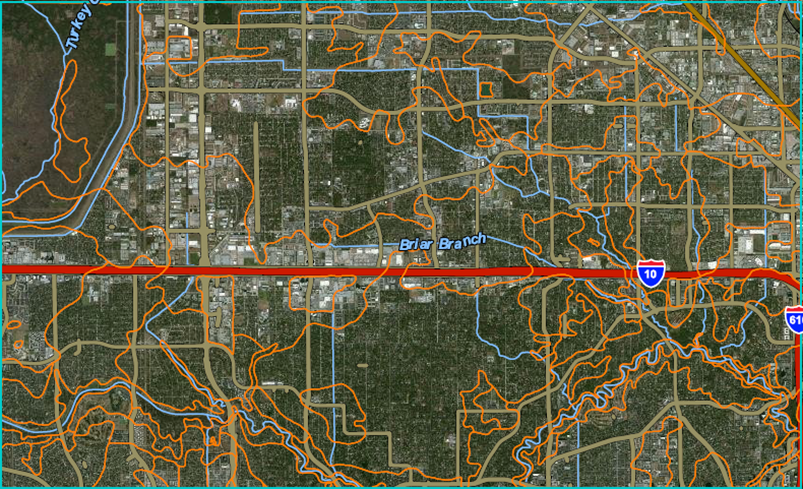
| Long Point Fault Cross-Section Location House | Resistivity Cross-Section Without & With Faults |
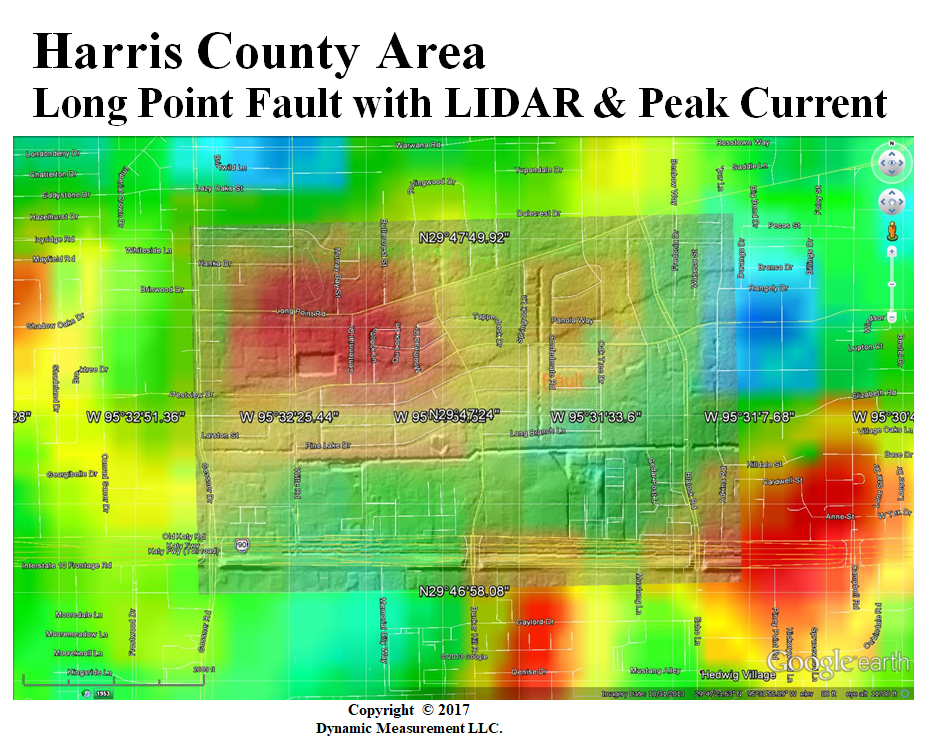
Government Map of Soils over Long Point Fault Area | Soils, LIDAR, Avg. Peak Current Long Point Fault |
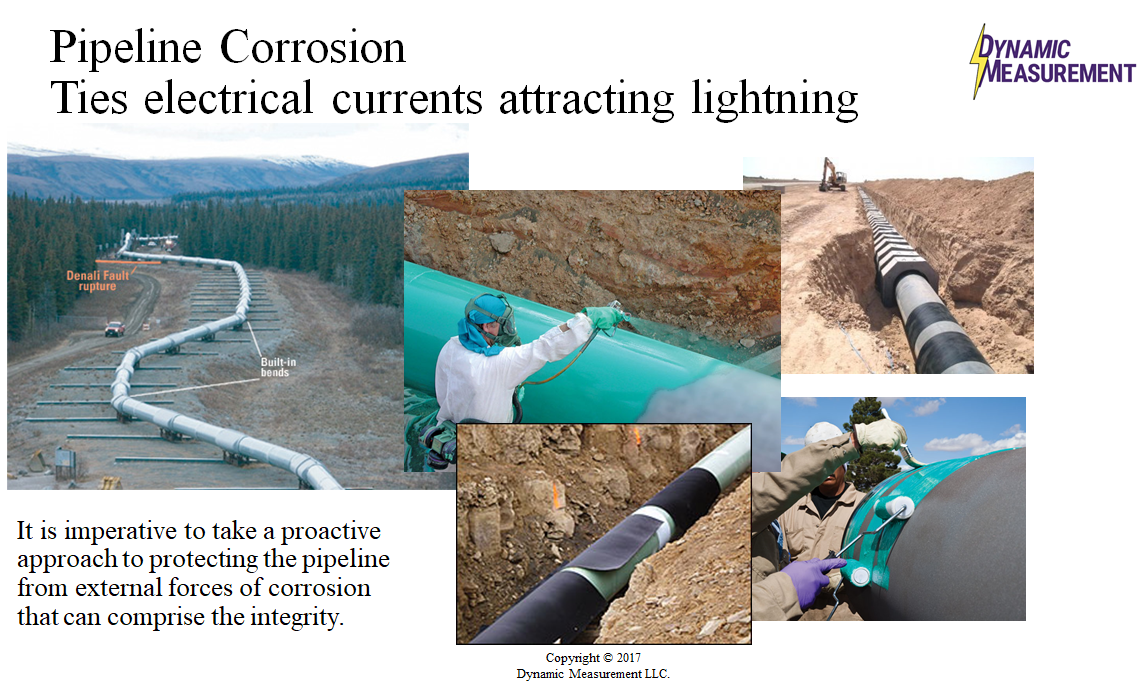
LIDAR and Peak Current Long Point Fault Area | Pipeline Photos and Corrosion Protection |
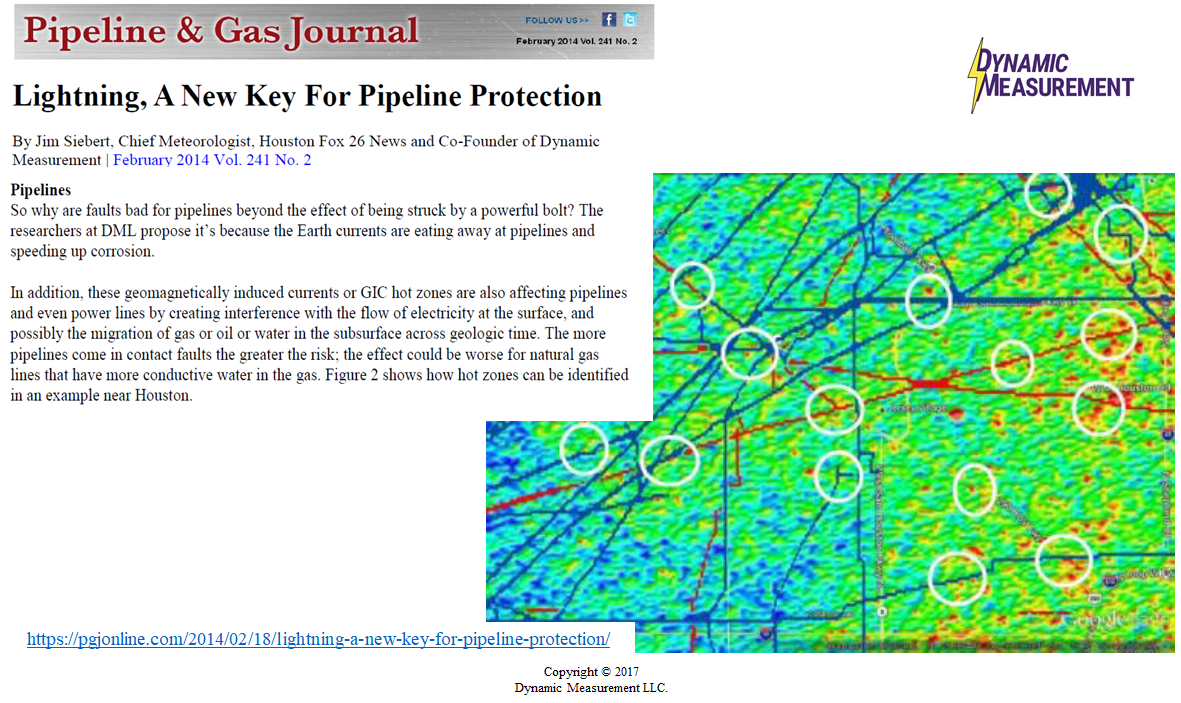
Dr. Jim's Paper in Pipeline & Gas Journal 2014 | Houson Area with Surface Faults and Salt Domes |
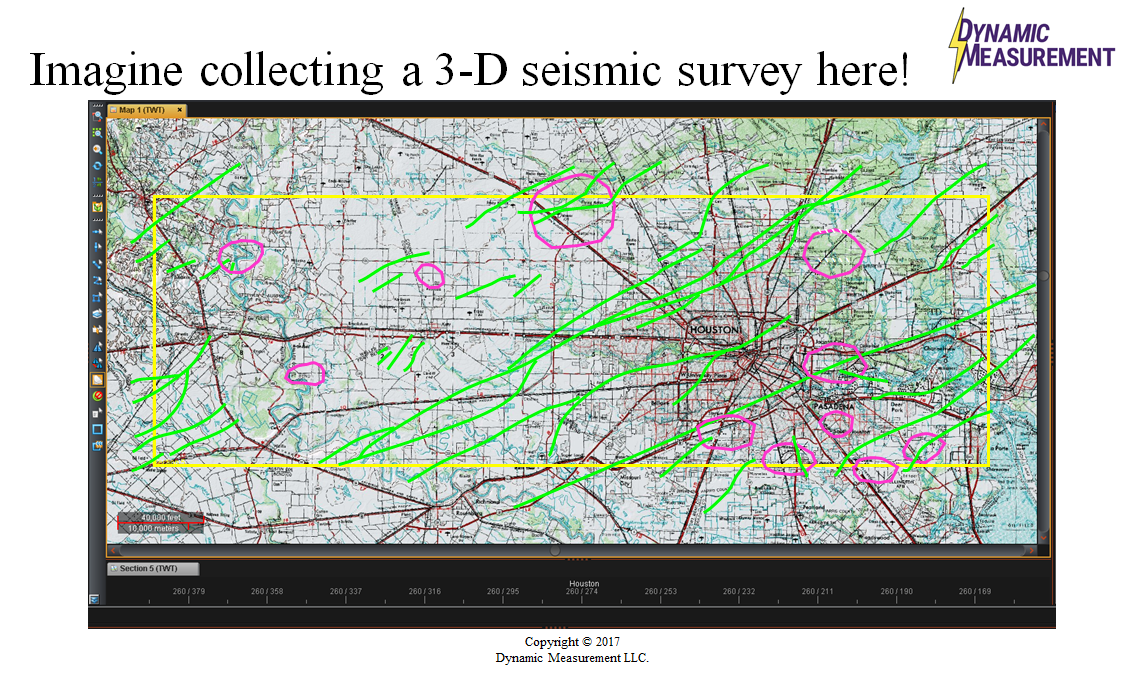
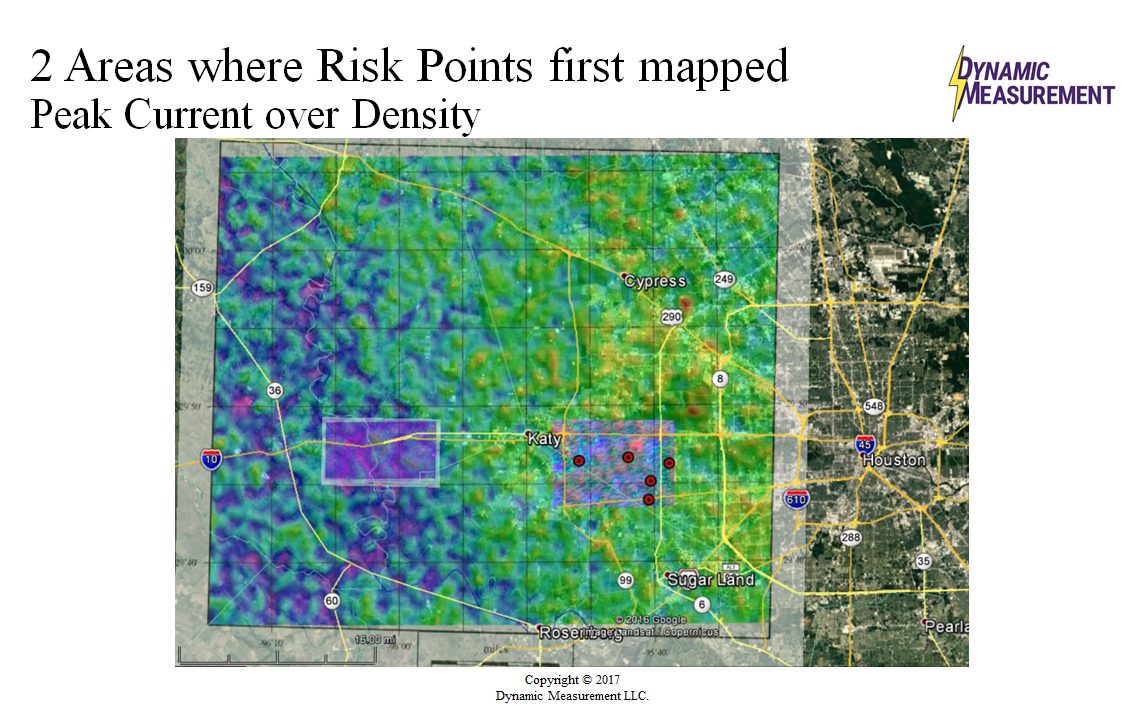
Resistivity Animation North Houston, TX | Two Areas Risk Points First Mapped, Houston |
 |  |
 |  |
 |  |
 |  |
 |  |
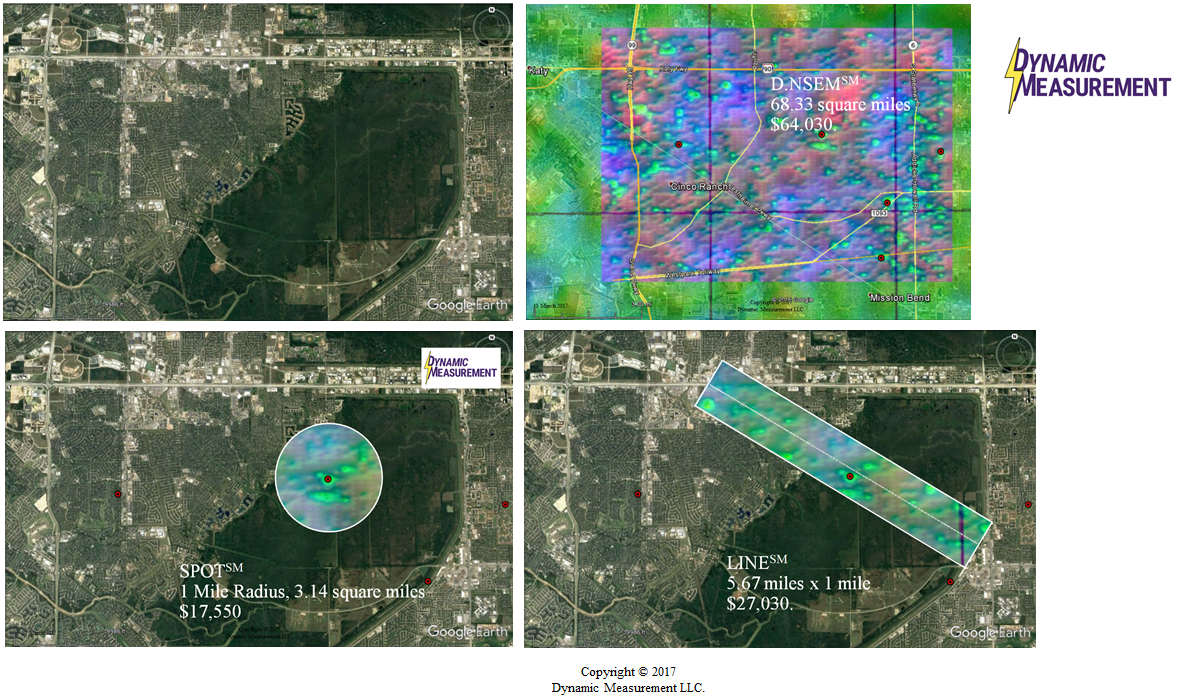
| Select Area, SPOTsm, LINEsm, or d.NSEMsm | Lightning Density Map Houston, TX Area |
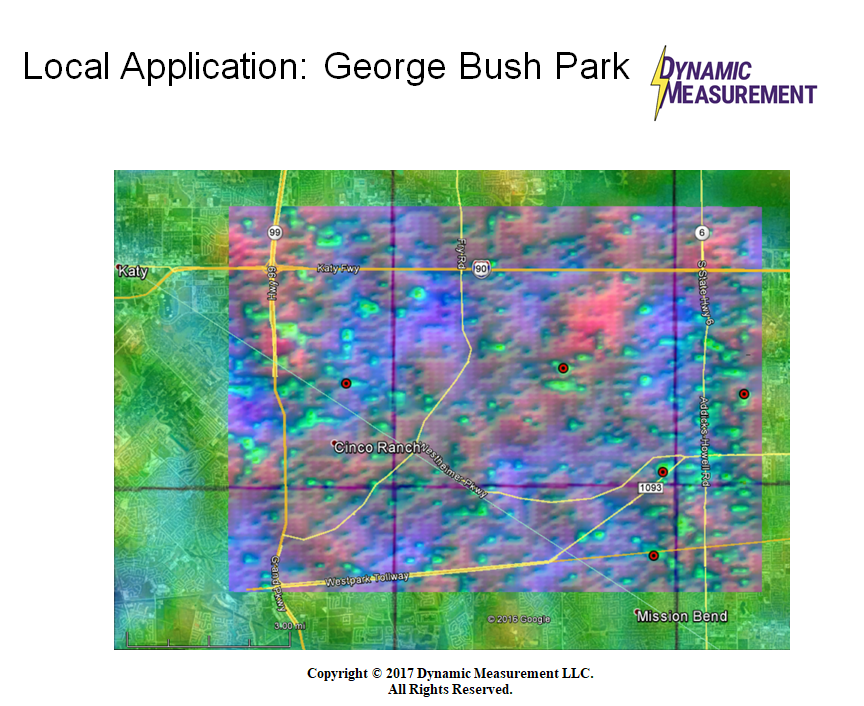
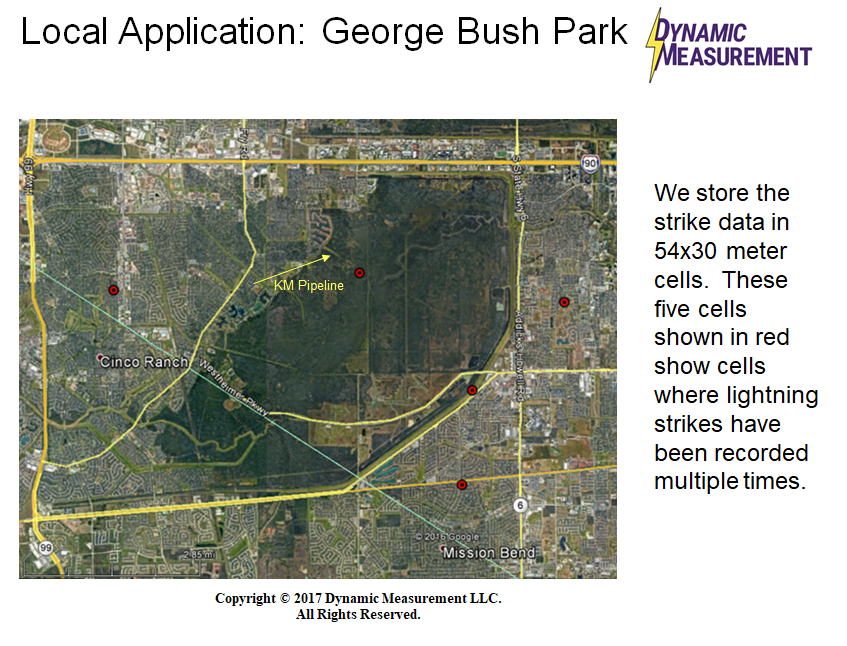
Peak Current over Density George Bush Park | Risk Points in George Bush Park, Houston |
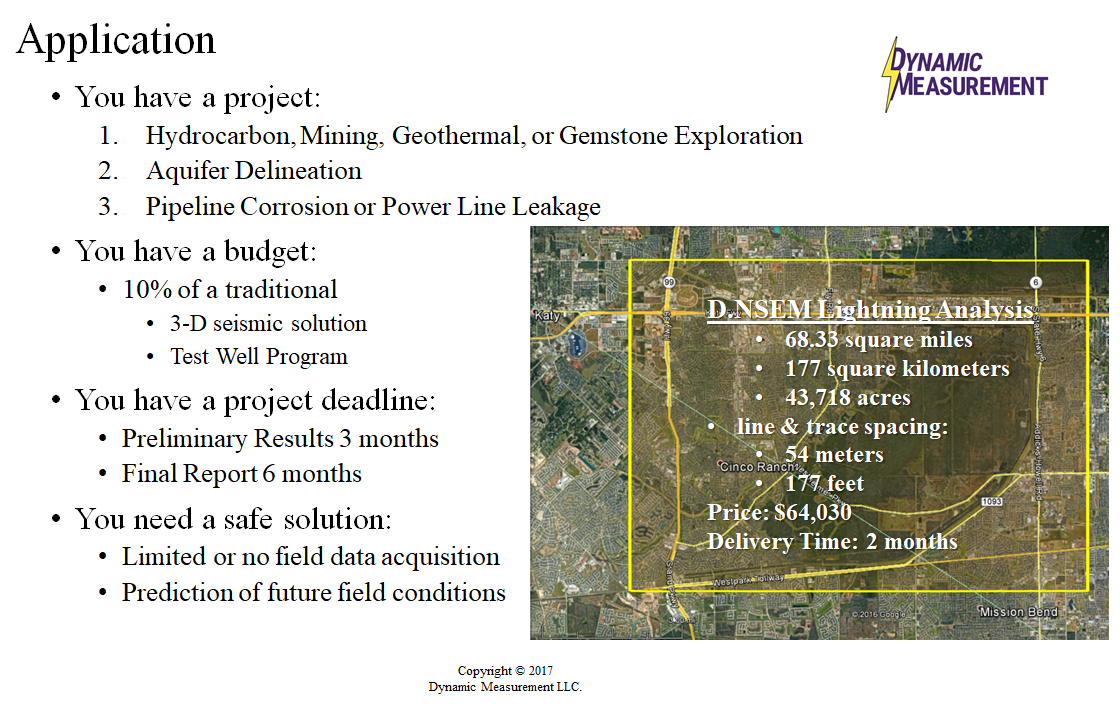
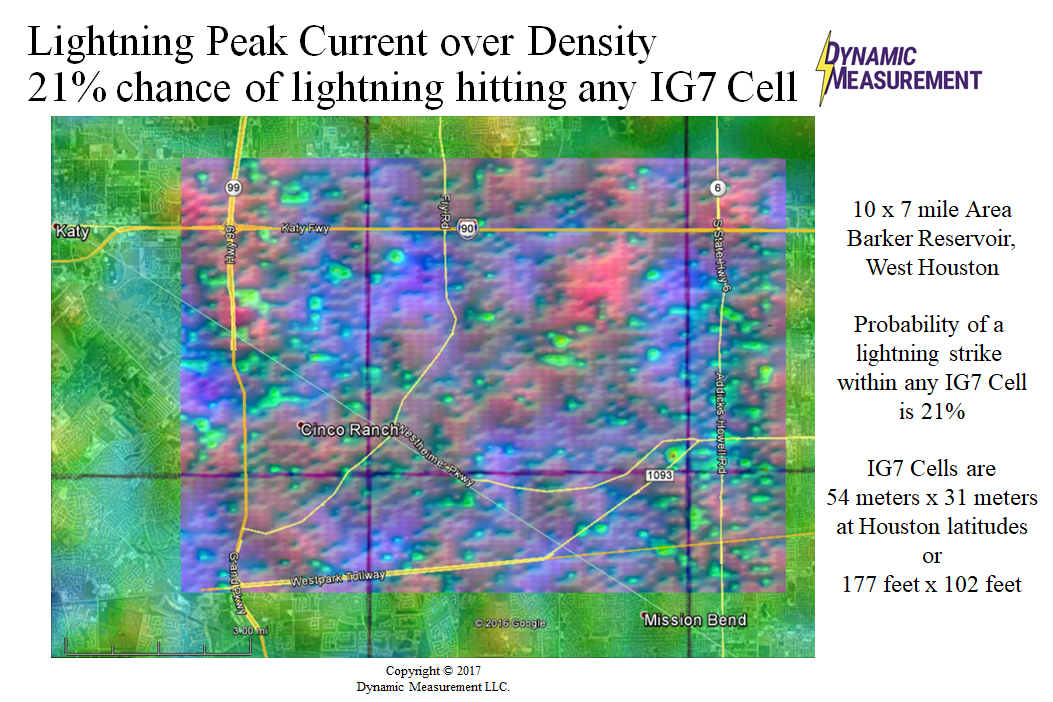
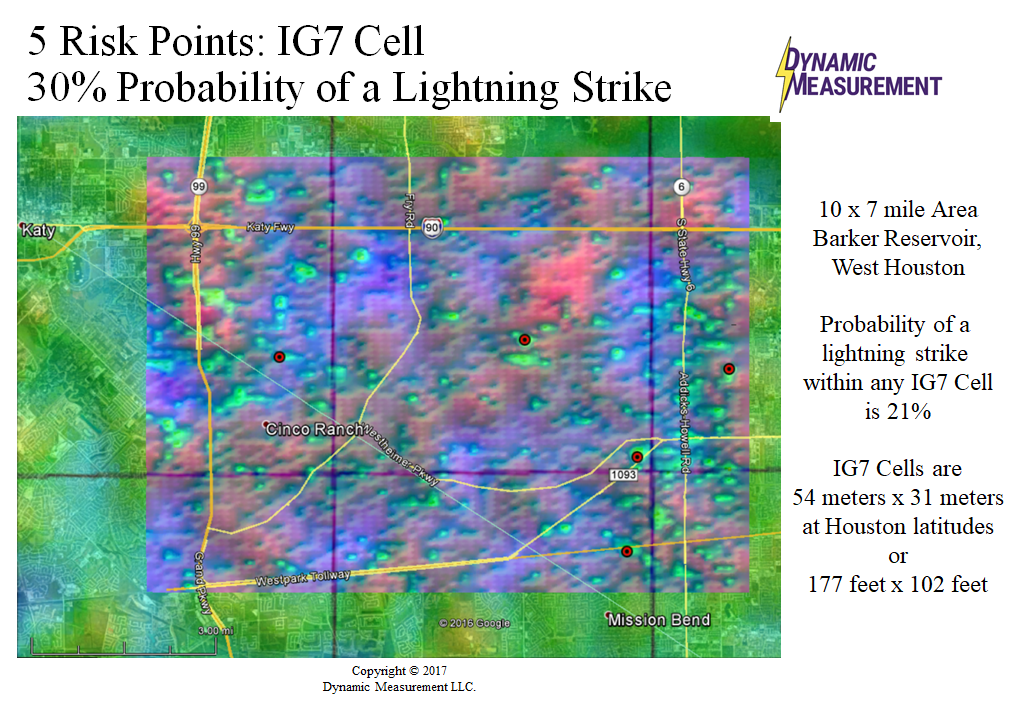
Price of 63.33 square mile d.NSEMsm | 21% Chance of Lightning Hitting Any IG7 Cell |
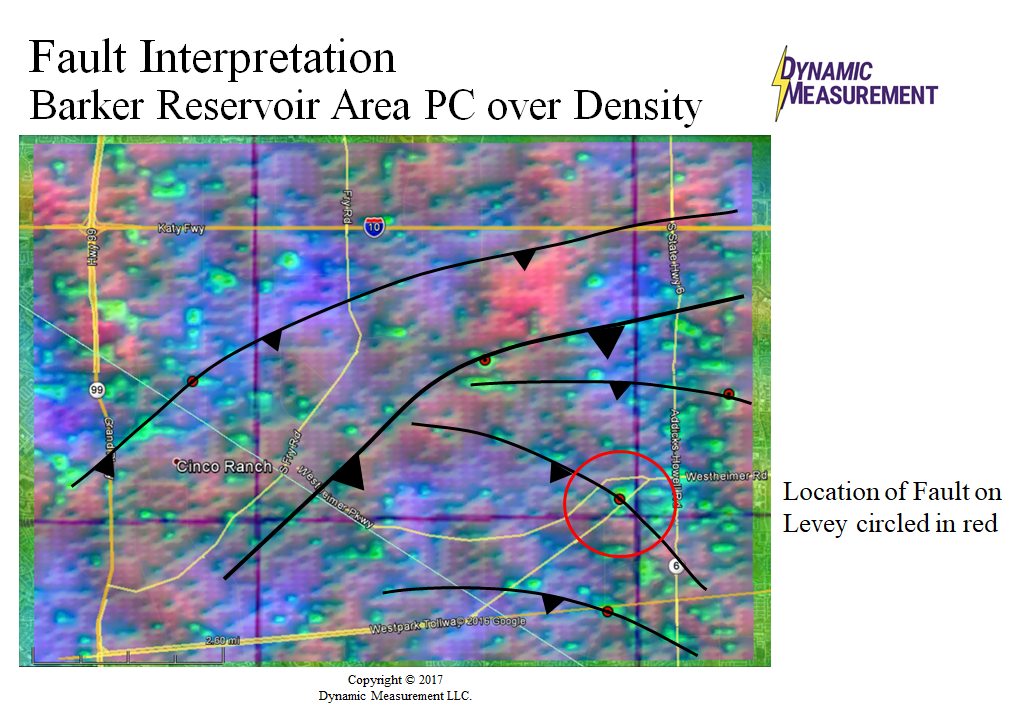
30% Chance of Lightning Hitting 5 IG7 Cells | Lightning Analysis Fault Interpretation |
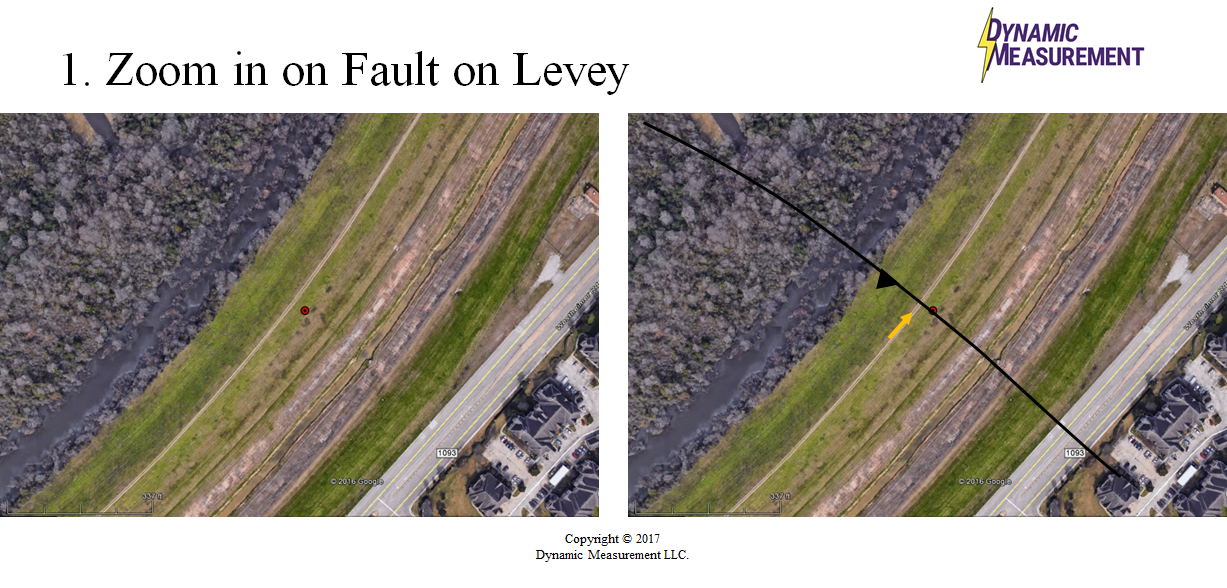
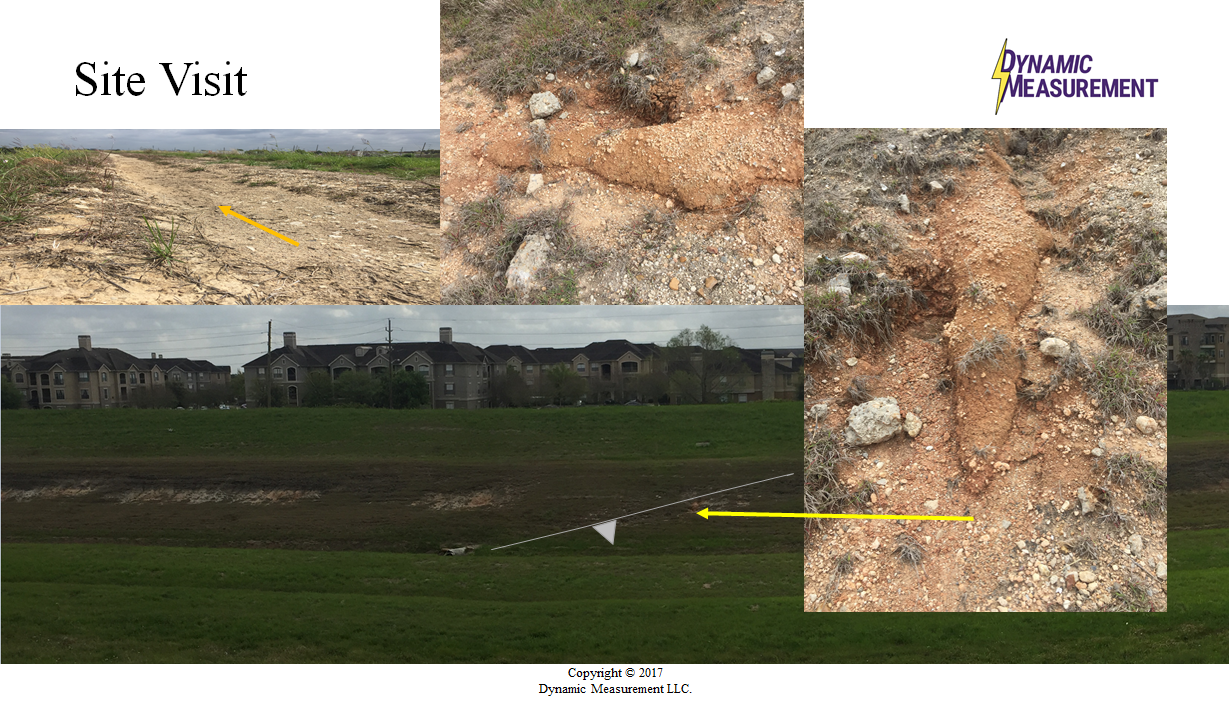
Fault on Levey at one of the Risk Point Locations | Site Visit to Levey Risk Point Location |
 |  |
 |  |
 |  |
 |  |
 |  |
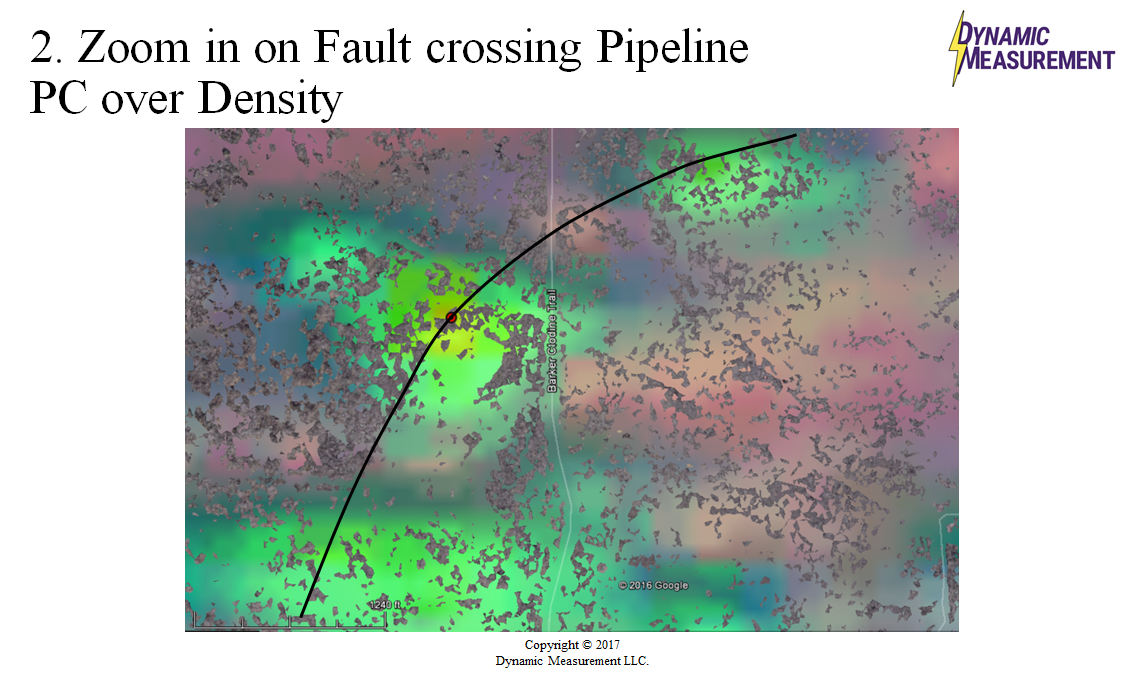
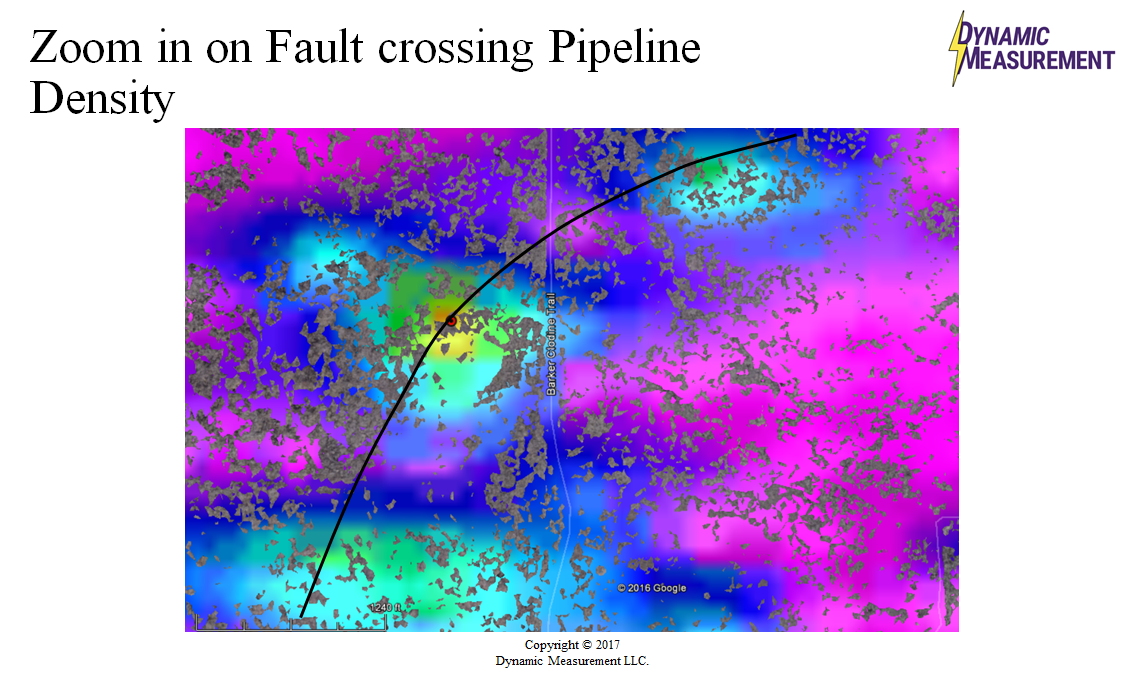
| Zoom on Fault Crossing Pipeline Near Risk Point | Density Map Fault Crossing Pipeline Near Risk Point |
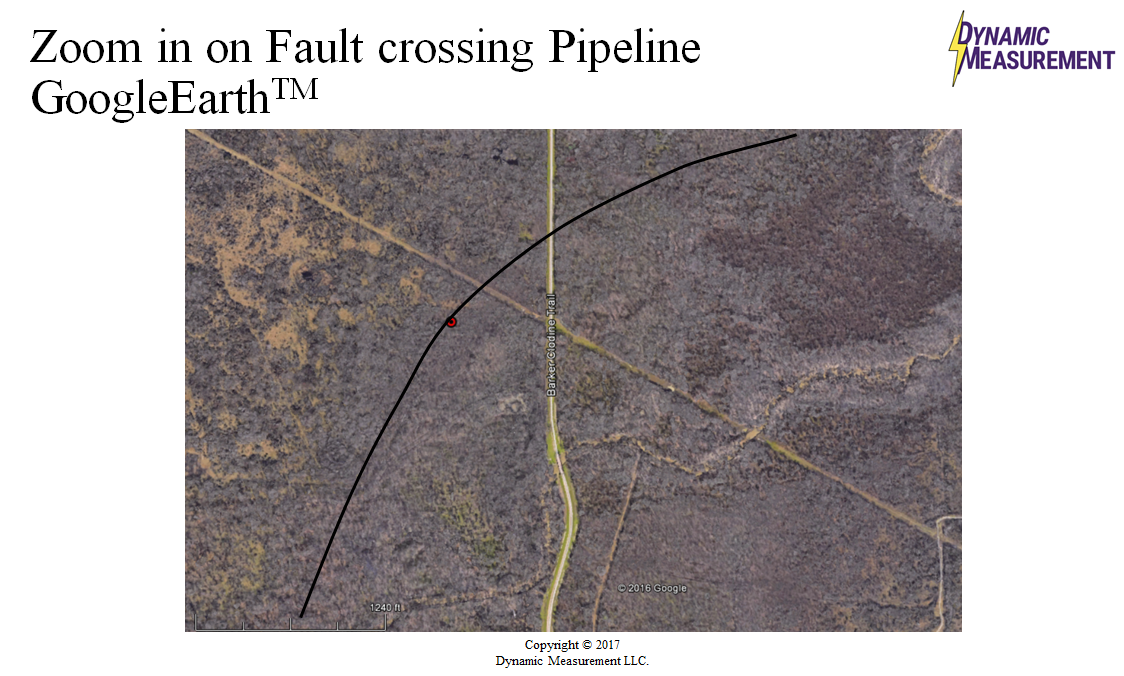
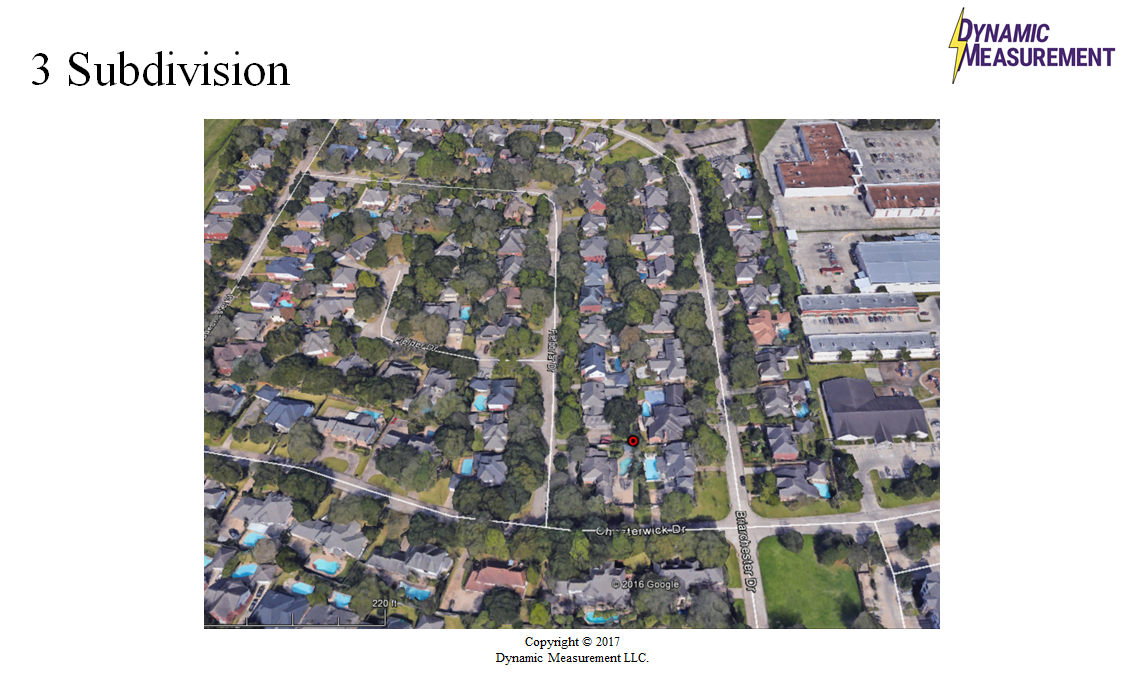
GoogleEarth Fault Crossing Pipeline Near Risk Point | Risk Point Location Houston Subivision |
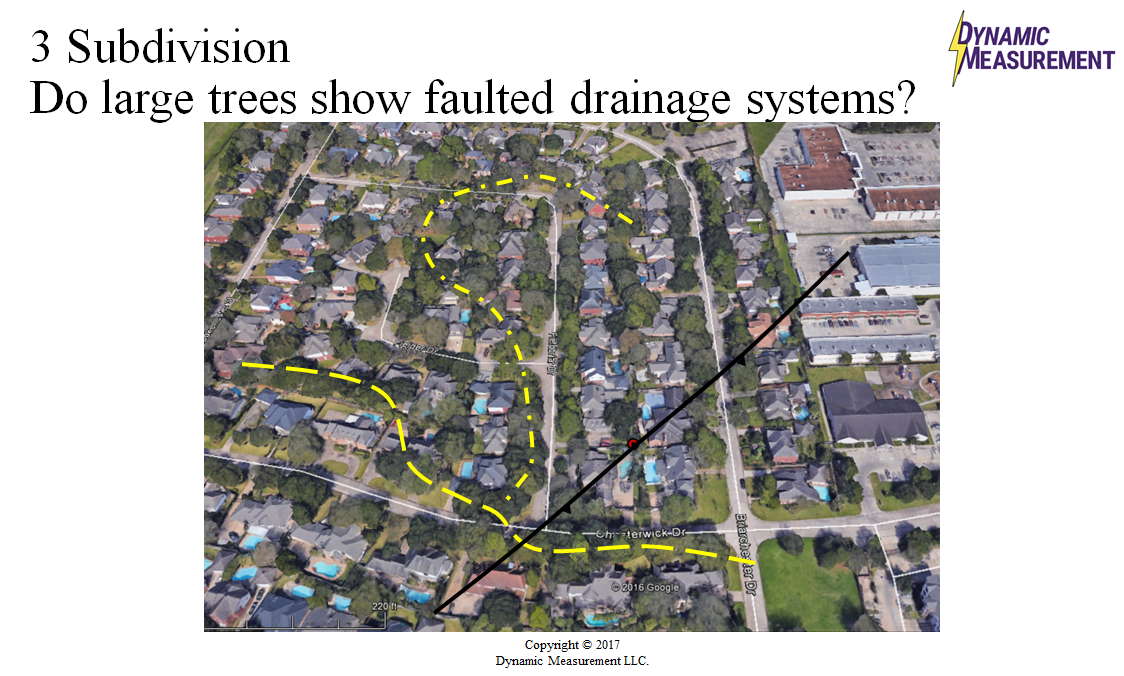
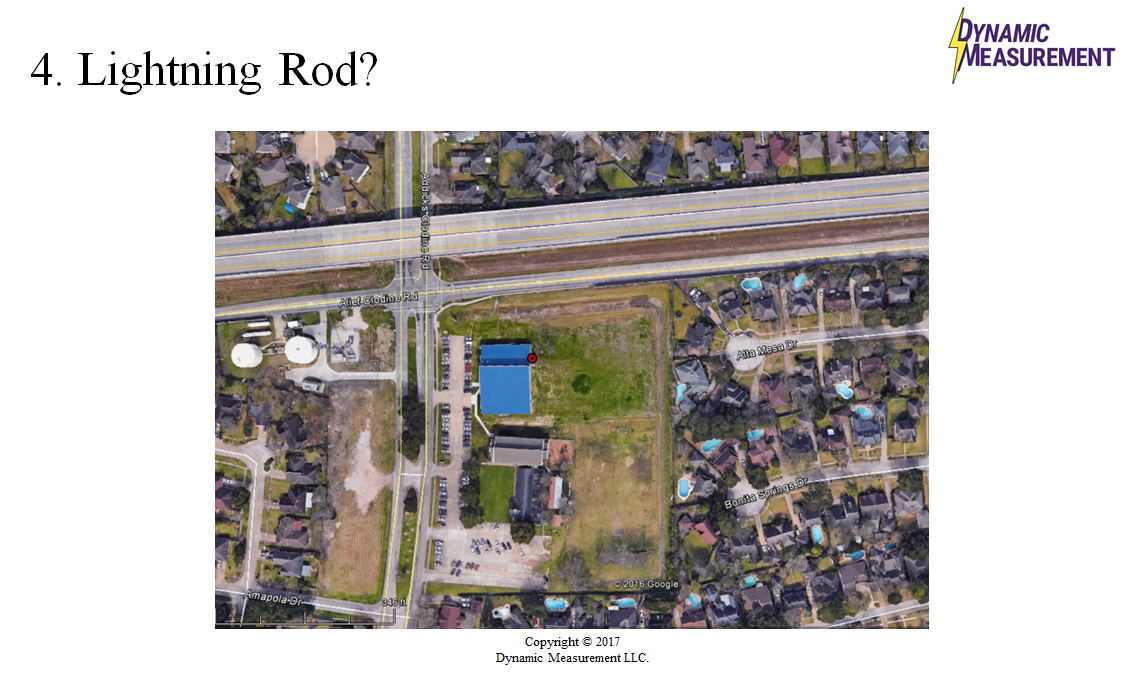
Do Trees Show Faulted Drainage System | Risk Point Possibly at Lightning Rod |
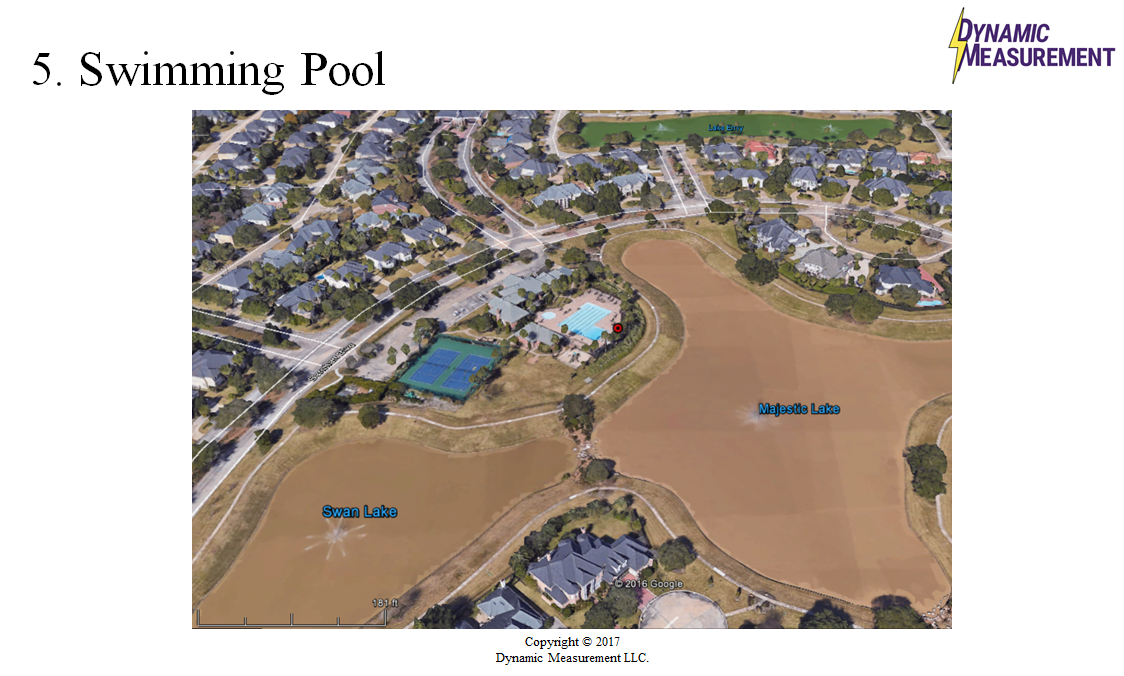
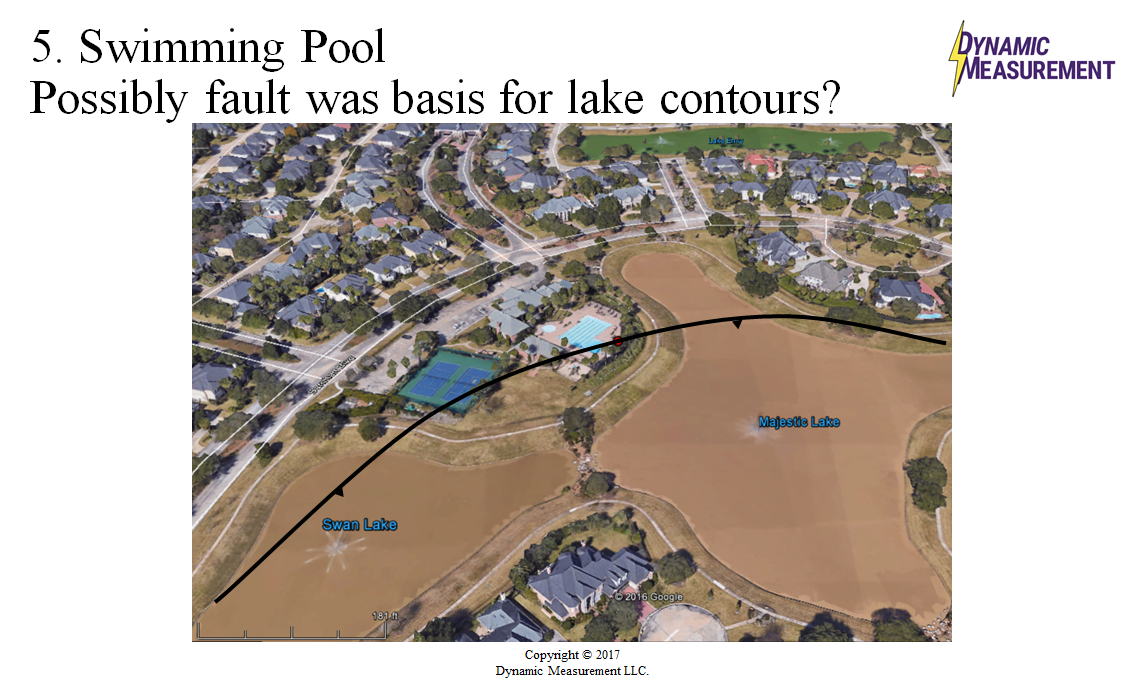
Risk Point near Subdivision Swimming Pool | Possibly Fault Basis for Lake Contours |
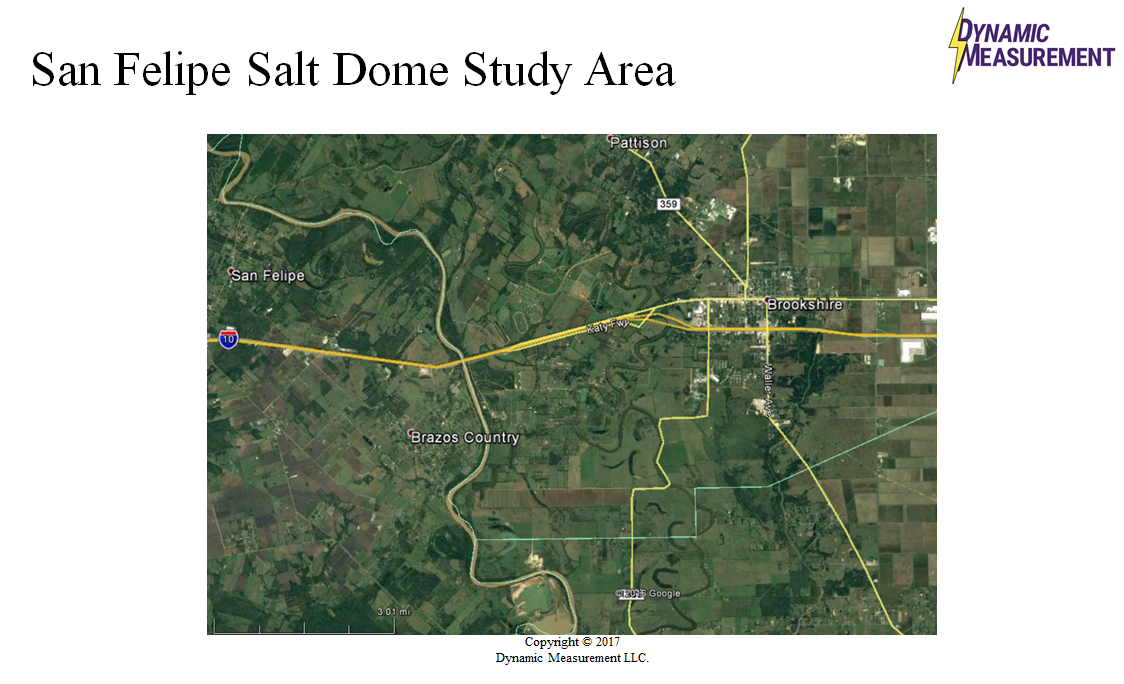
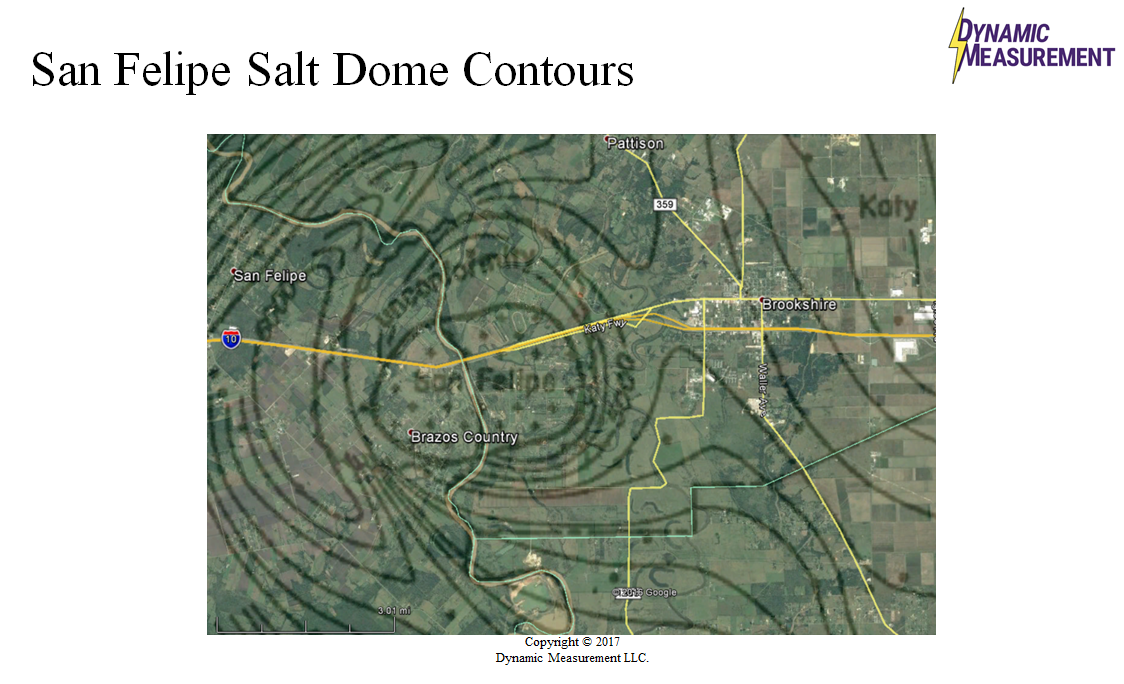
San Felipe / Brookshire Salt Dome Area | Contours of Beds Against Salt Dome |
 |  |
 |  |
 |  |
 |  |
 |  |
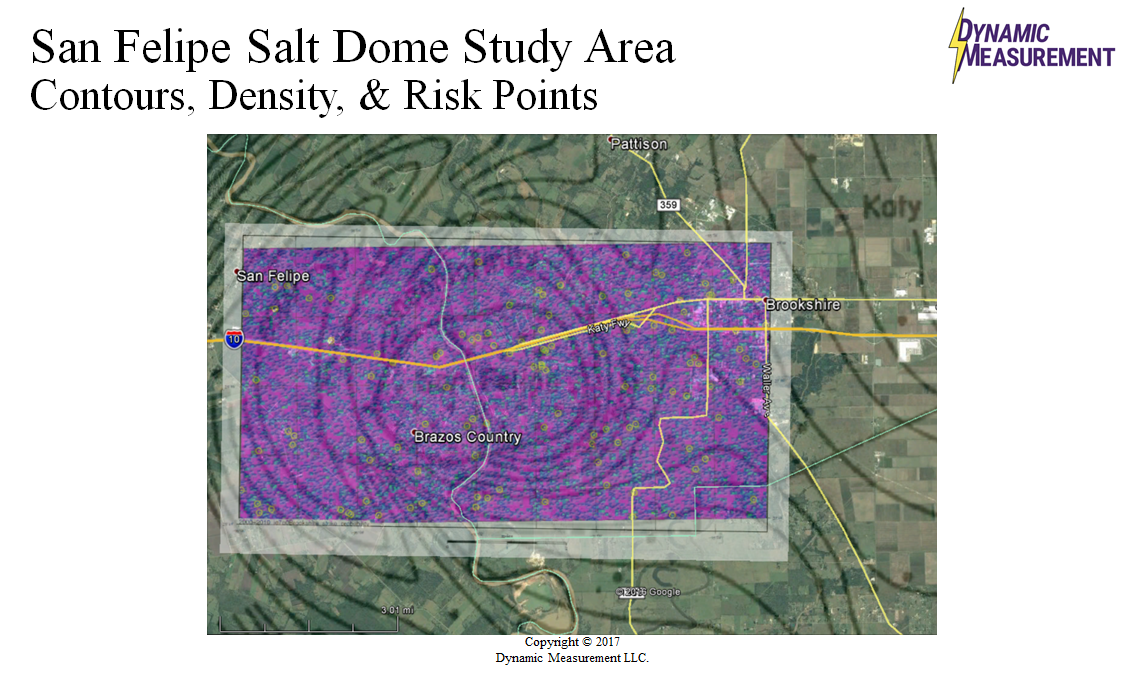
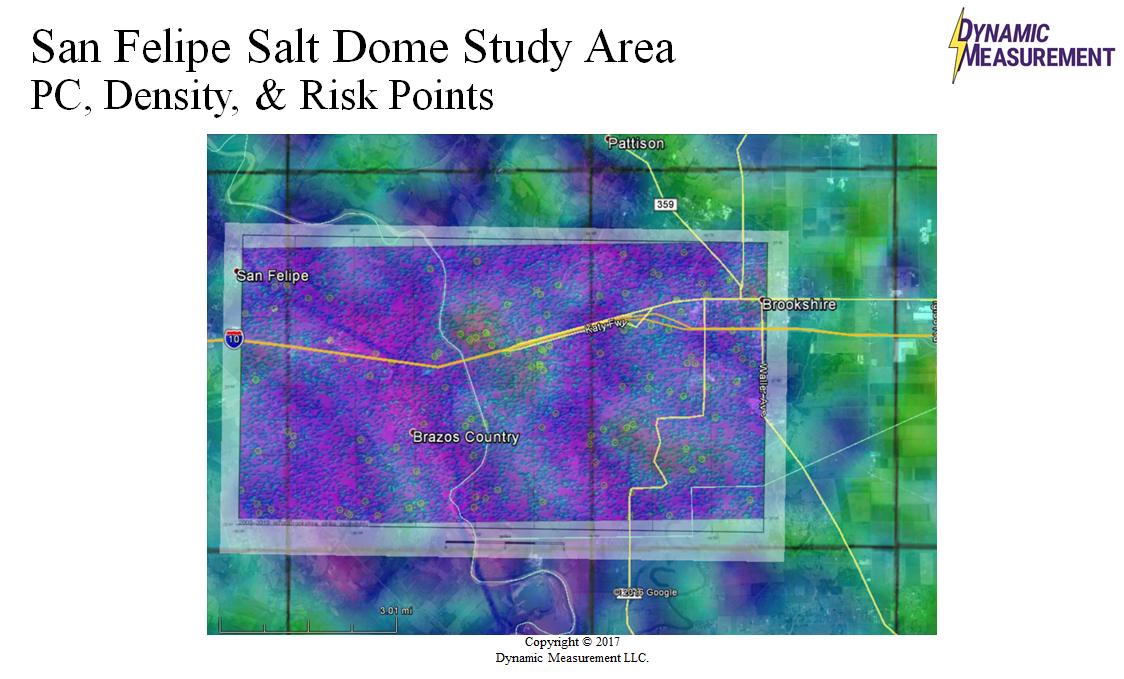
| Salt Dome, Contours, Density, & Risk Points | Salt Dome Peak Current, Density, & Risk Points |
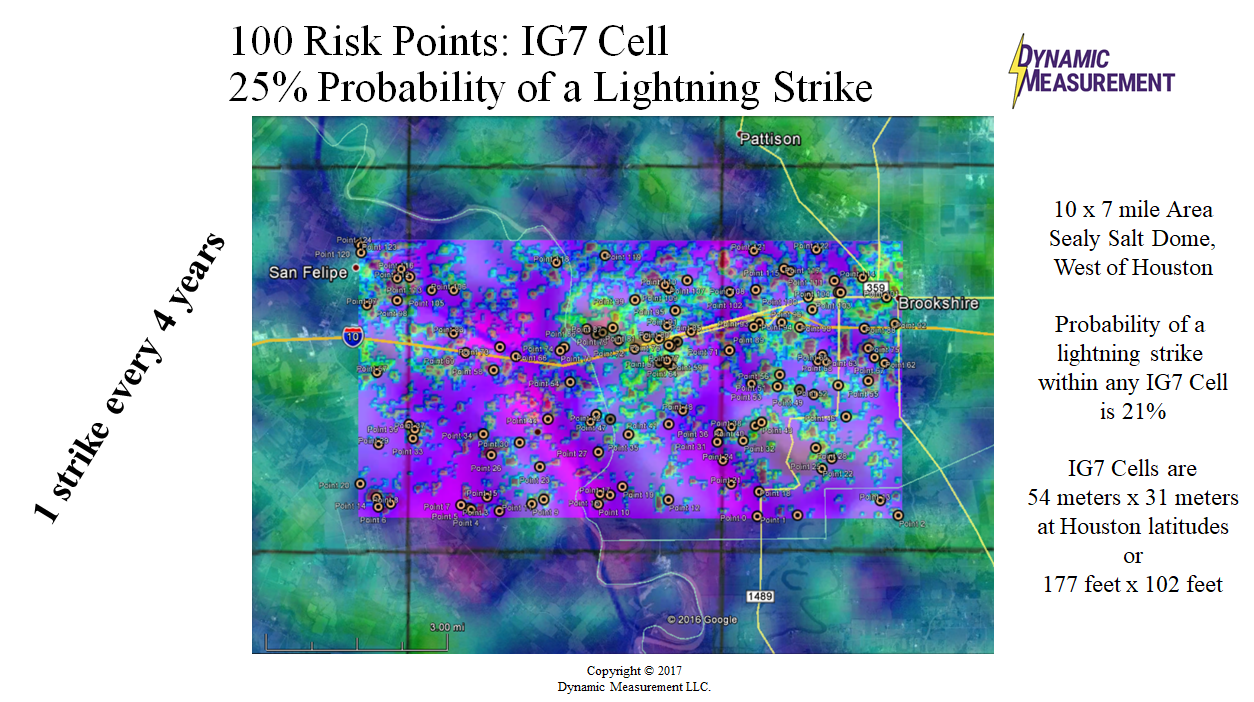
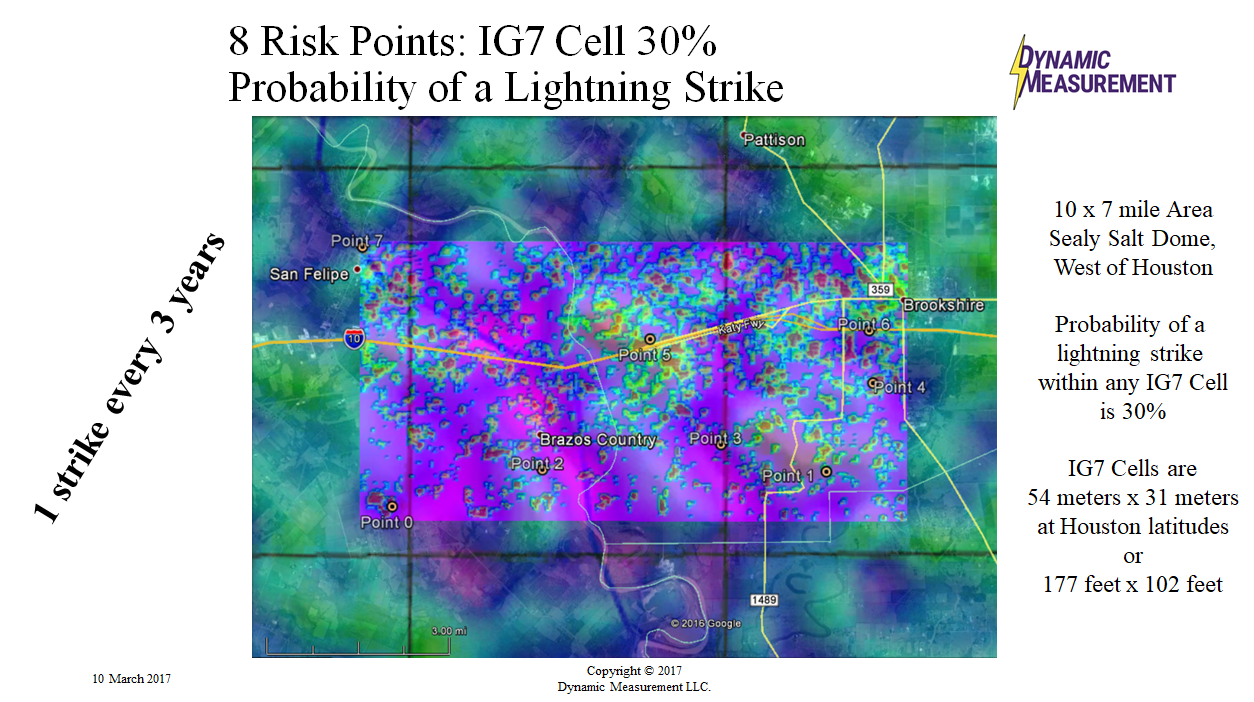
100 Risk Points 25% Probability of Strike | 8 Risk Points 30% Probability of Strike |
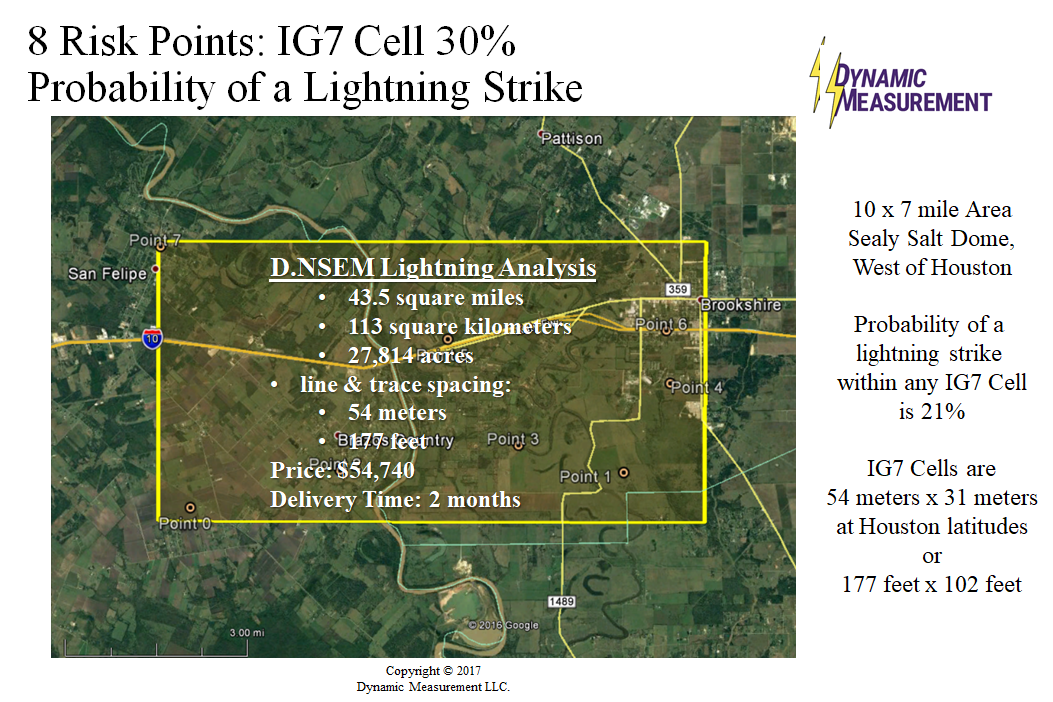
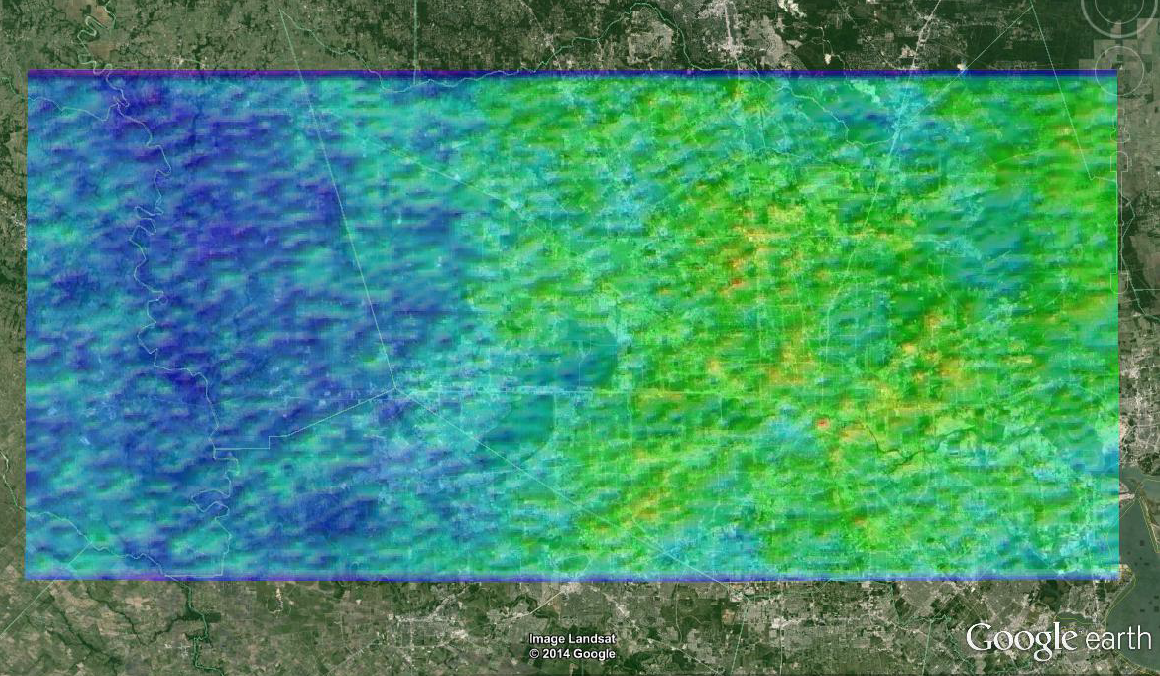
Price of 43.5 square mile d.NSEMsm | Lightning Density Semi-Transparent Houston Area |
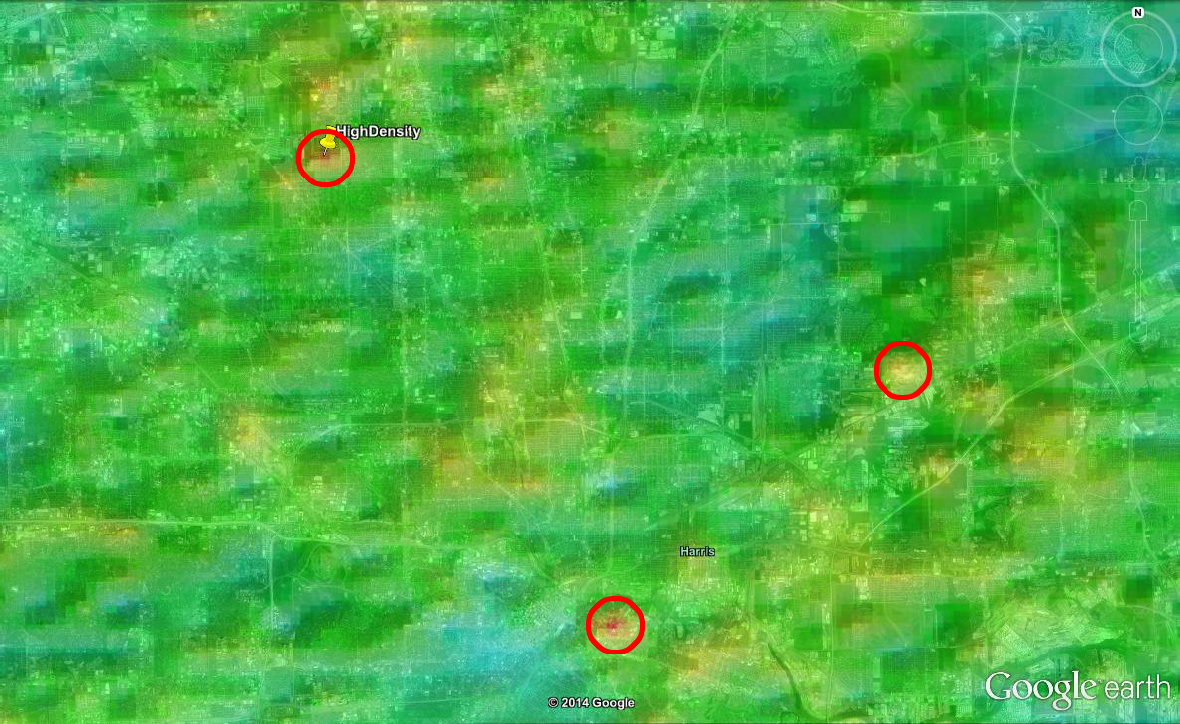
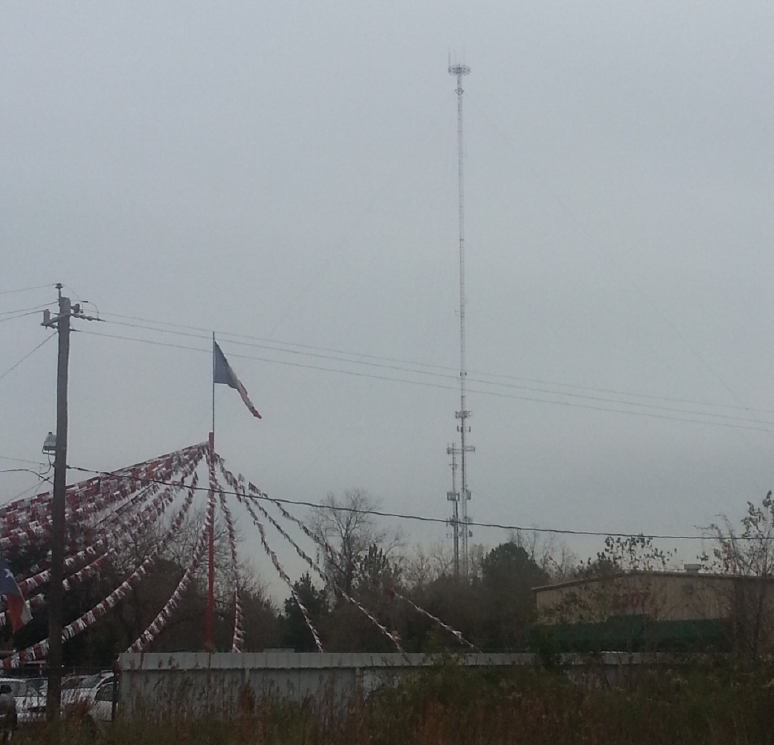
Three High Lightning Denisty Areas Houston | #1 was at a Communication Tower by 249 |
One Methane From Landfill Beaumont Hwy. | Peak Current #3 Warehouses East of Downtown |
 |  |
 |  |
 |  |
 |  |
 |  |
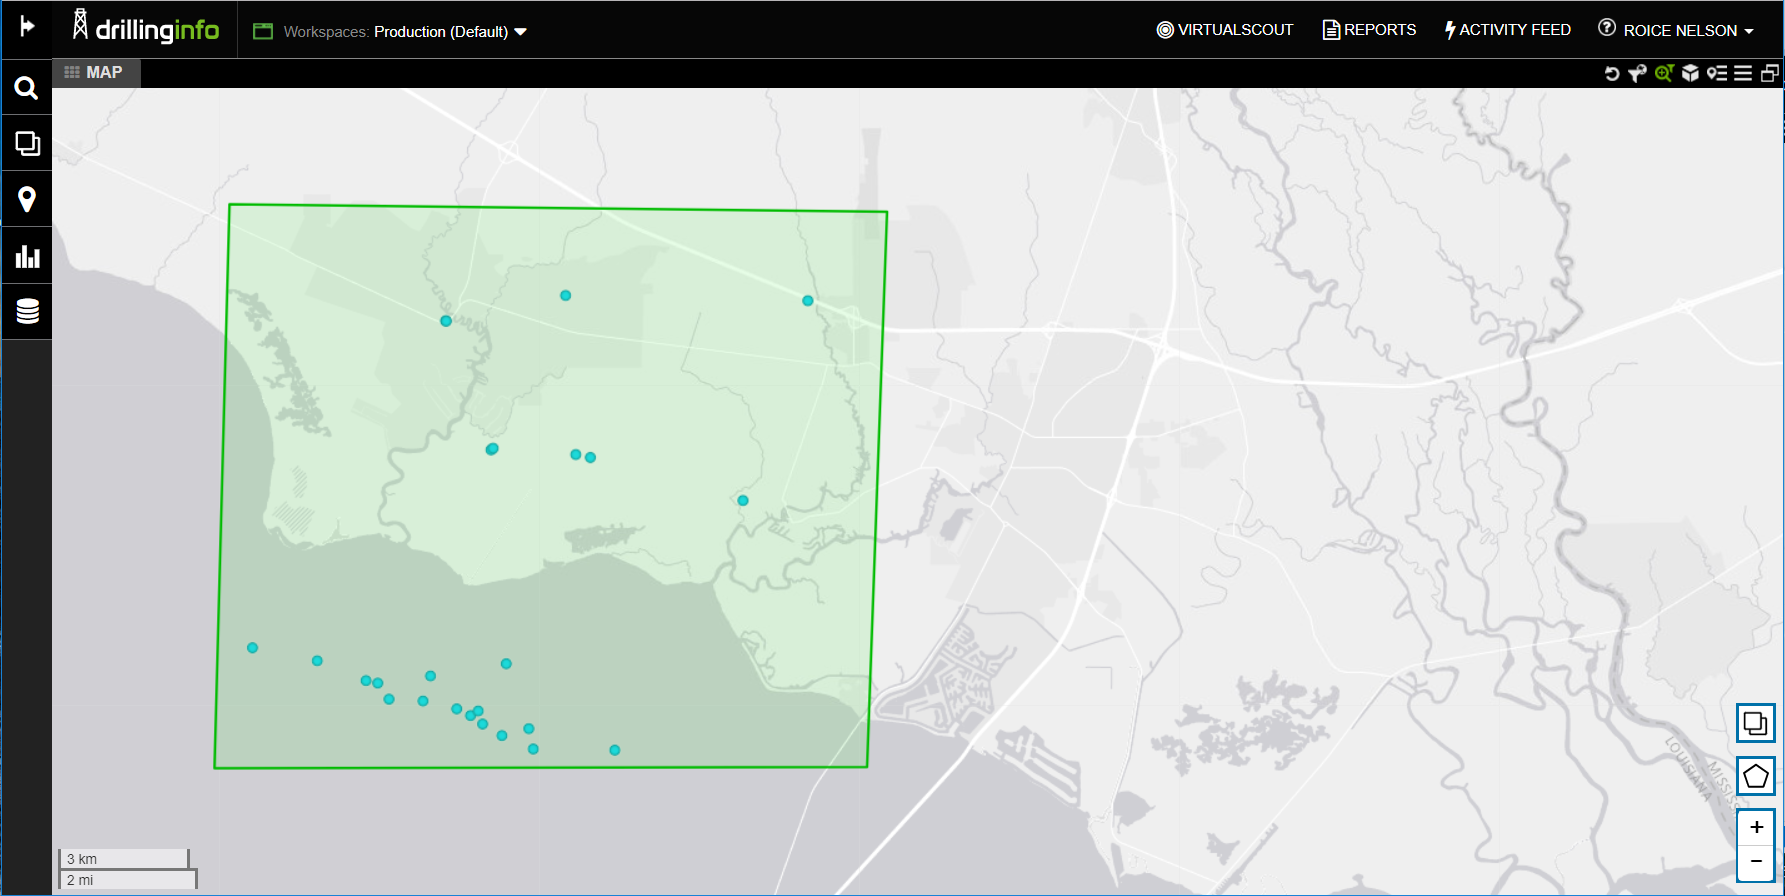
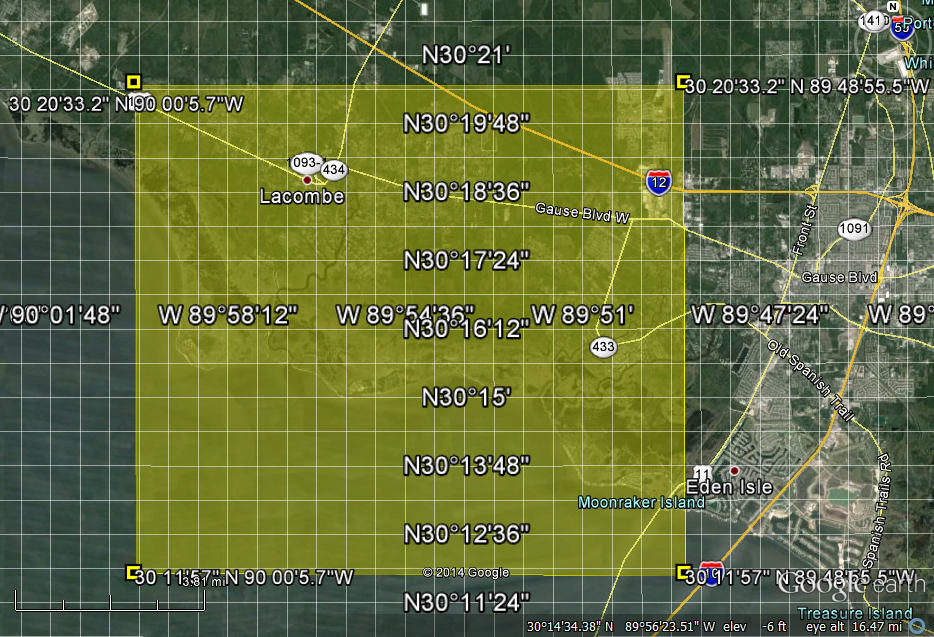
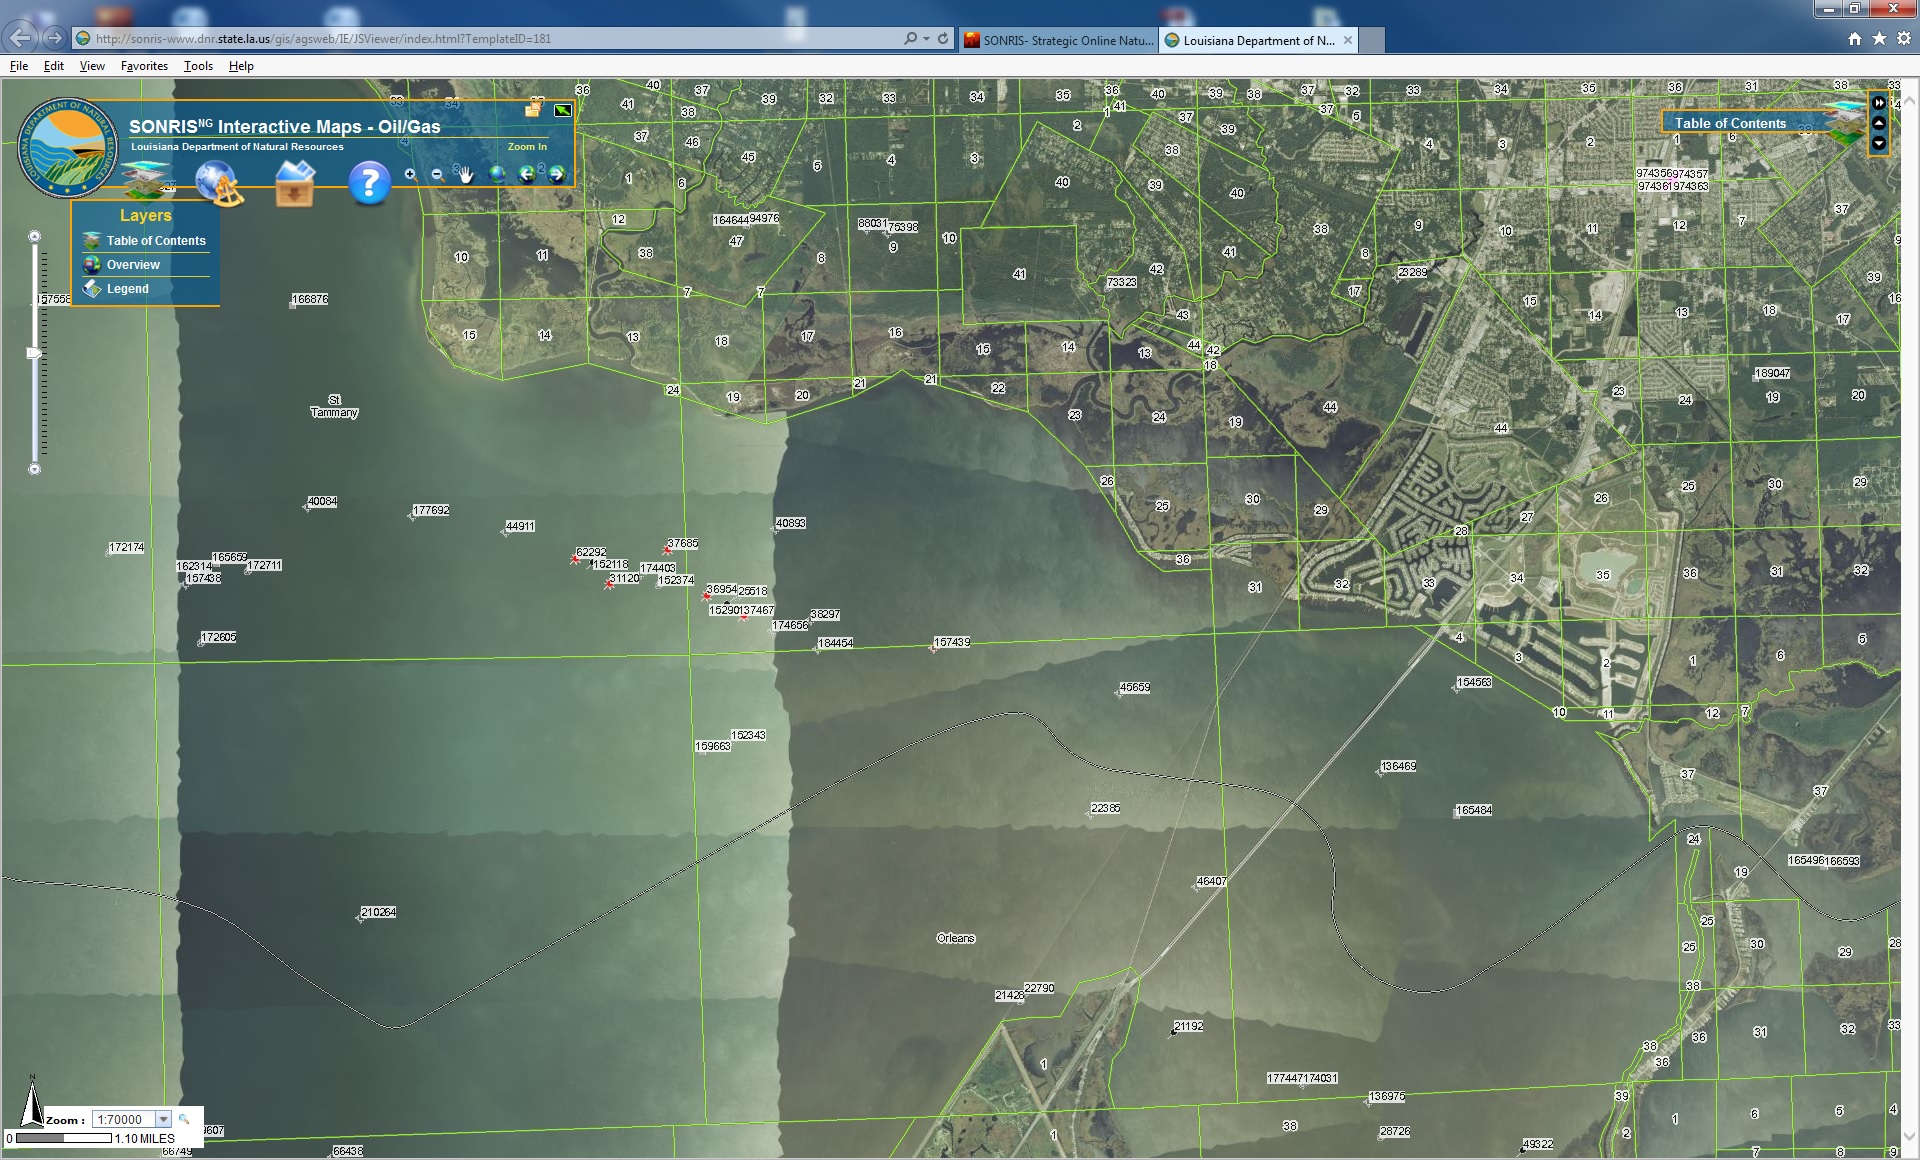
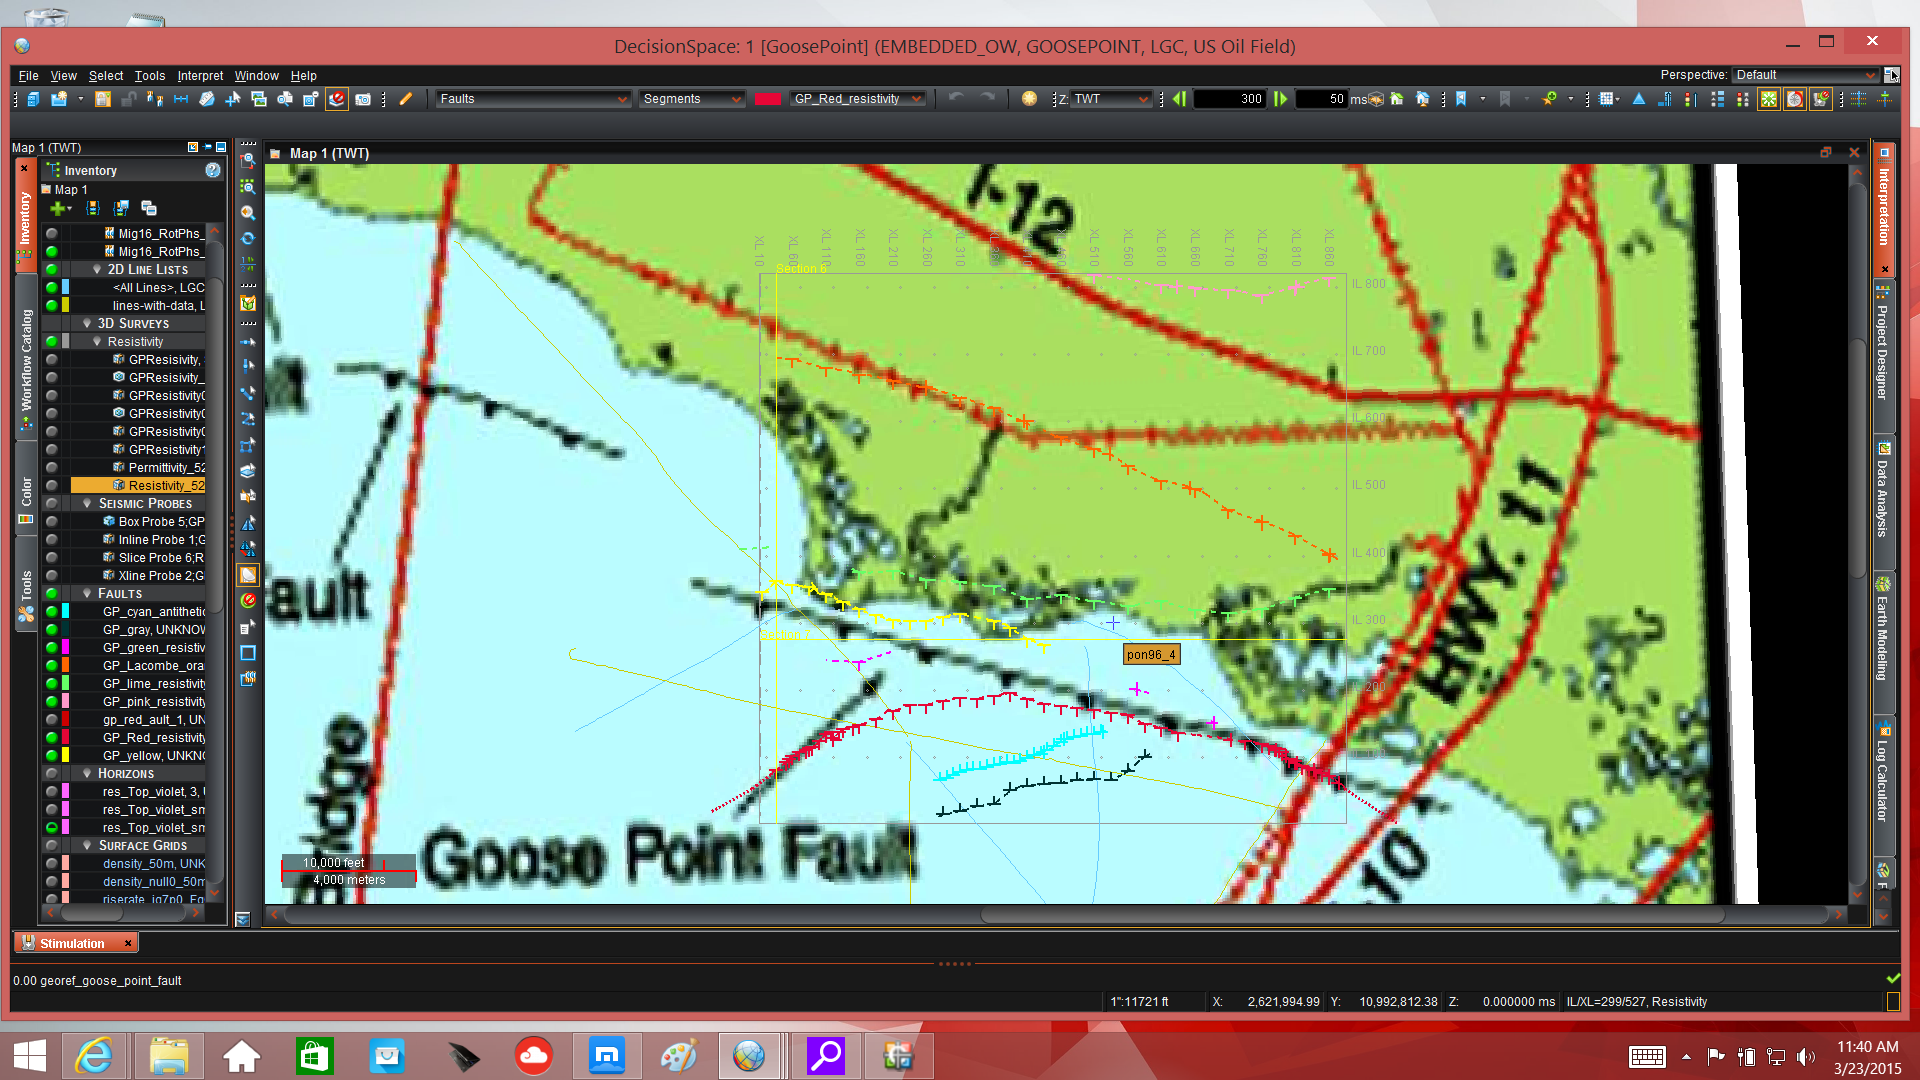
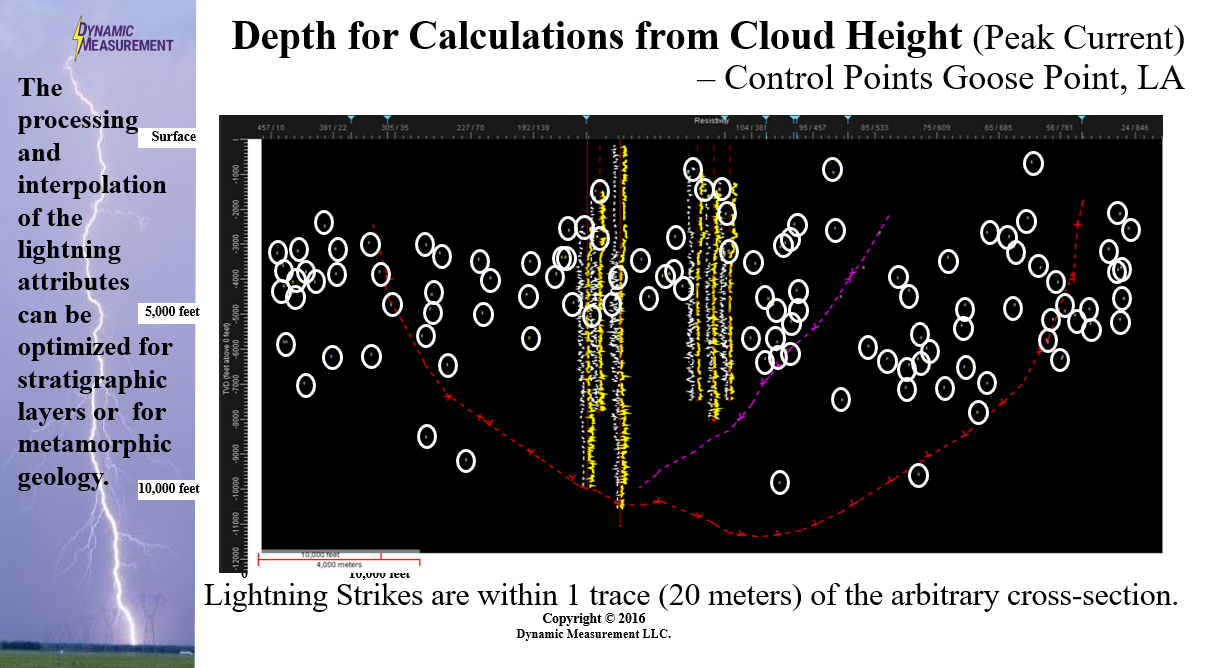
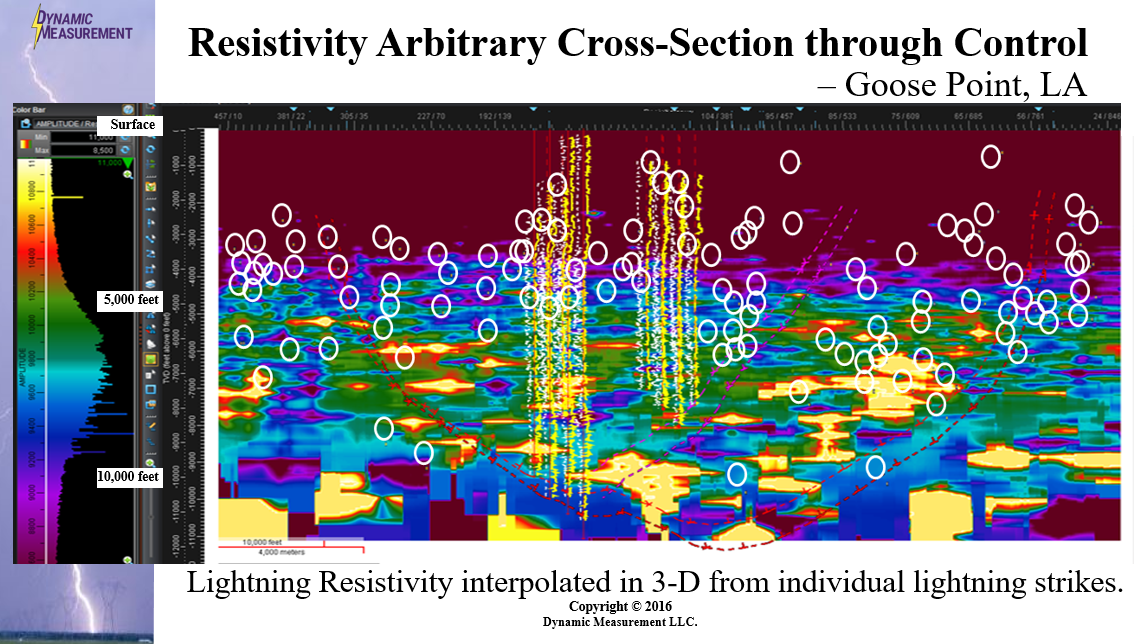
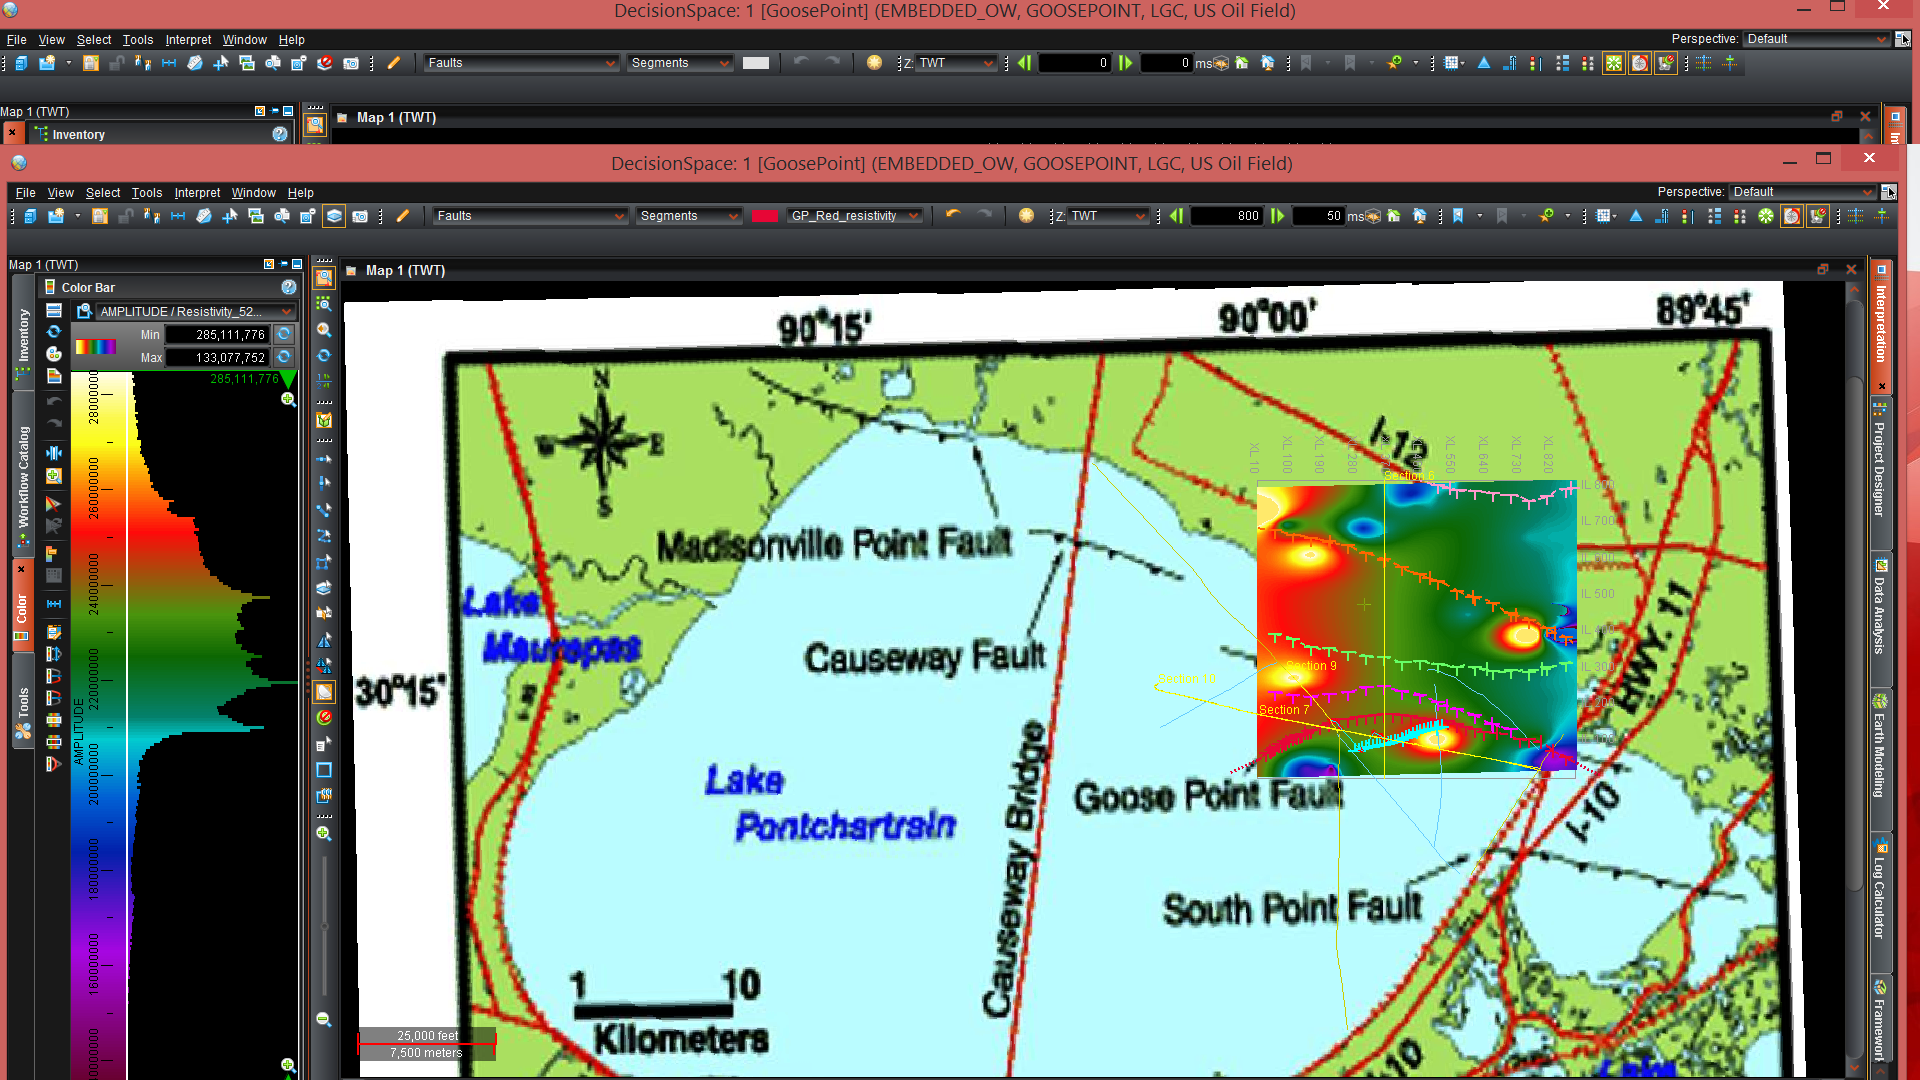
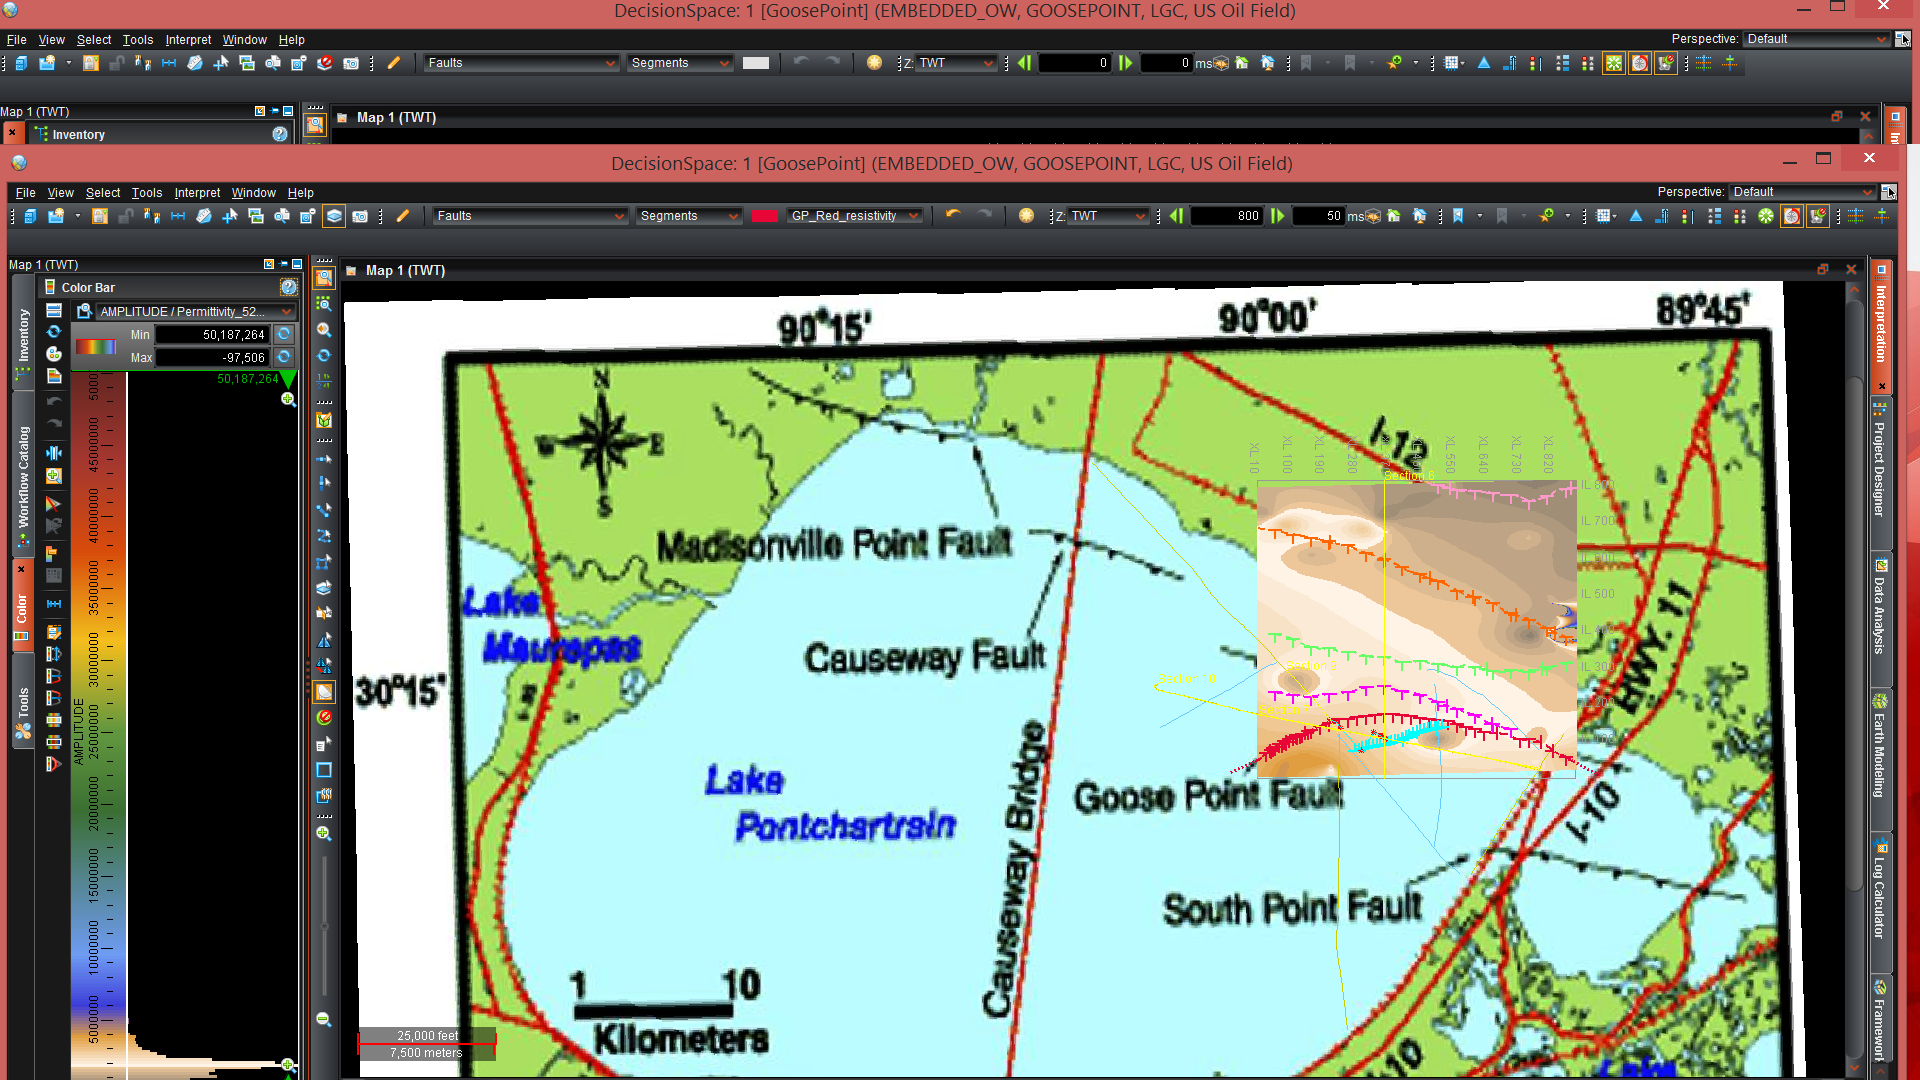
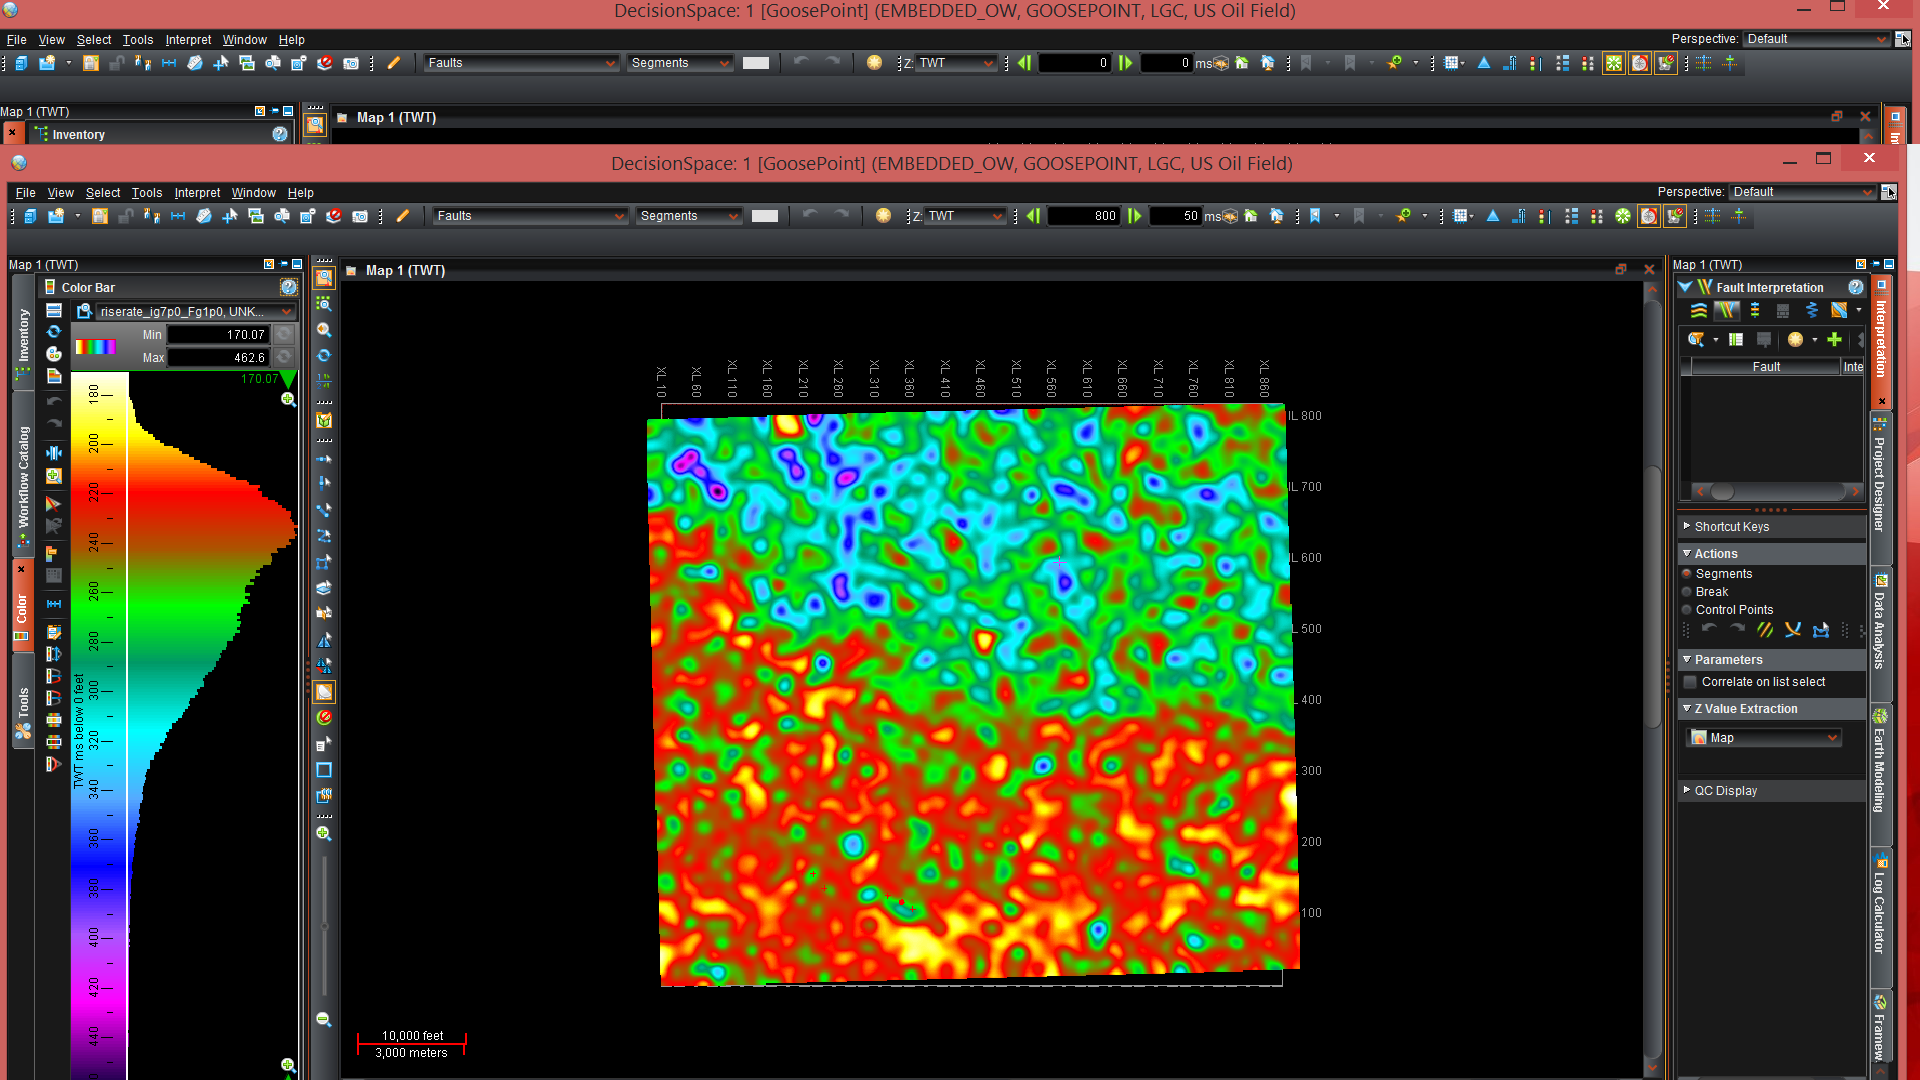
| Location Goose Point Project + Wells, LA | GoogleEarth Extent of Goose Point Project, LA |
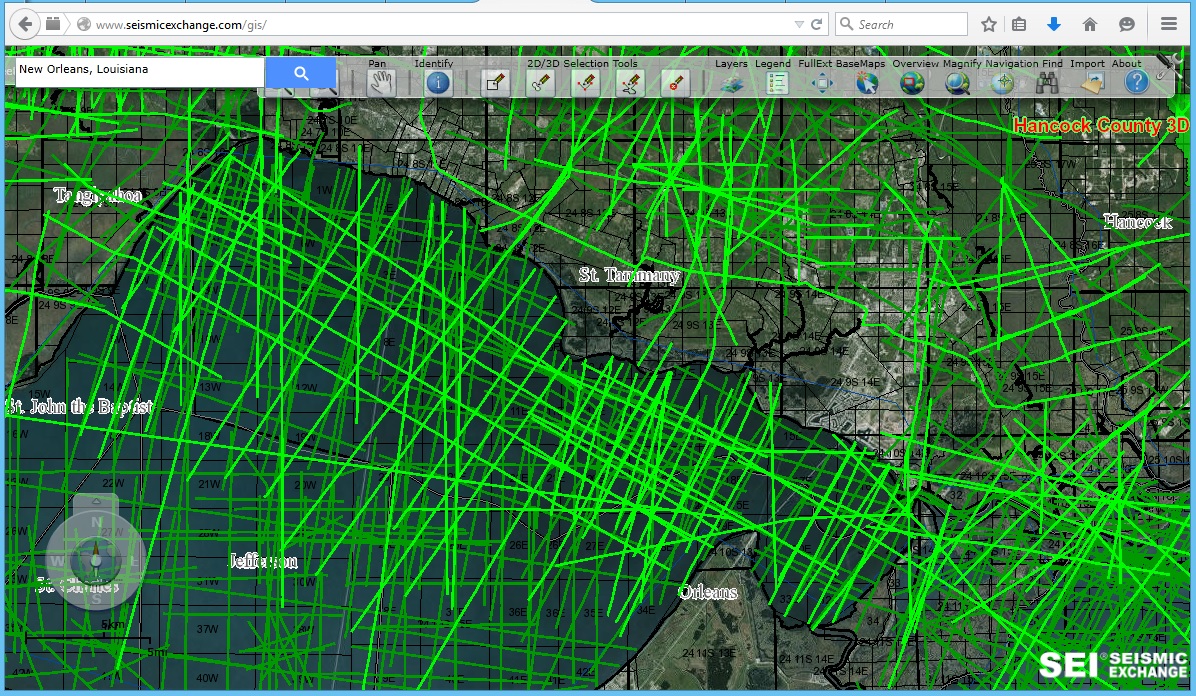
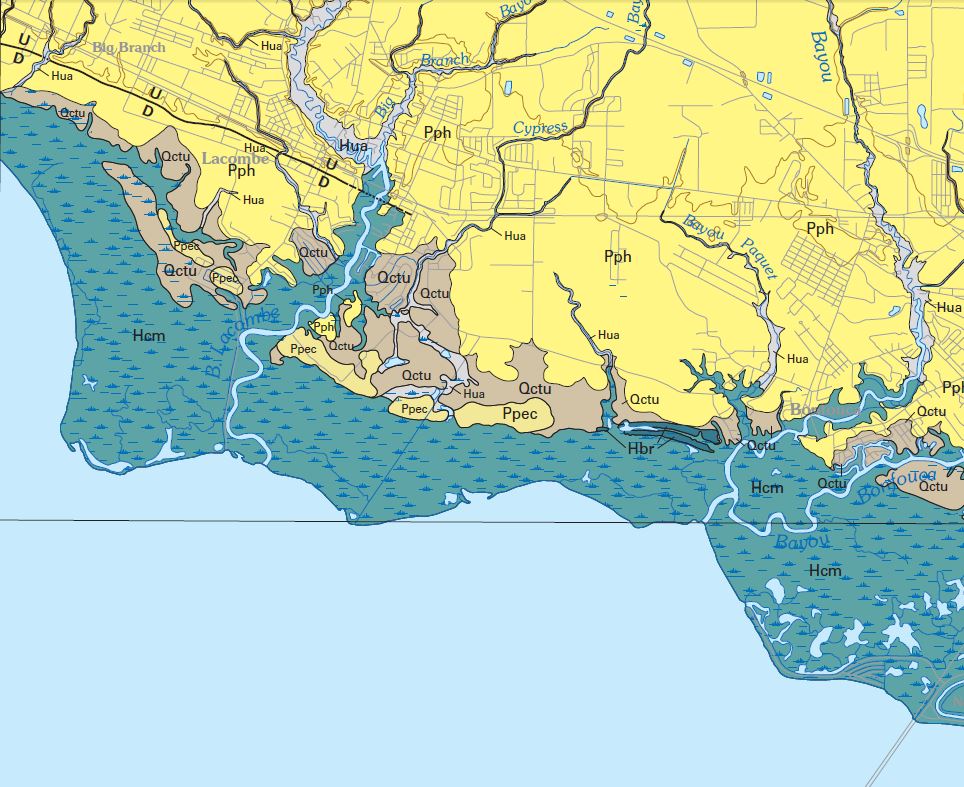
Seismic Exchange Spec Seismic over Goose Point, LA | Geologic Map Goose Point Project, LA |
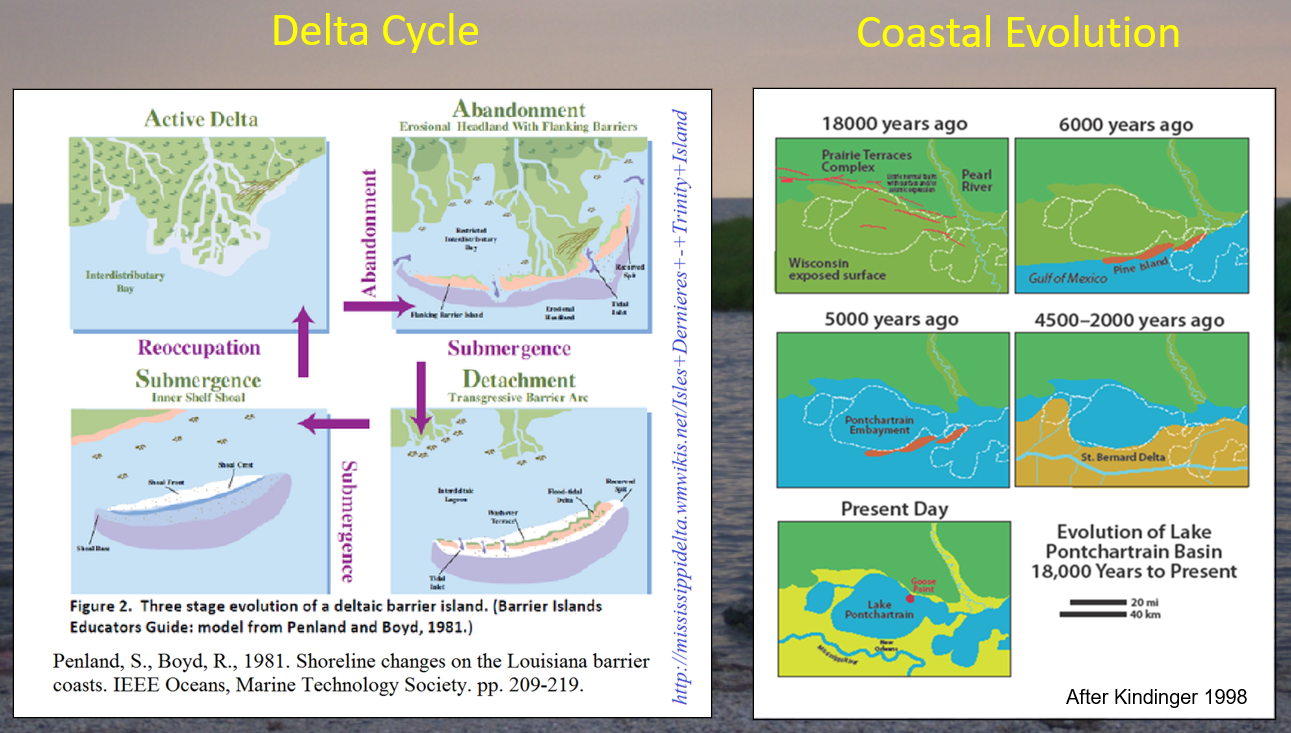
Satellite + Ownership Map, Goose Point, LA | Delta Cycle + Coastal Evolution References |
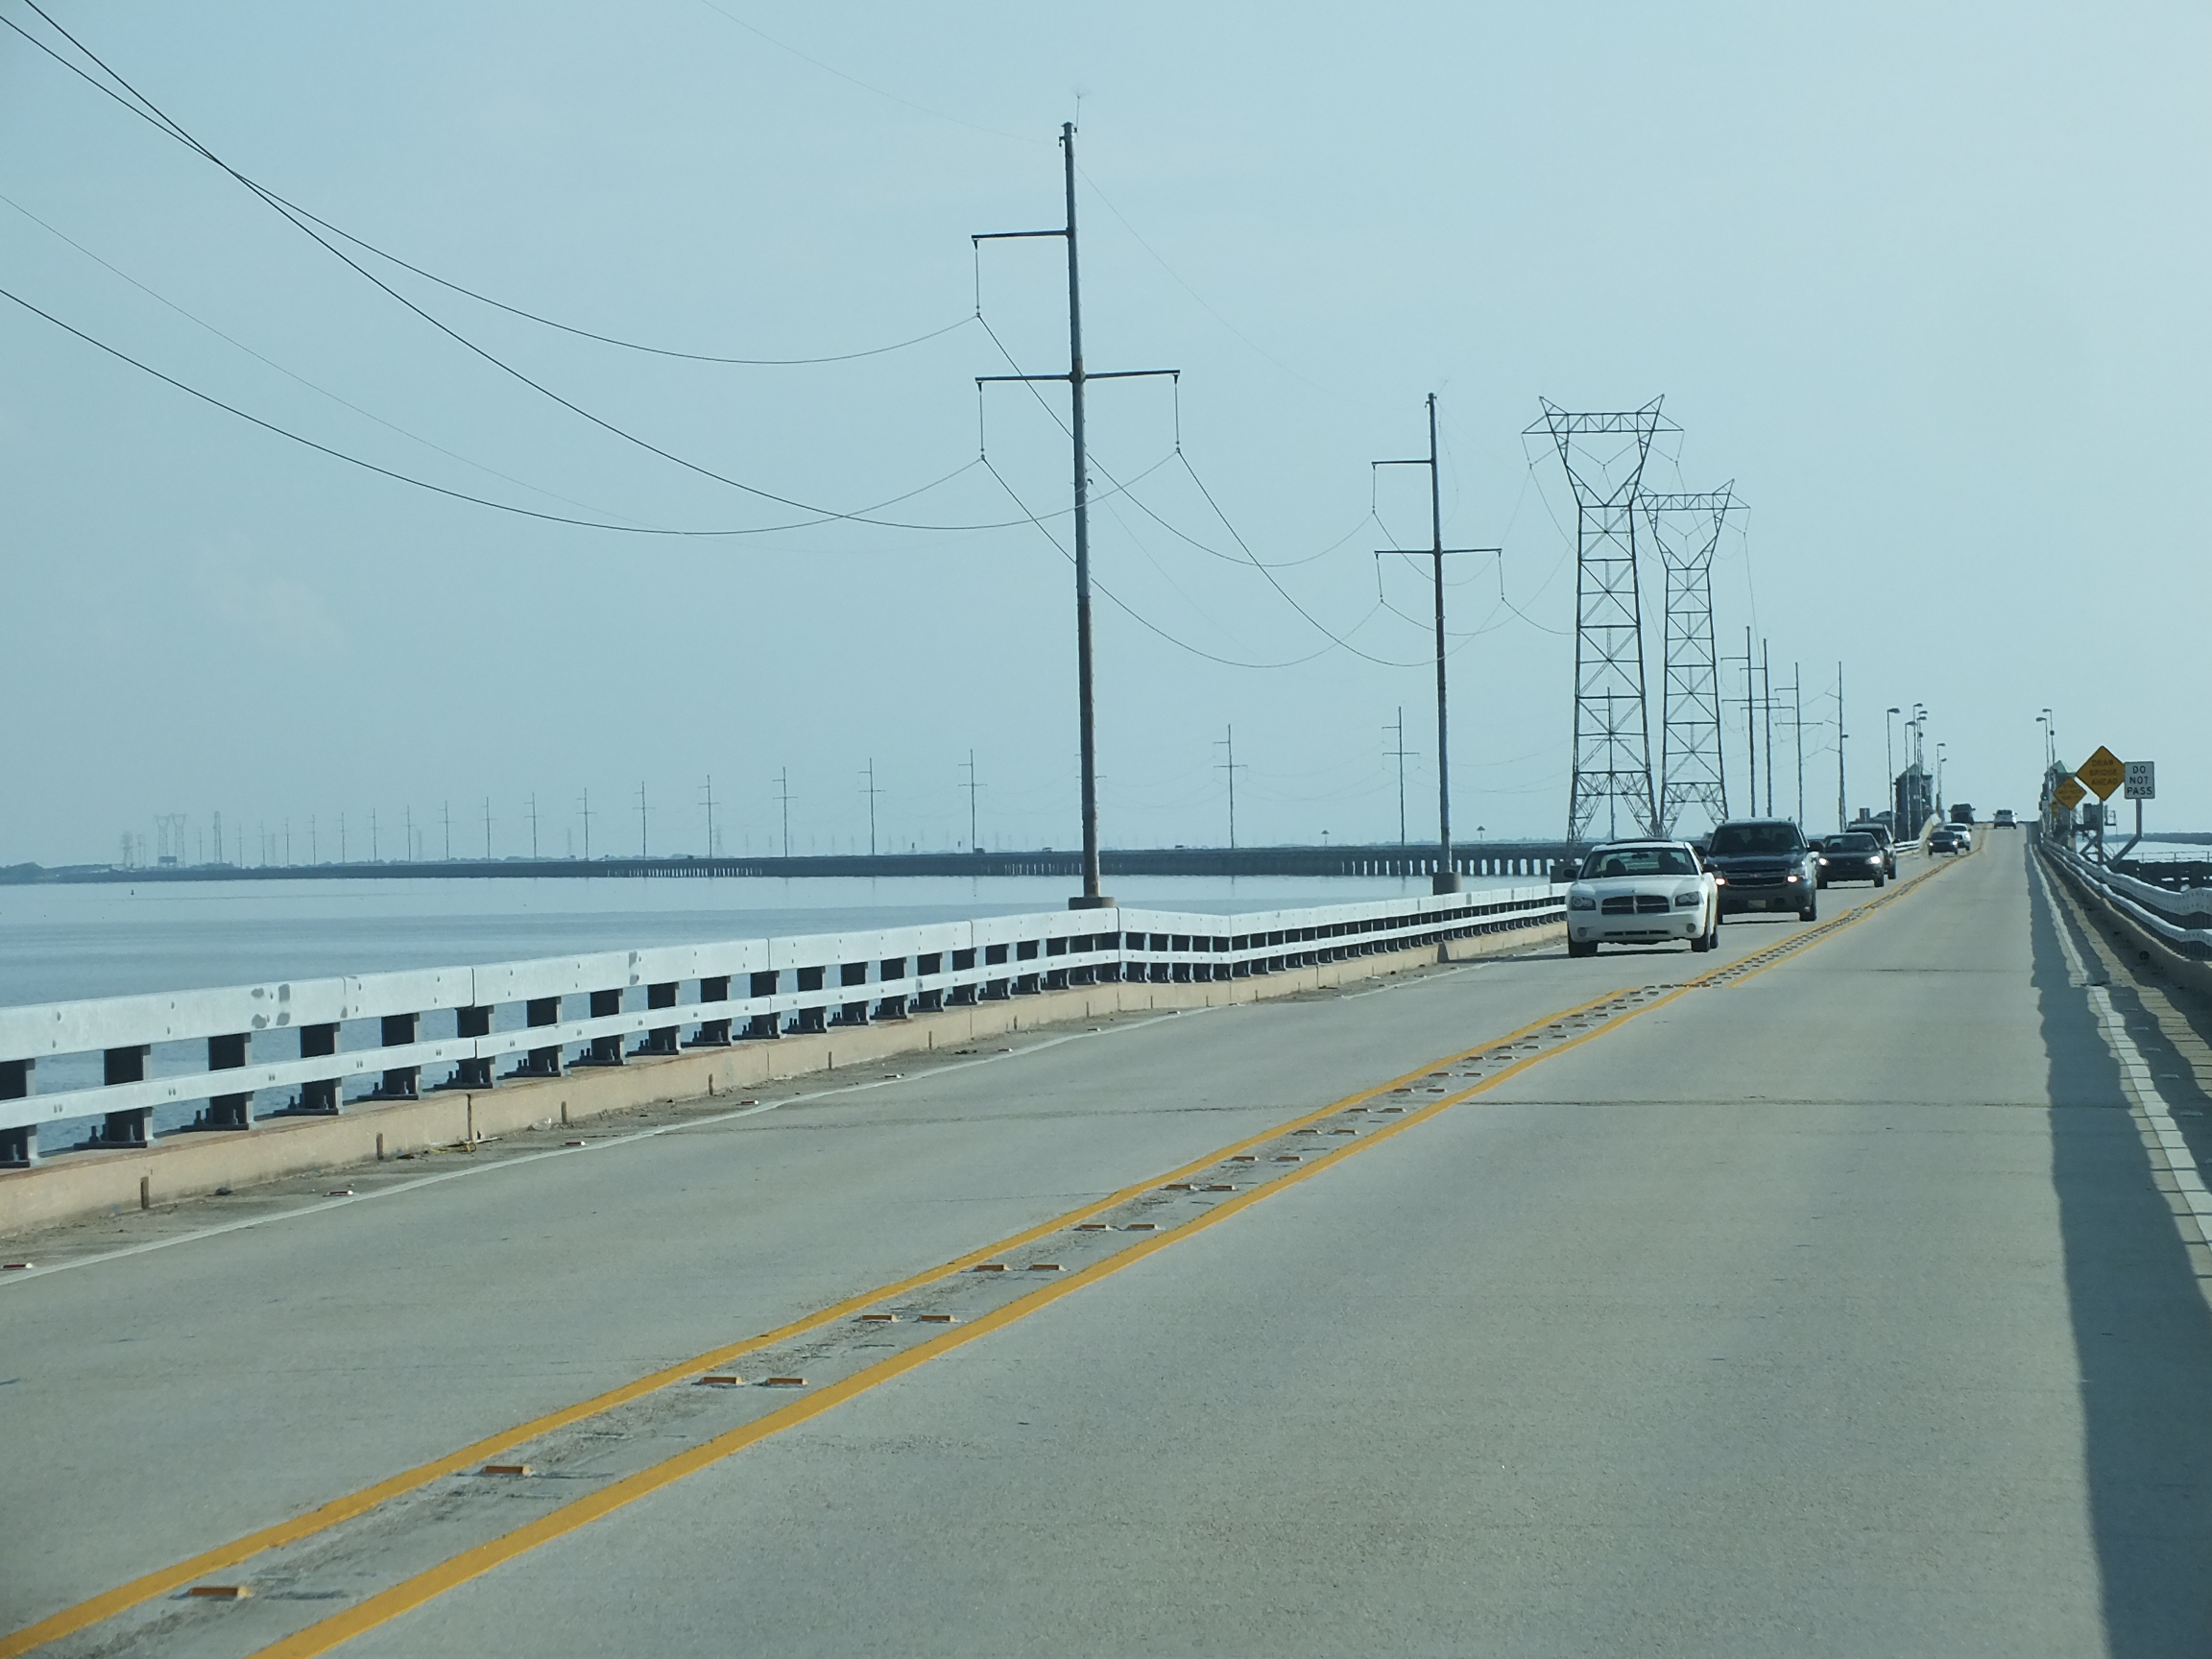
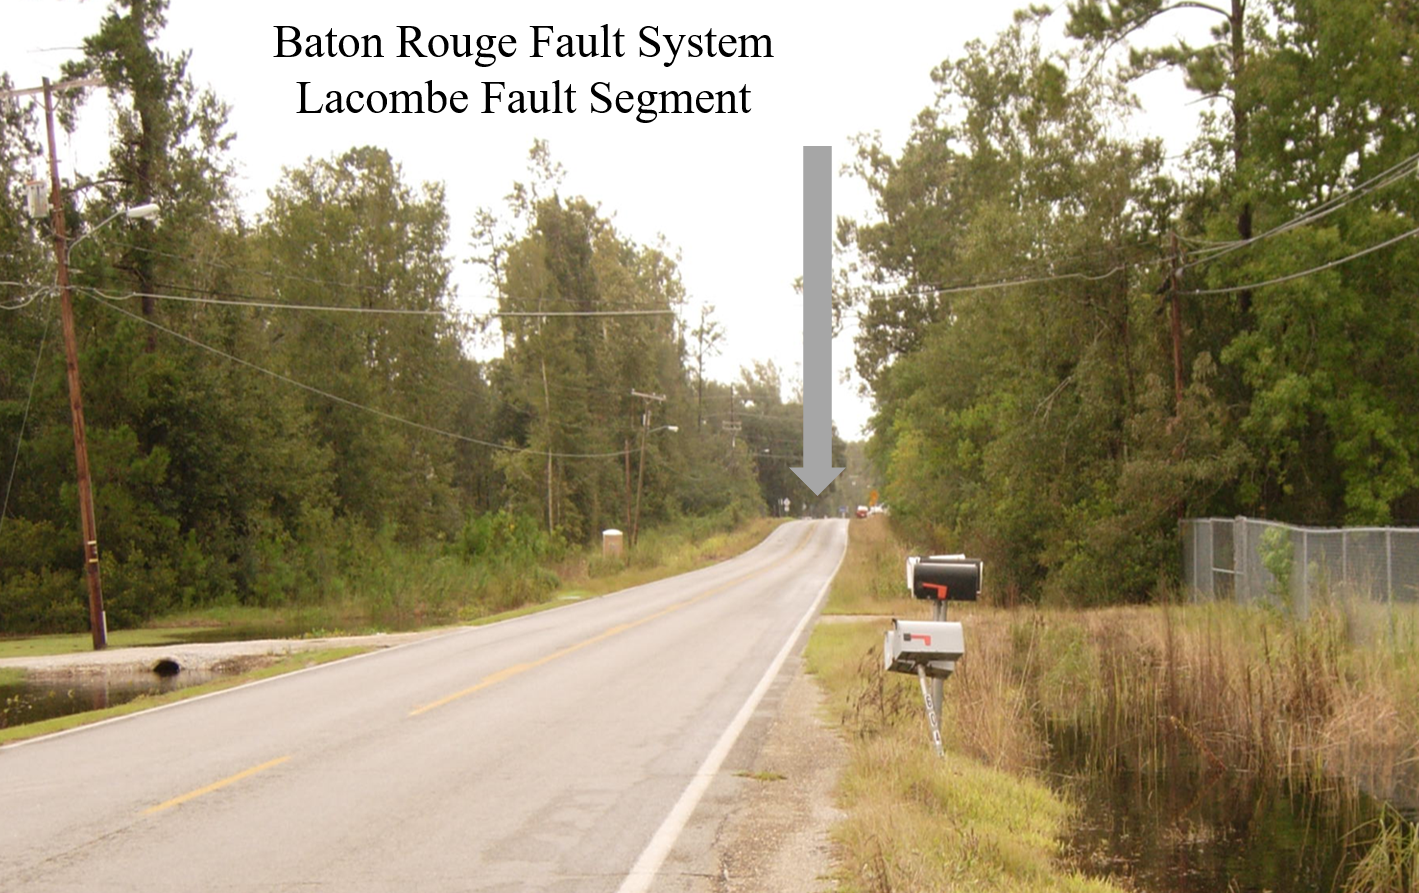
Photo of Fault Impact on Hwy-11 South, LA | Baton Rouge Fault System, Lacombe, LA |
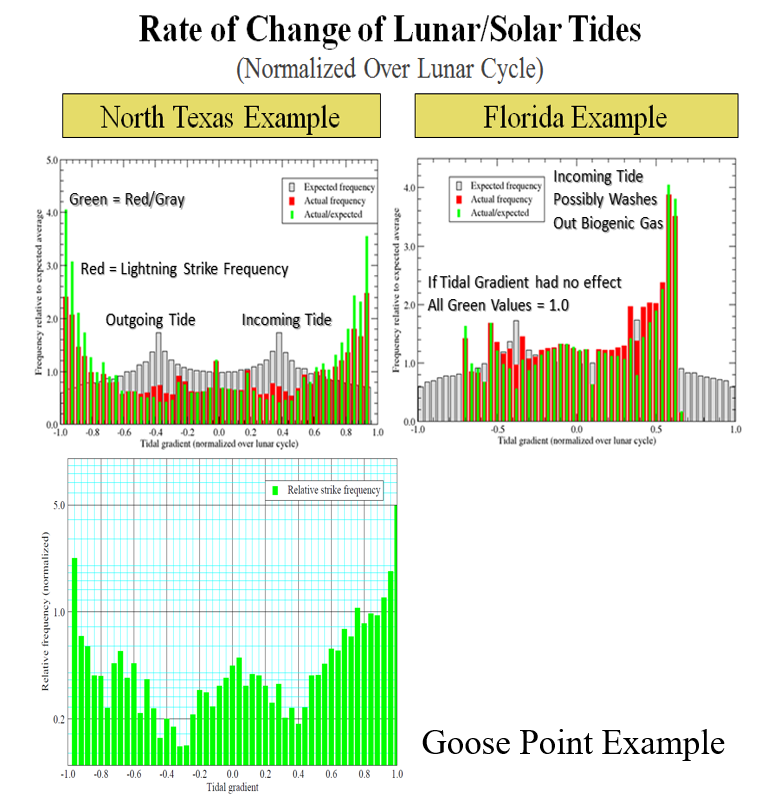
Meander Schrolls Soils Map Goose Point, LA | Rate-of-Change Lunar/Solar Tides TX, FL, LA |
 |  |
 |  |
 |  |
 |  |
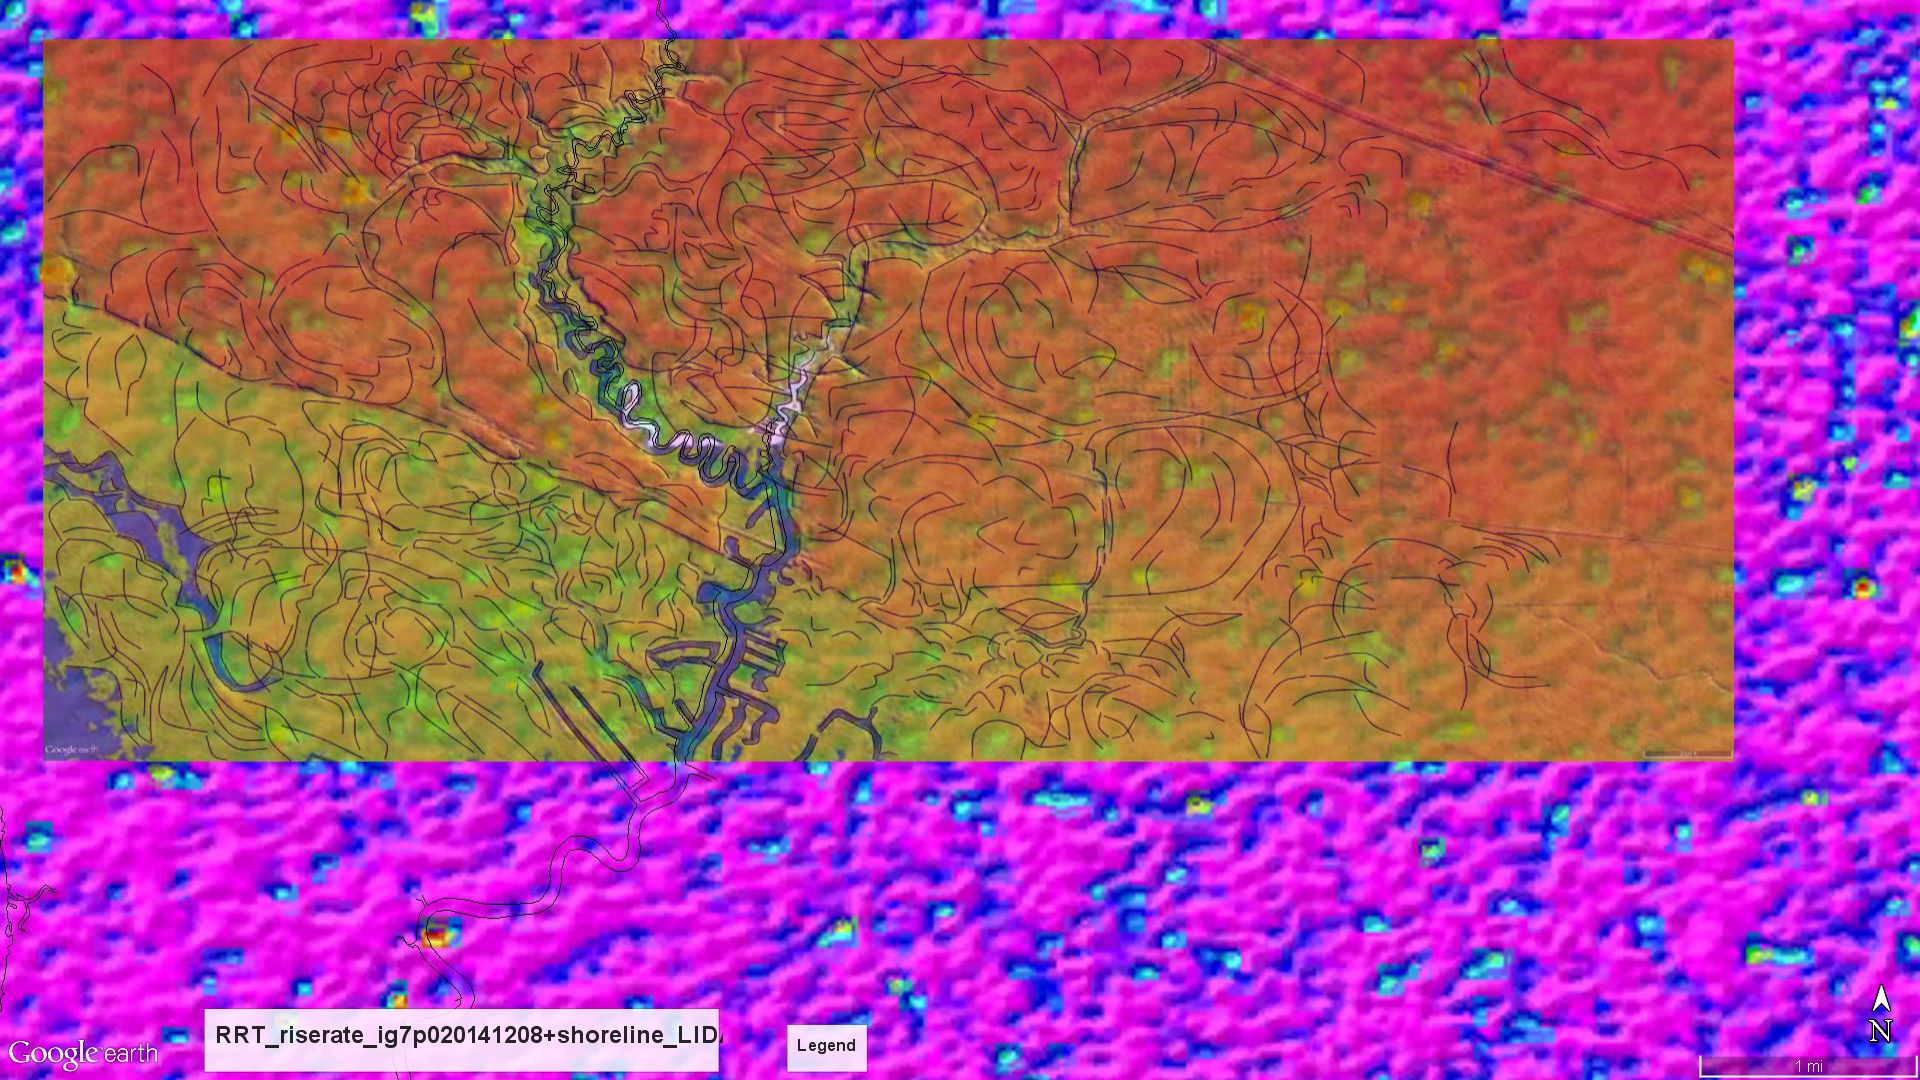 | 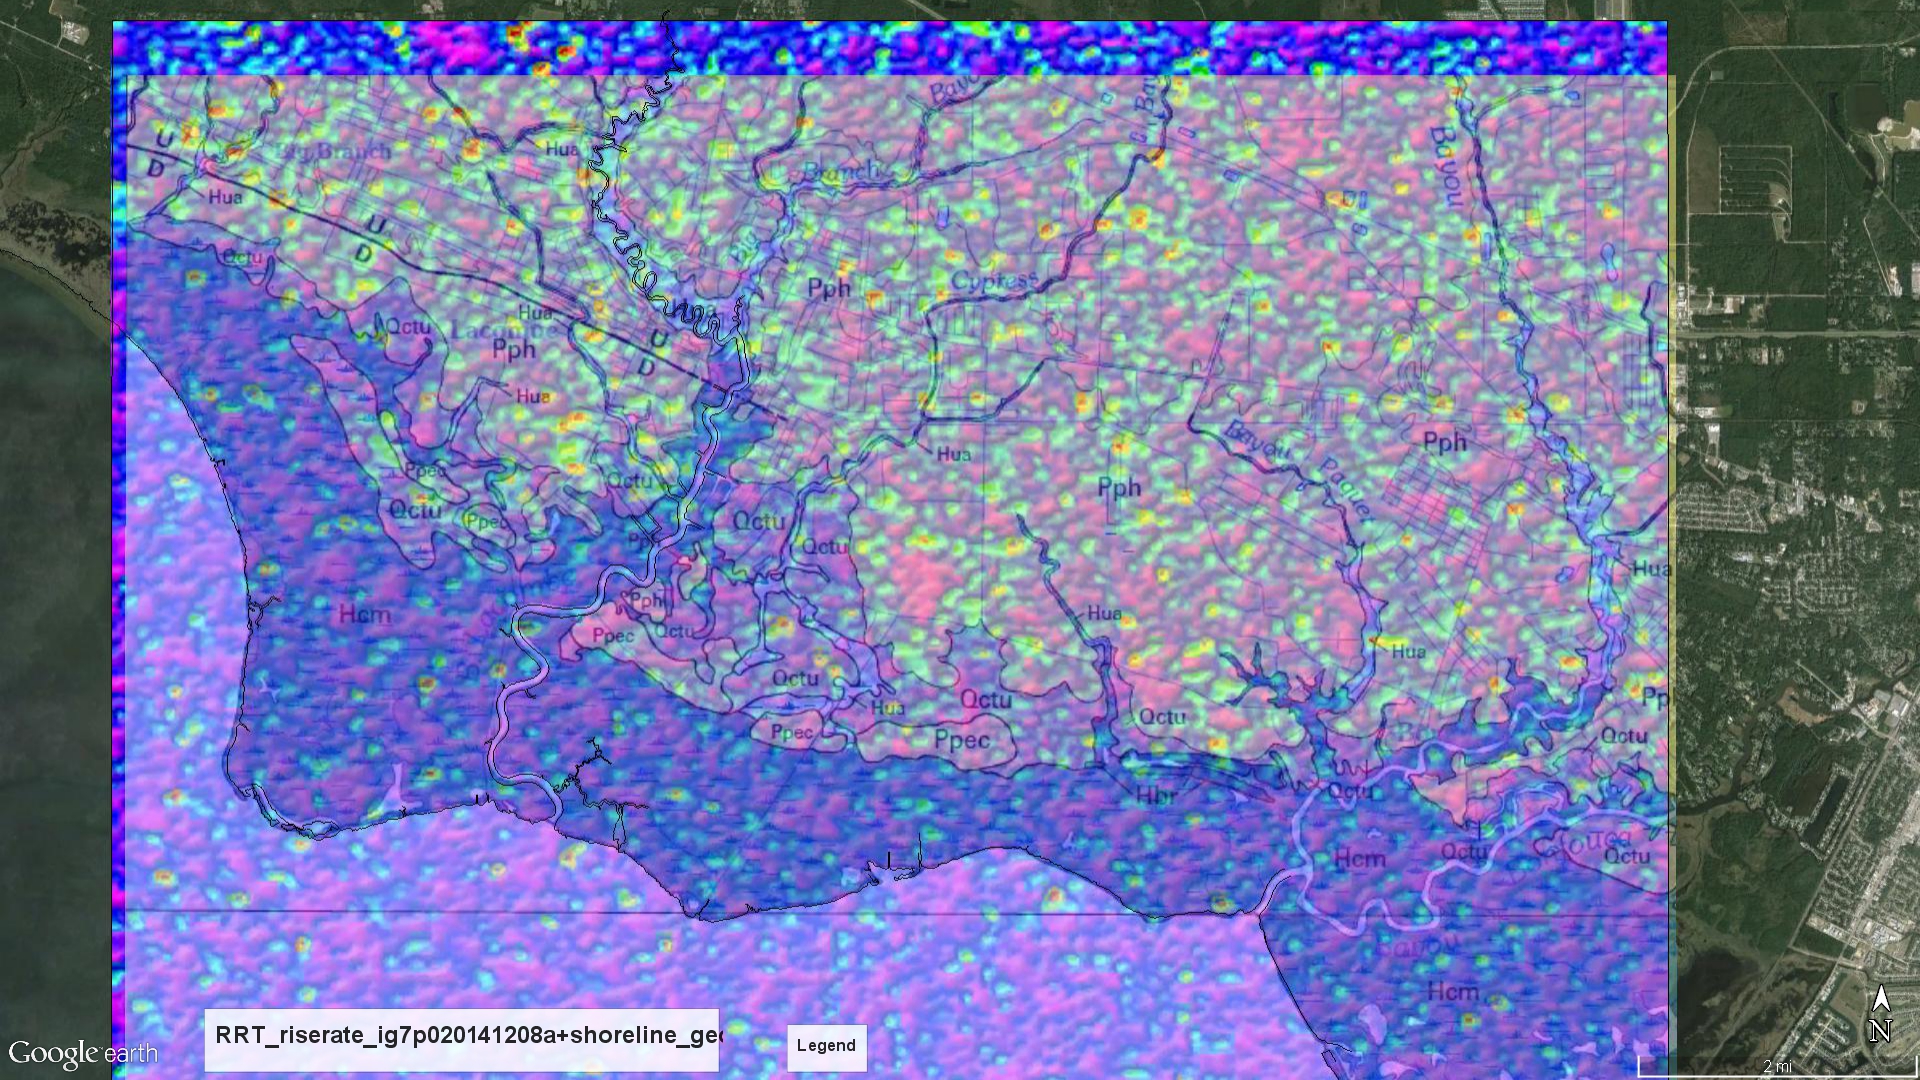 |
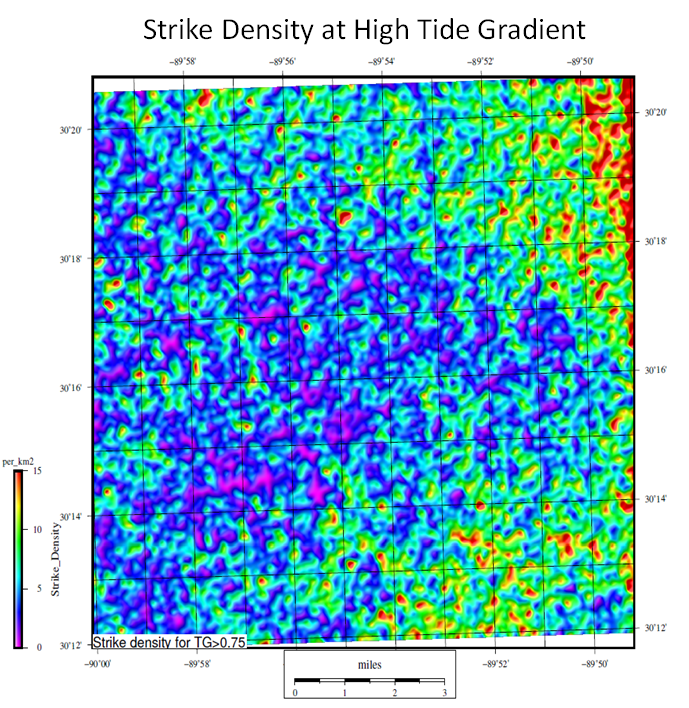
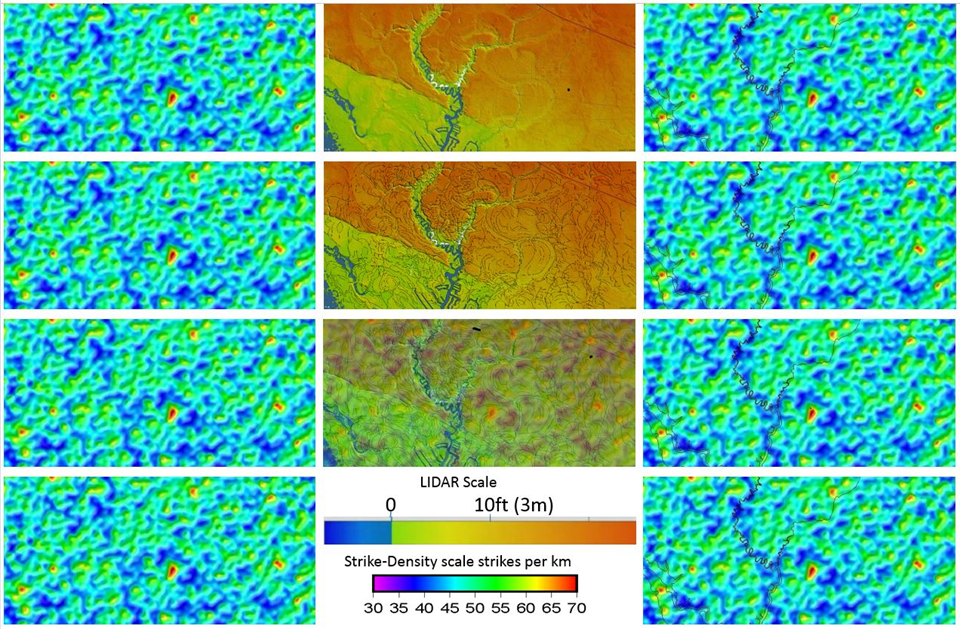
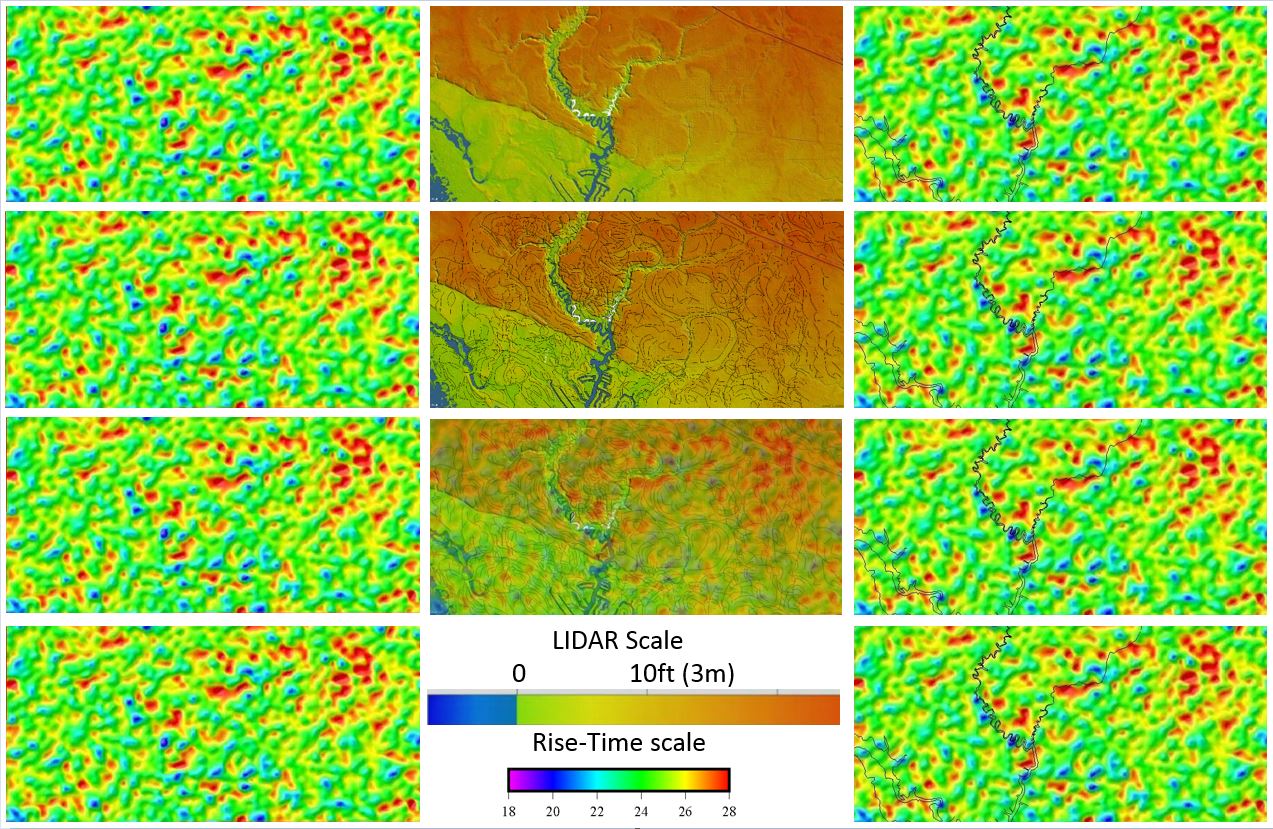
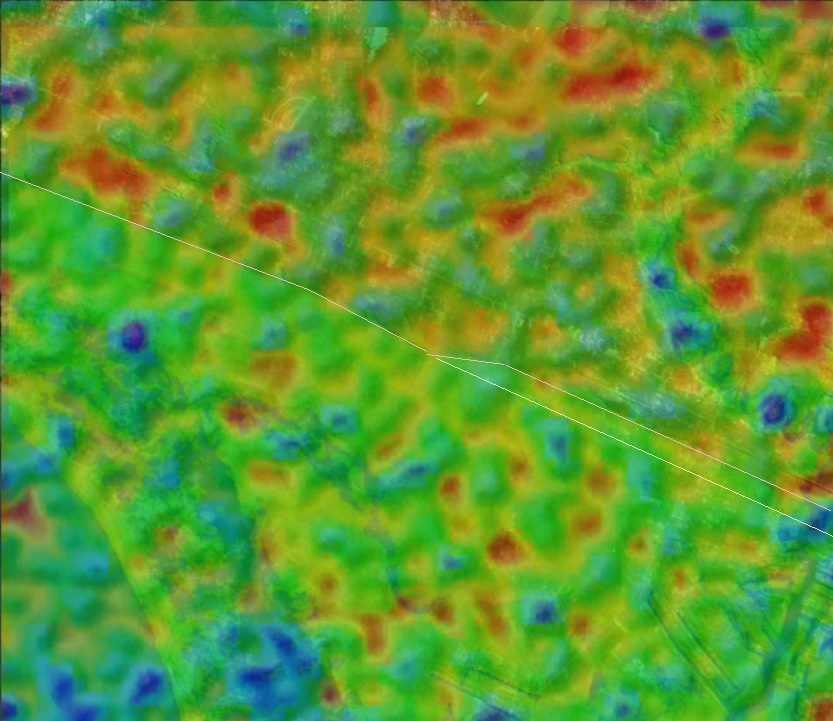
| Strike Density at High Tide Gradient | Strike Density + LIDAR Goose Point, LA |
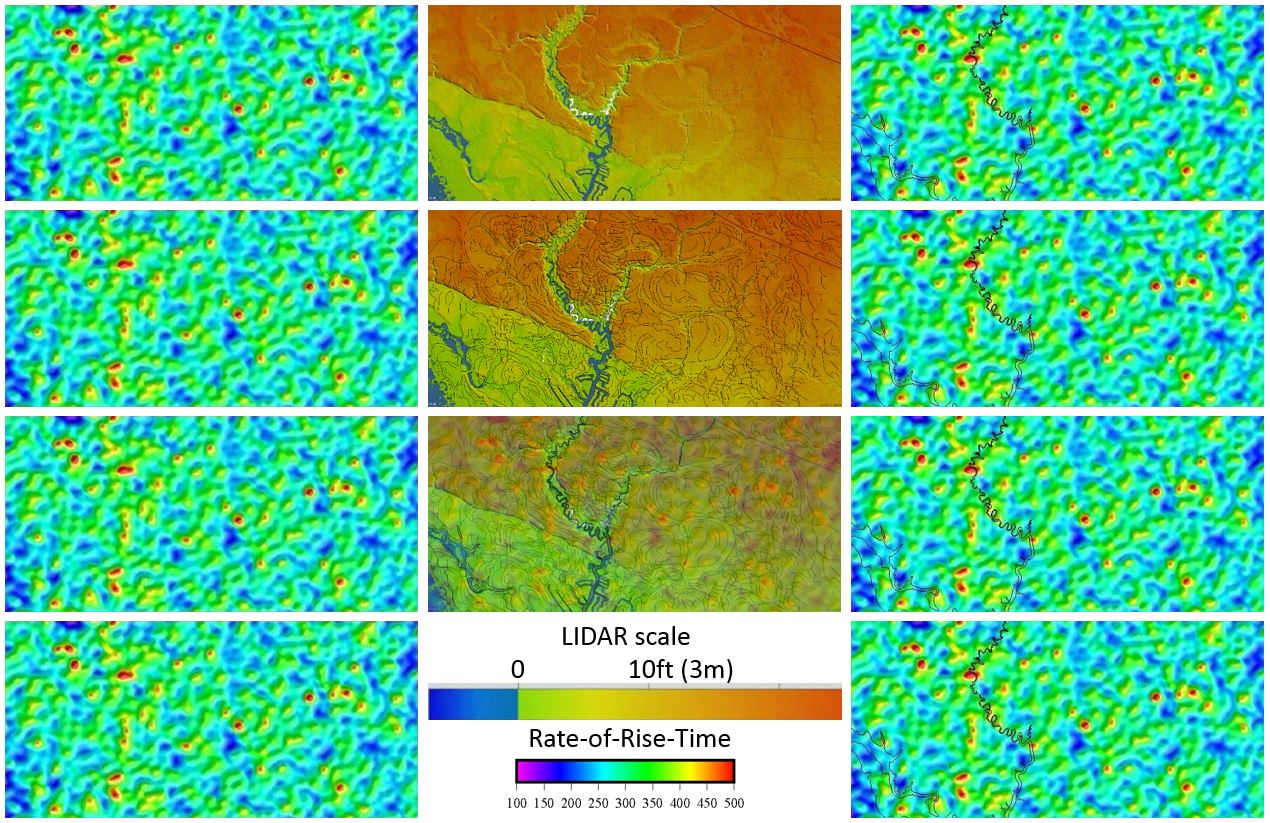
Rise-Time + LIDAR Goose Point, LA | Rate-of-Rise-Time + LIDAR Goose Point, LA |
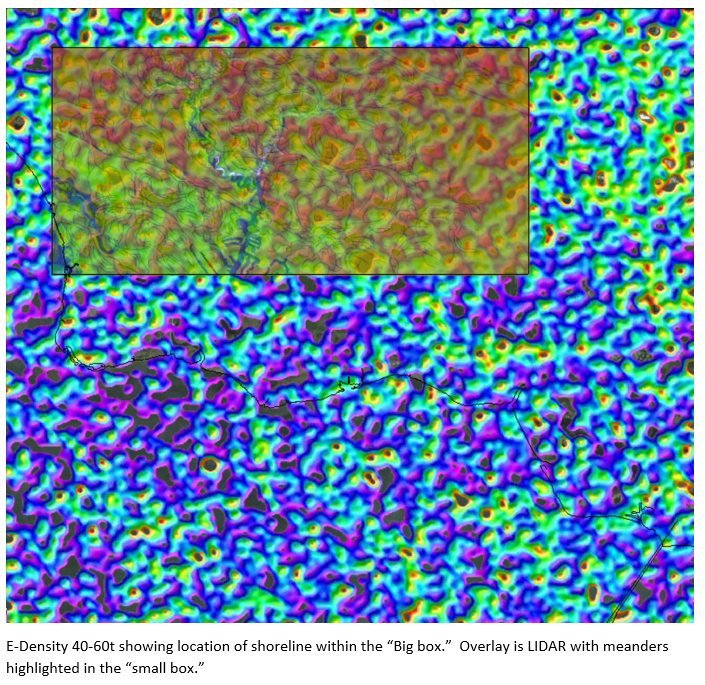
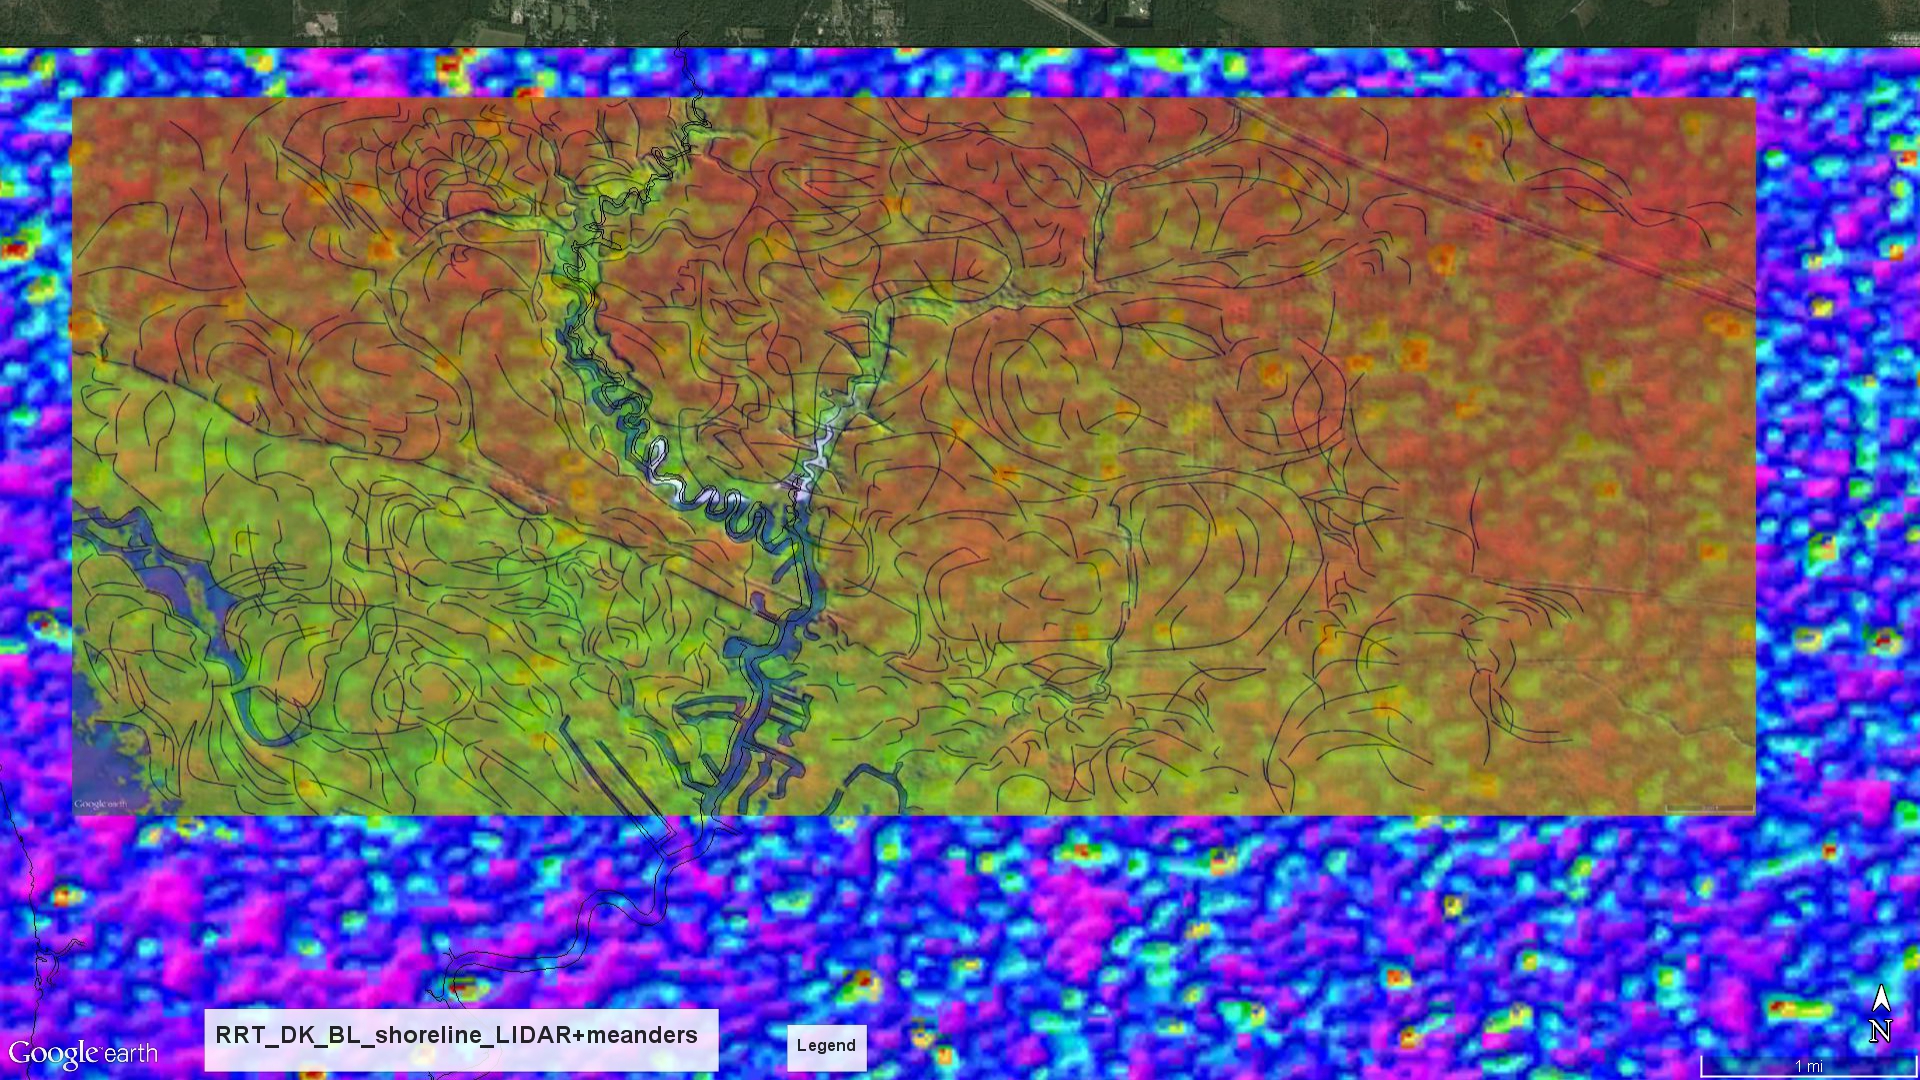
Density + Shoreline + LIDAR Meanders | Rate-of-Rise-Time + LIDAR Goose Point, LA |
Lightning Interpreted Faults over GIS Display | Rise-Time + LIDAR Meanders |
Rate-of-Rise-Time + LIDAR Meanders | Rate-of-Rise-Time + Geologic Map |
 |  |
 |  |
 |  |
 |  |
 |  |
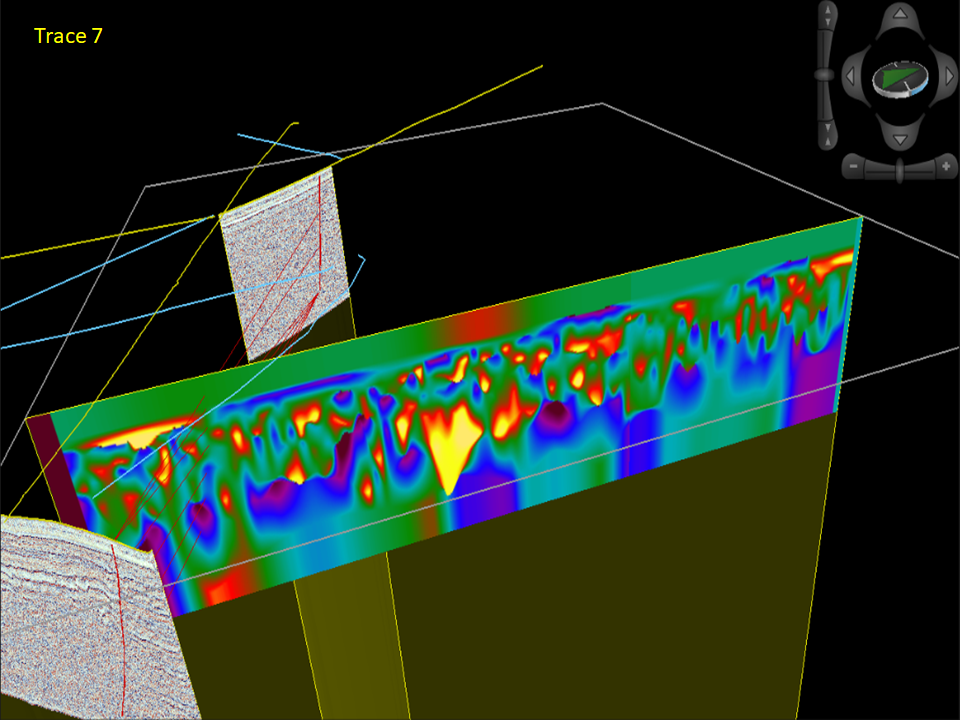
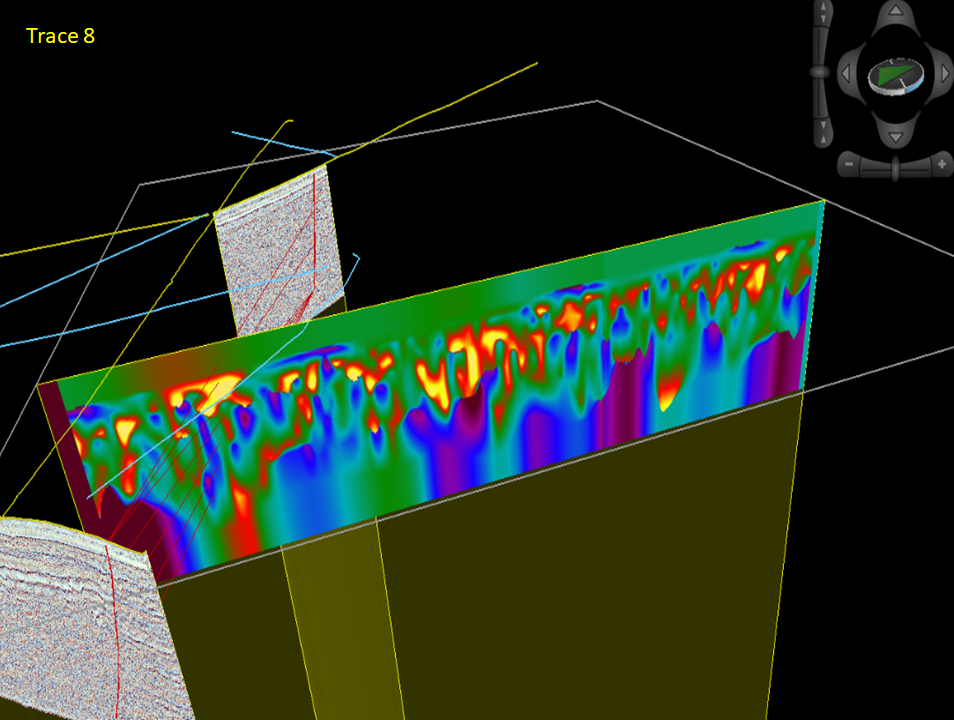
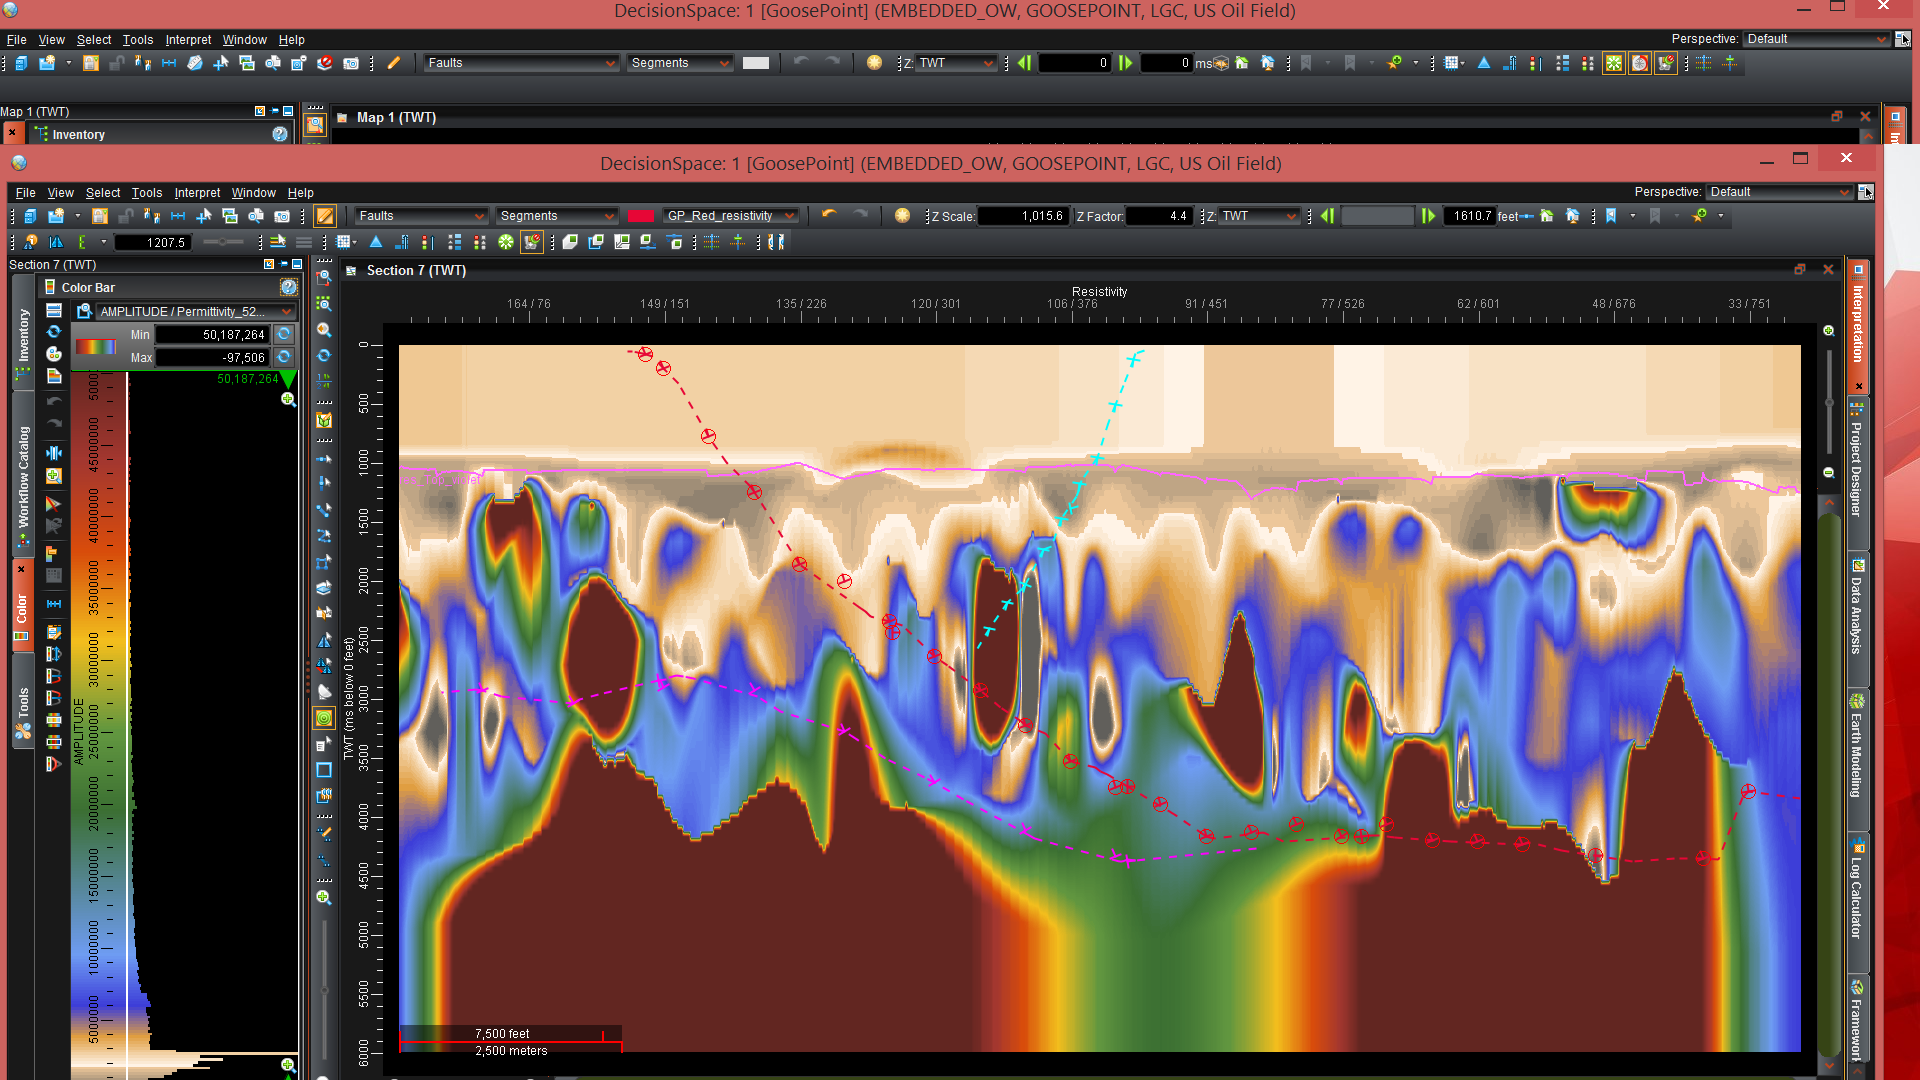
| Trace 7 Apparent Resistivity + 2 Sparker Lines | Trace 8 Apparent Resistivity + 2 Sparker Lines |
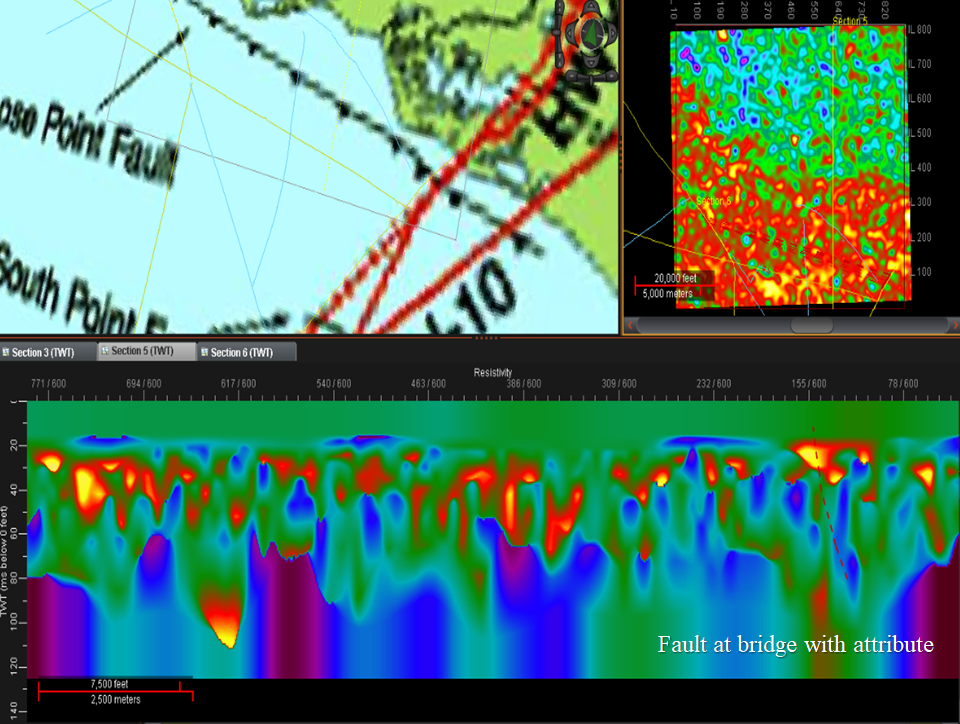
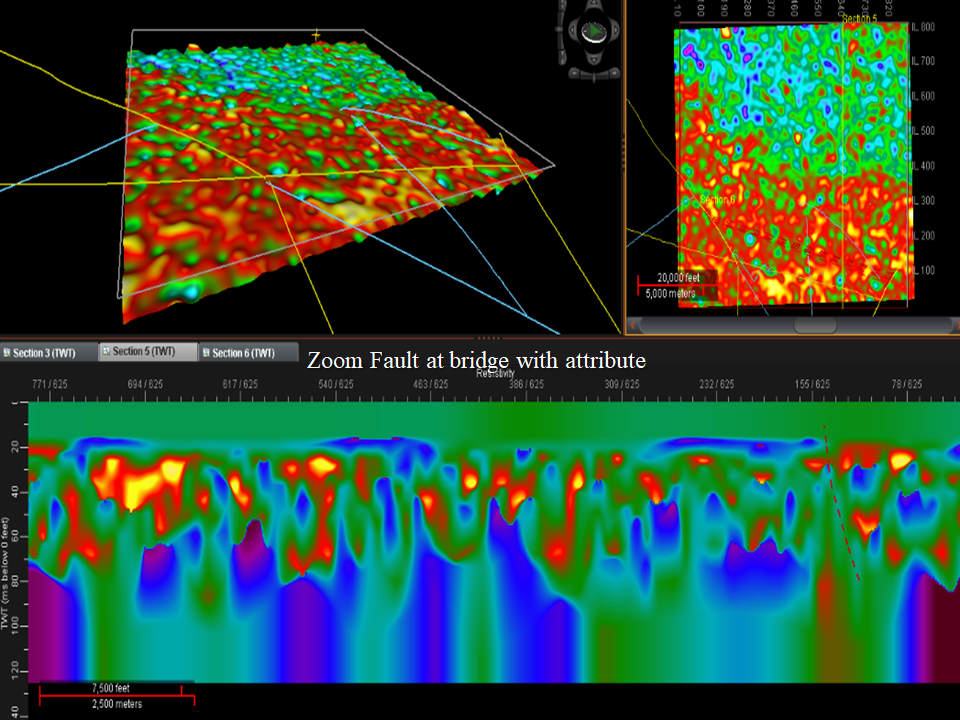
Resistivity at bridge fault + Rise-Rate Map | Resistivity at bridge fault + R-Rate Displays |
Apparent Resisitivity + Well Logs + Faults | Sparker + Apparent Resistivity+Faults |
Sparker + Apparent Permittivity+Faults | Apparent Resistivity Strike Line Orange Fault |
Lighting Control Points + Logs + Faults | Apparent Resisitivty + Logs + Faults |
  |
  |
  |
  |
  |
  |
  |
  |
  |
  |
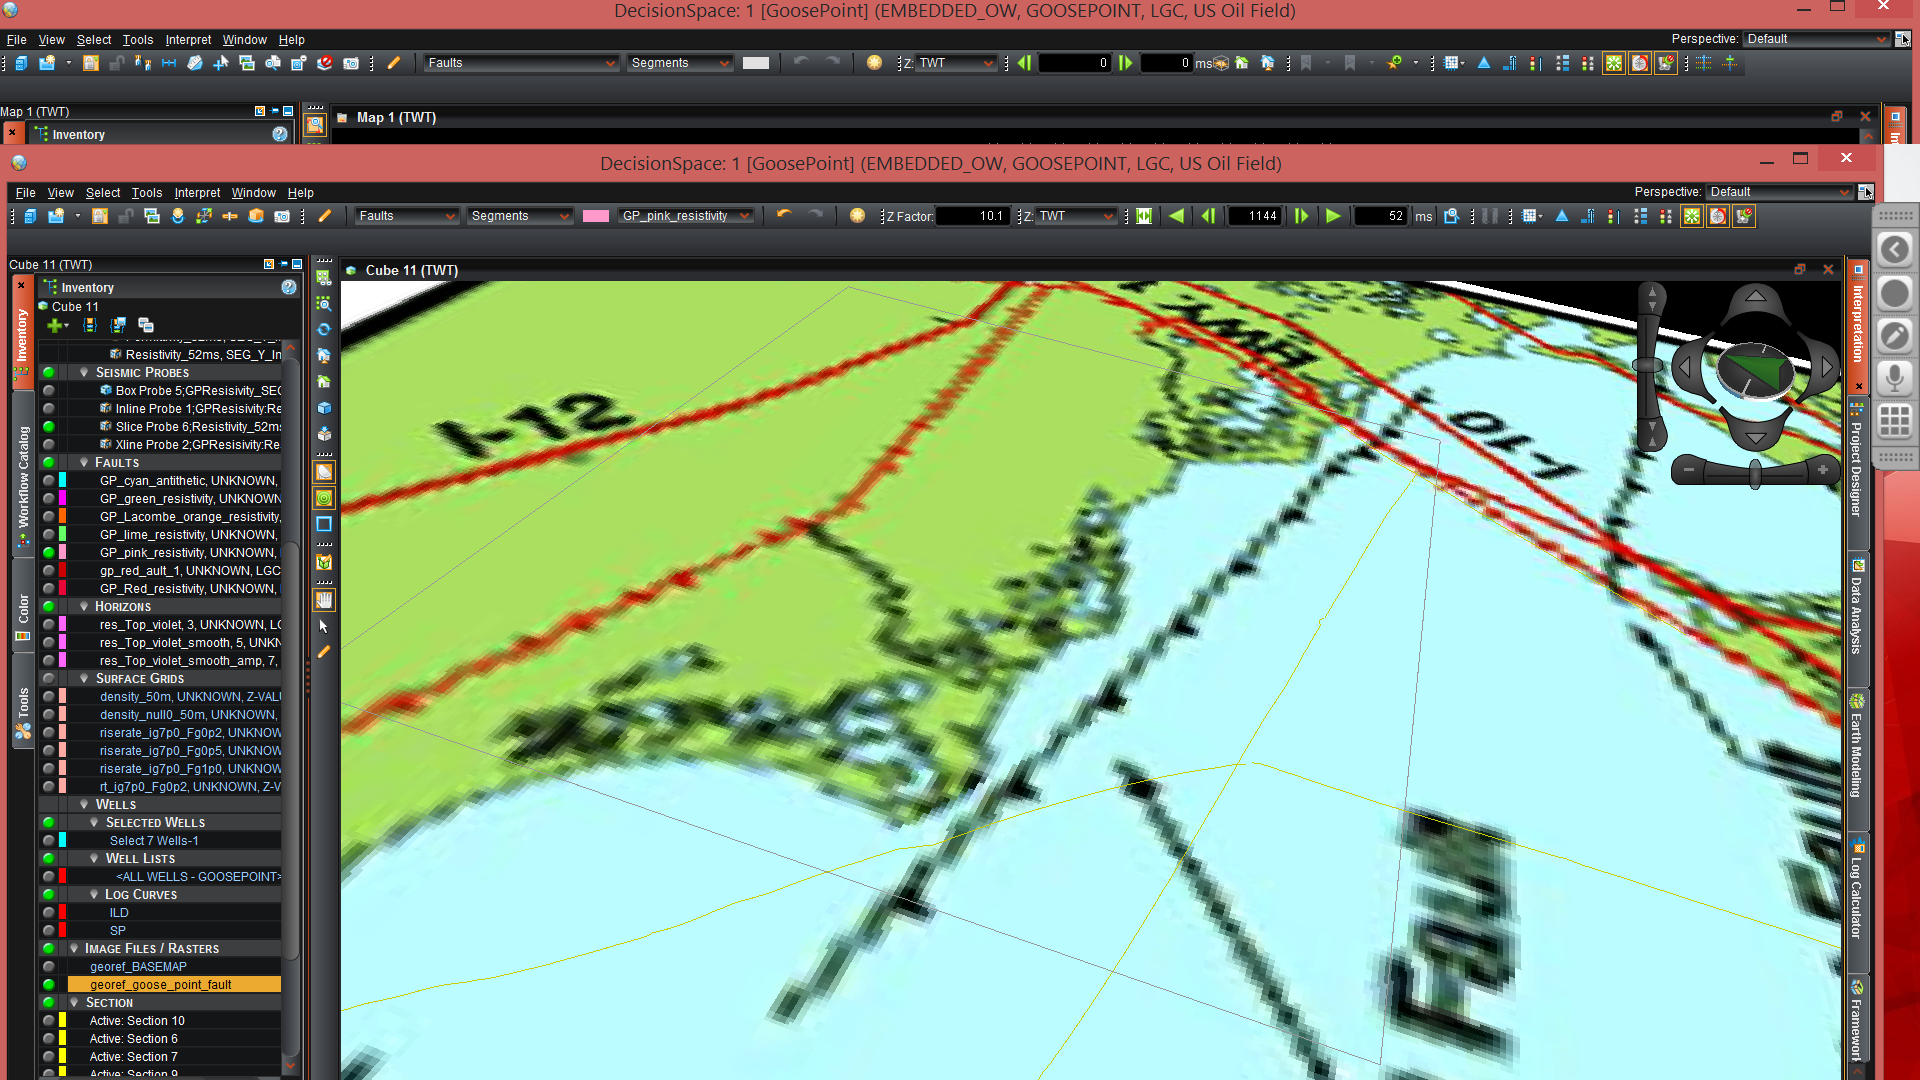
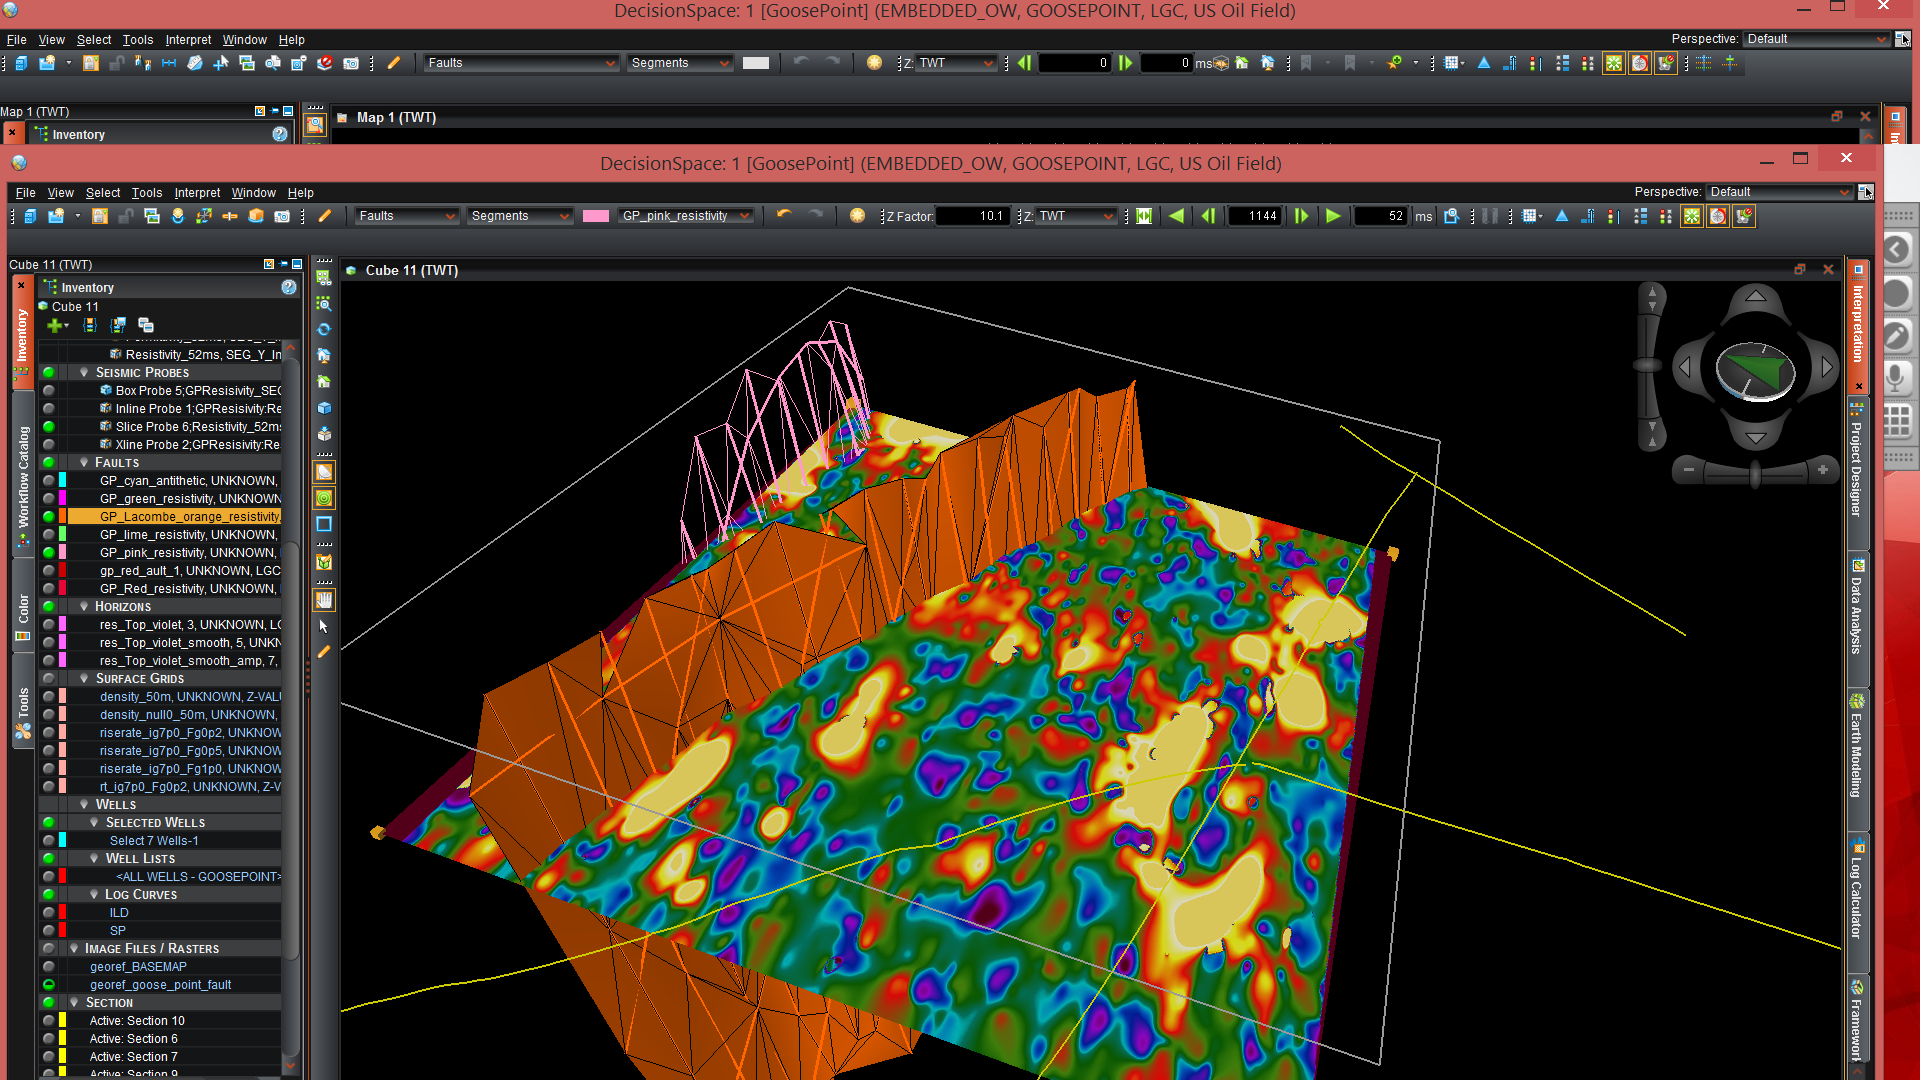
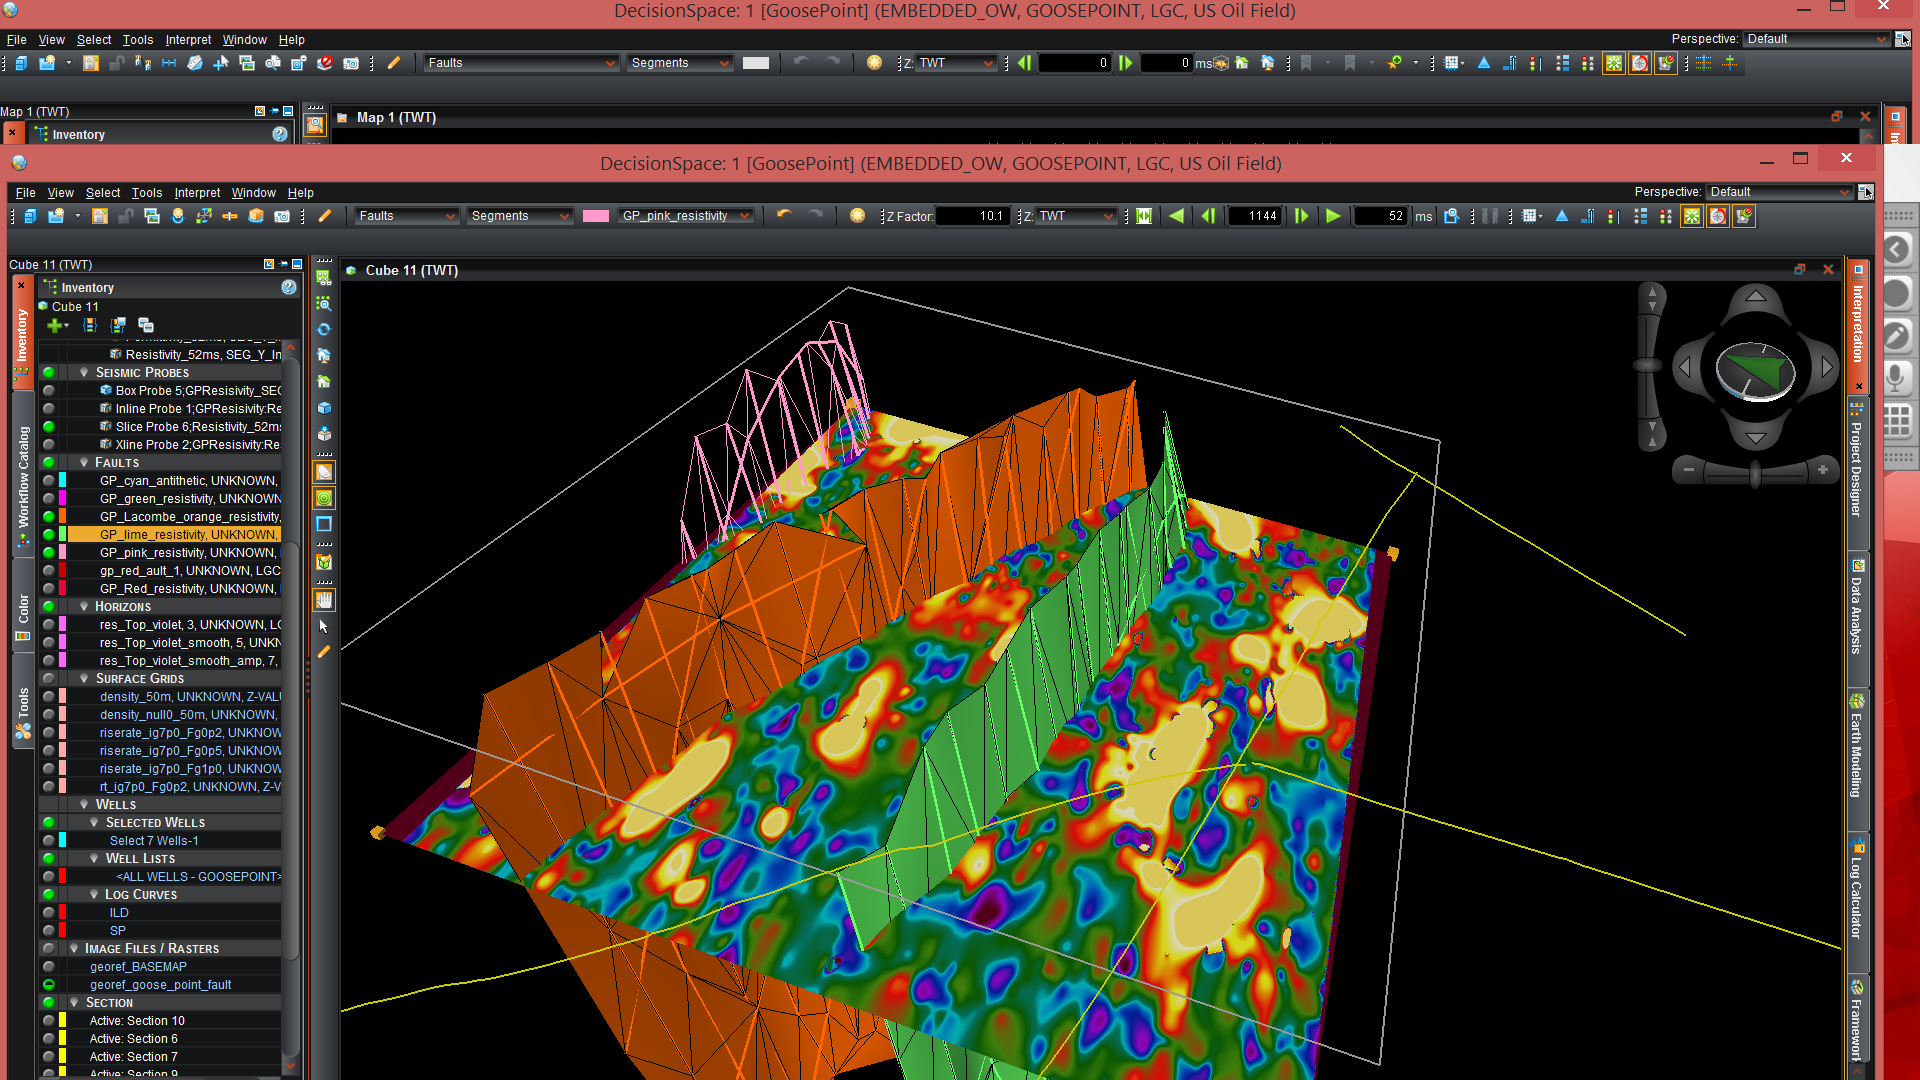
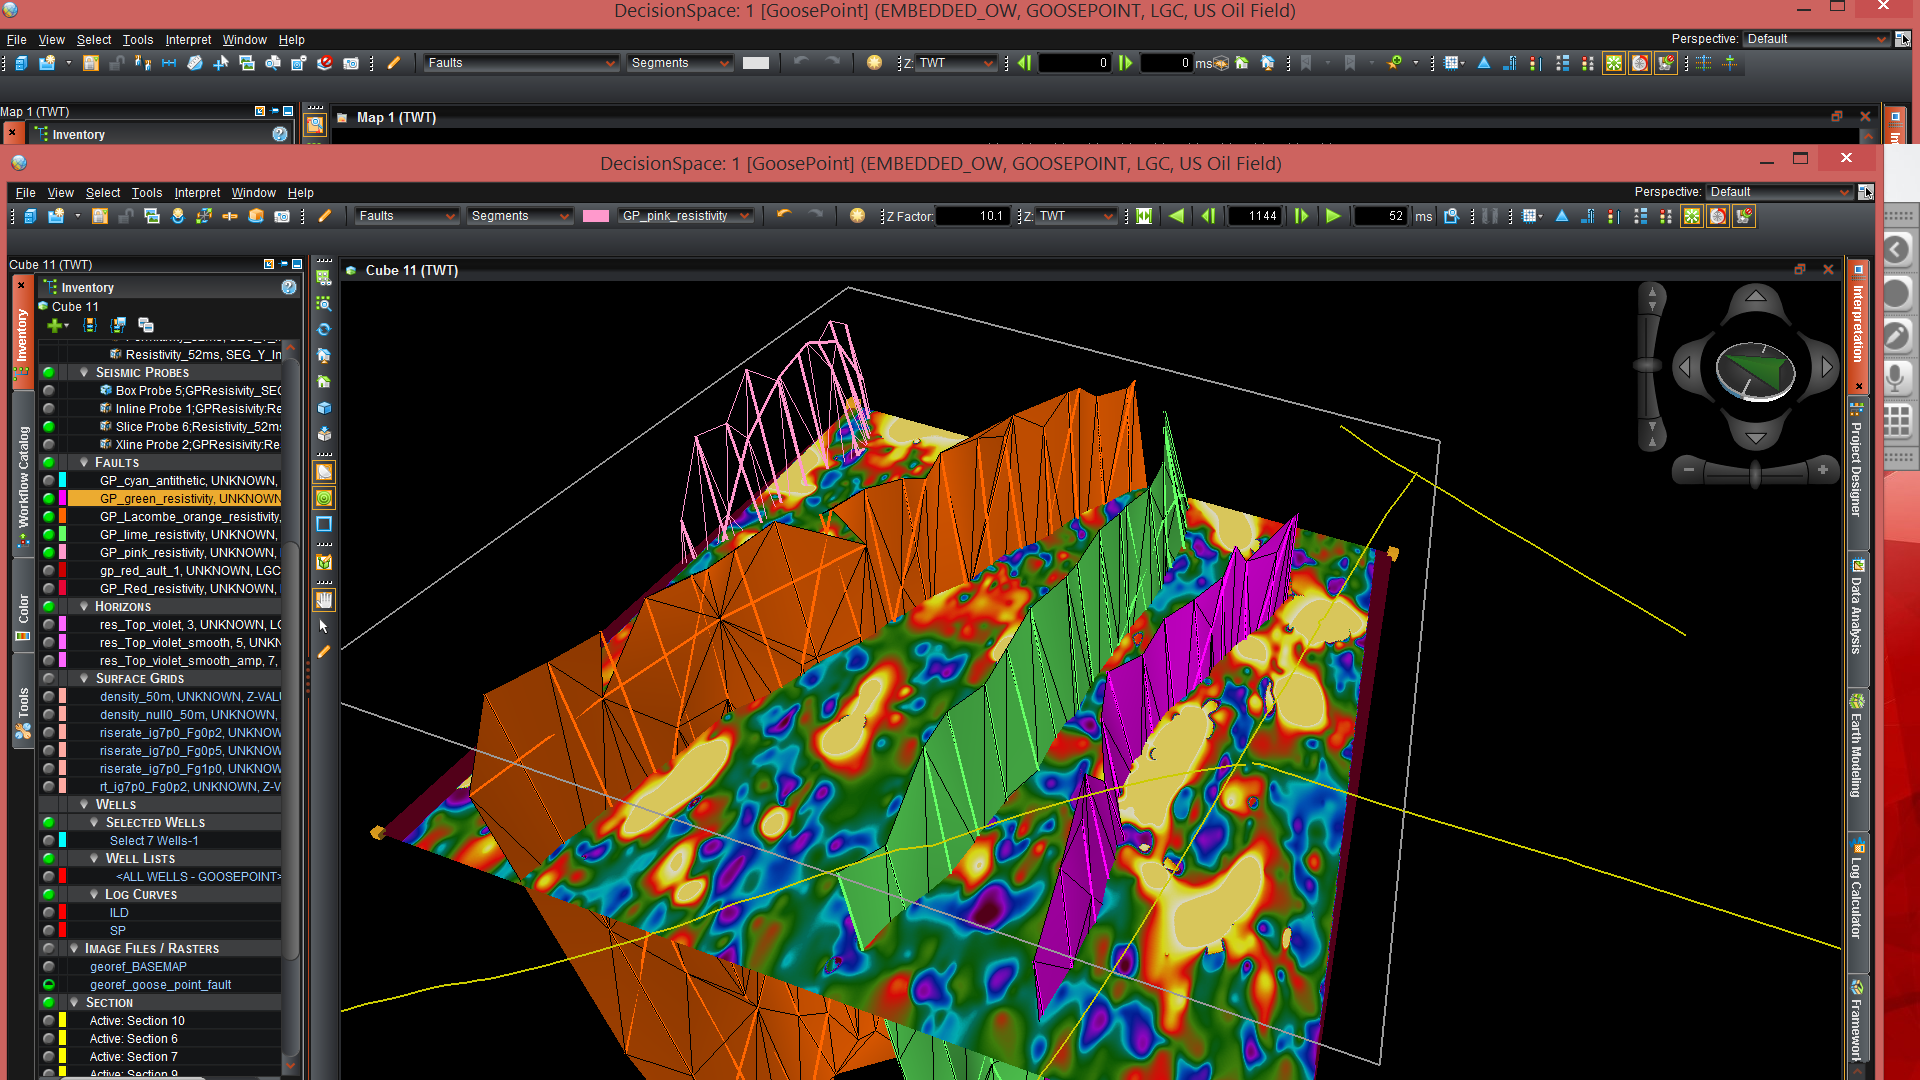
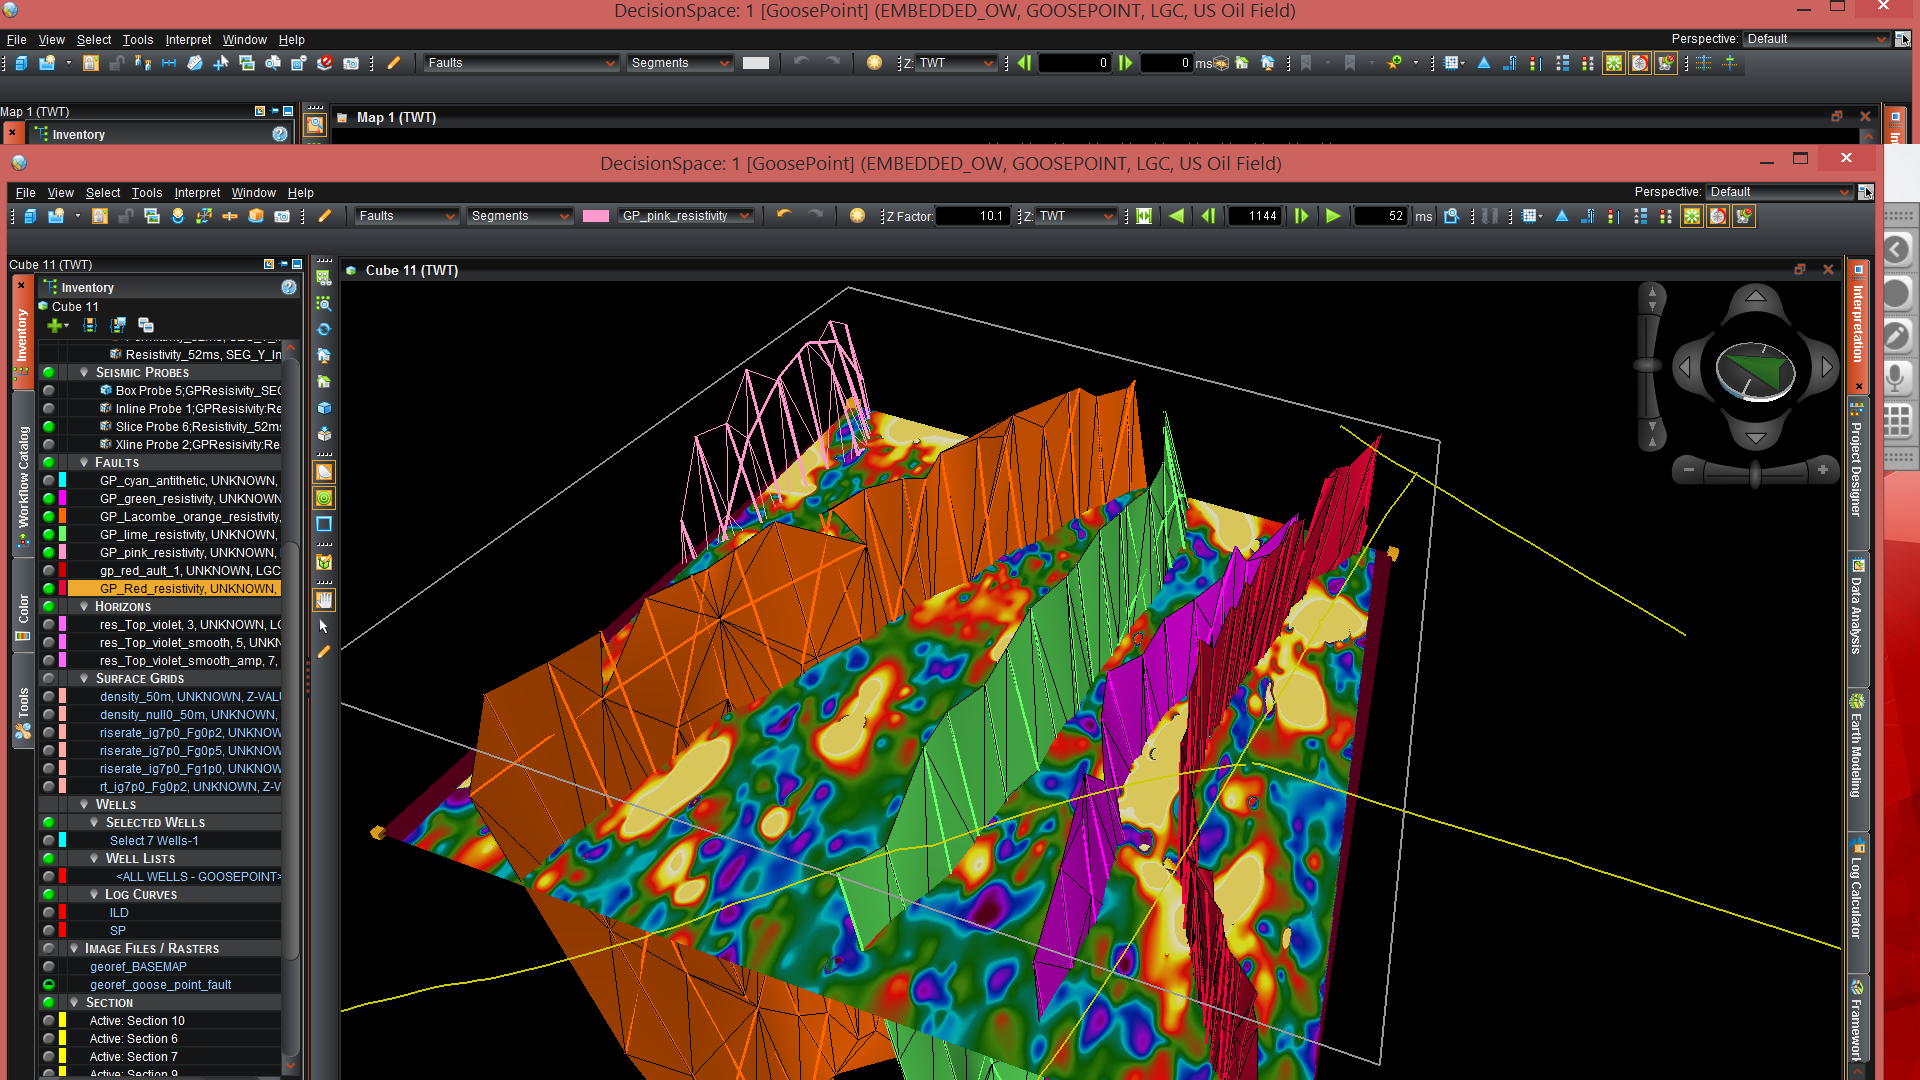
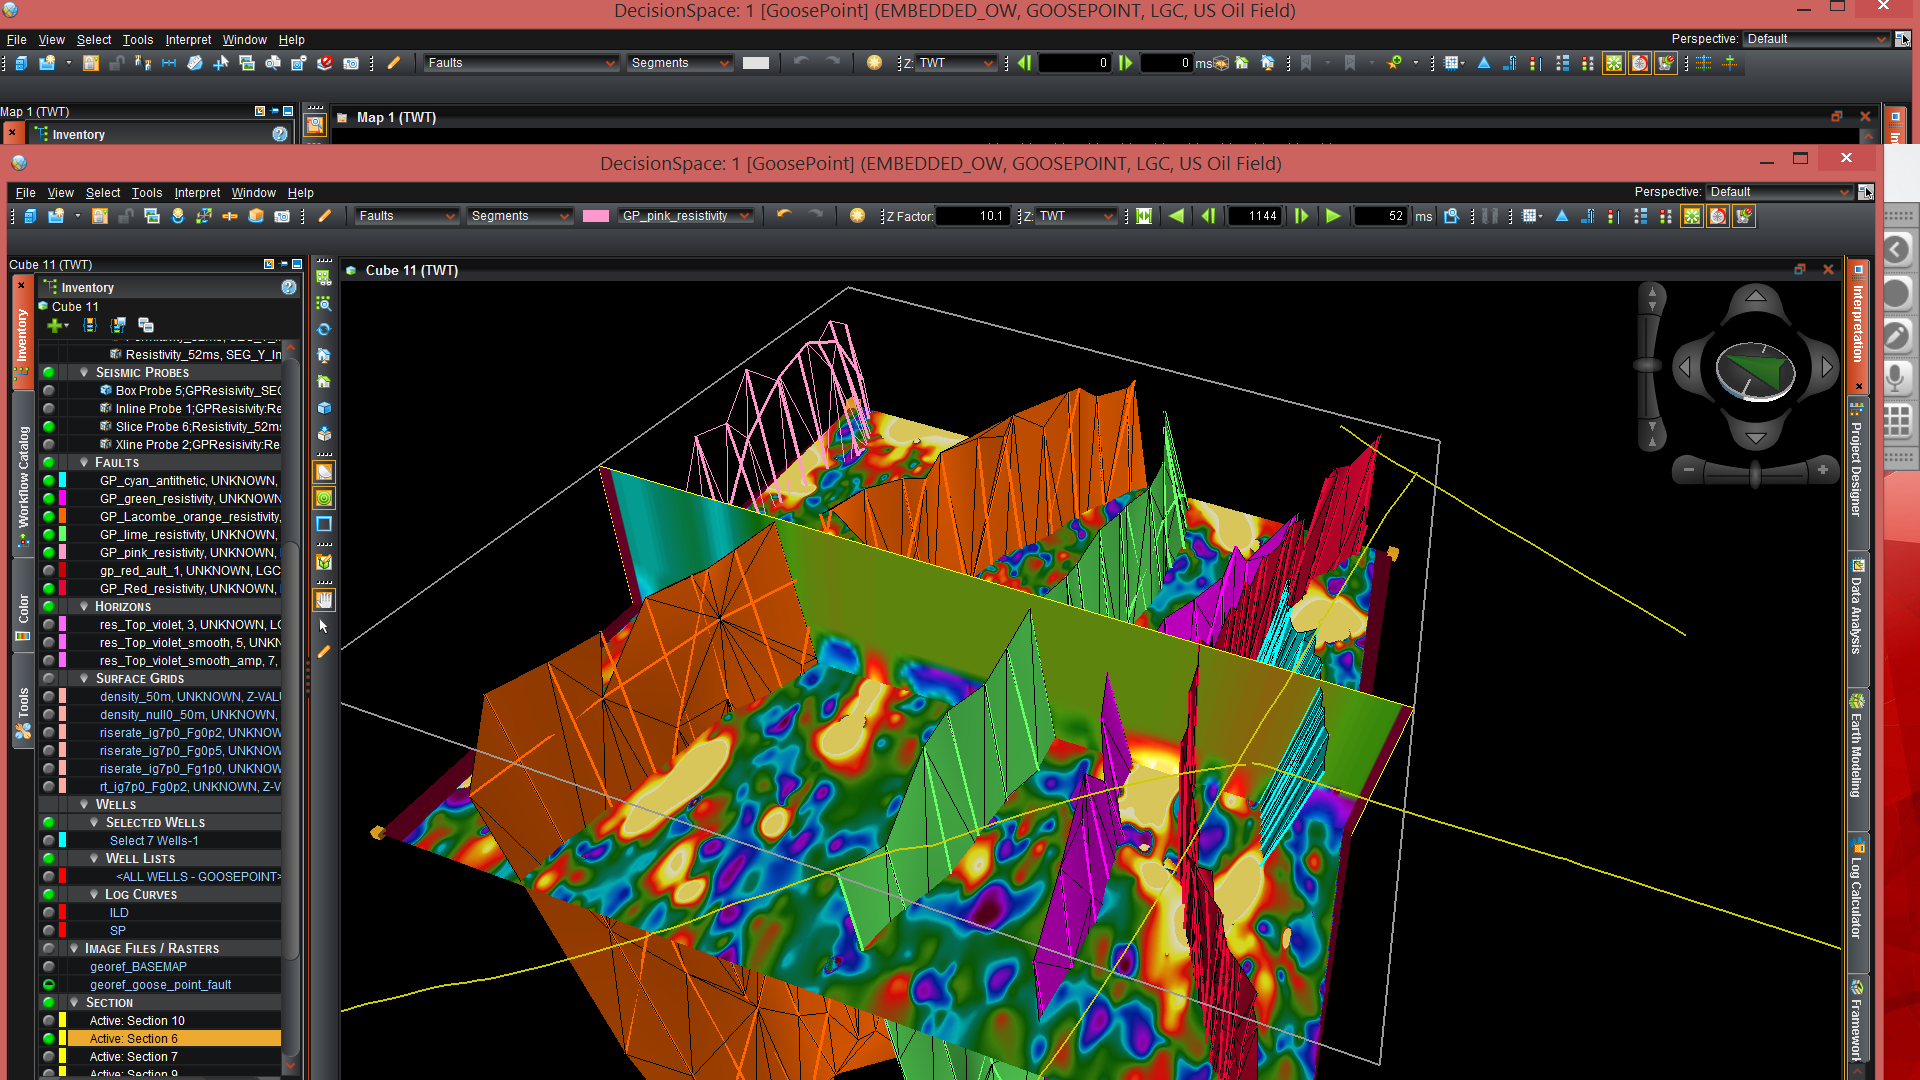
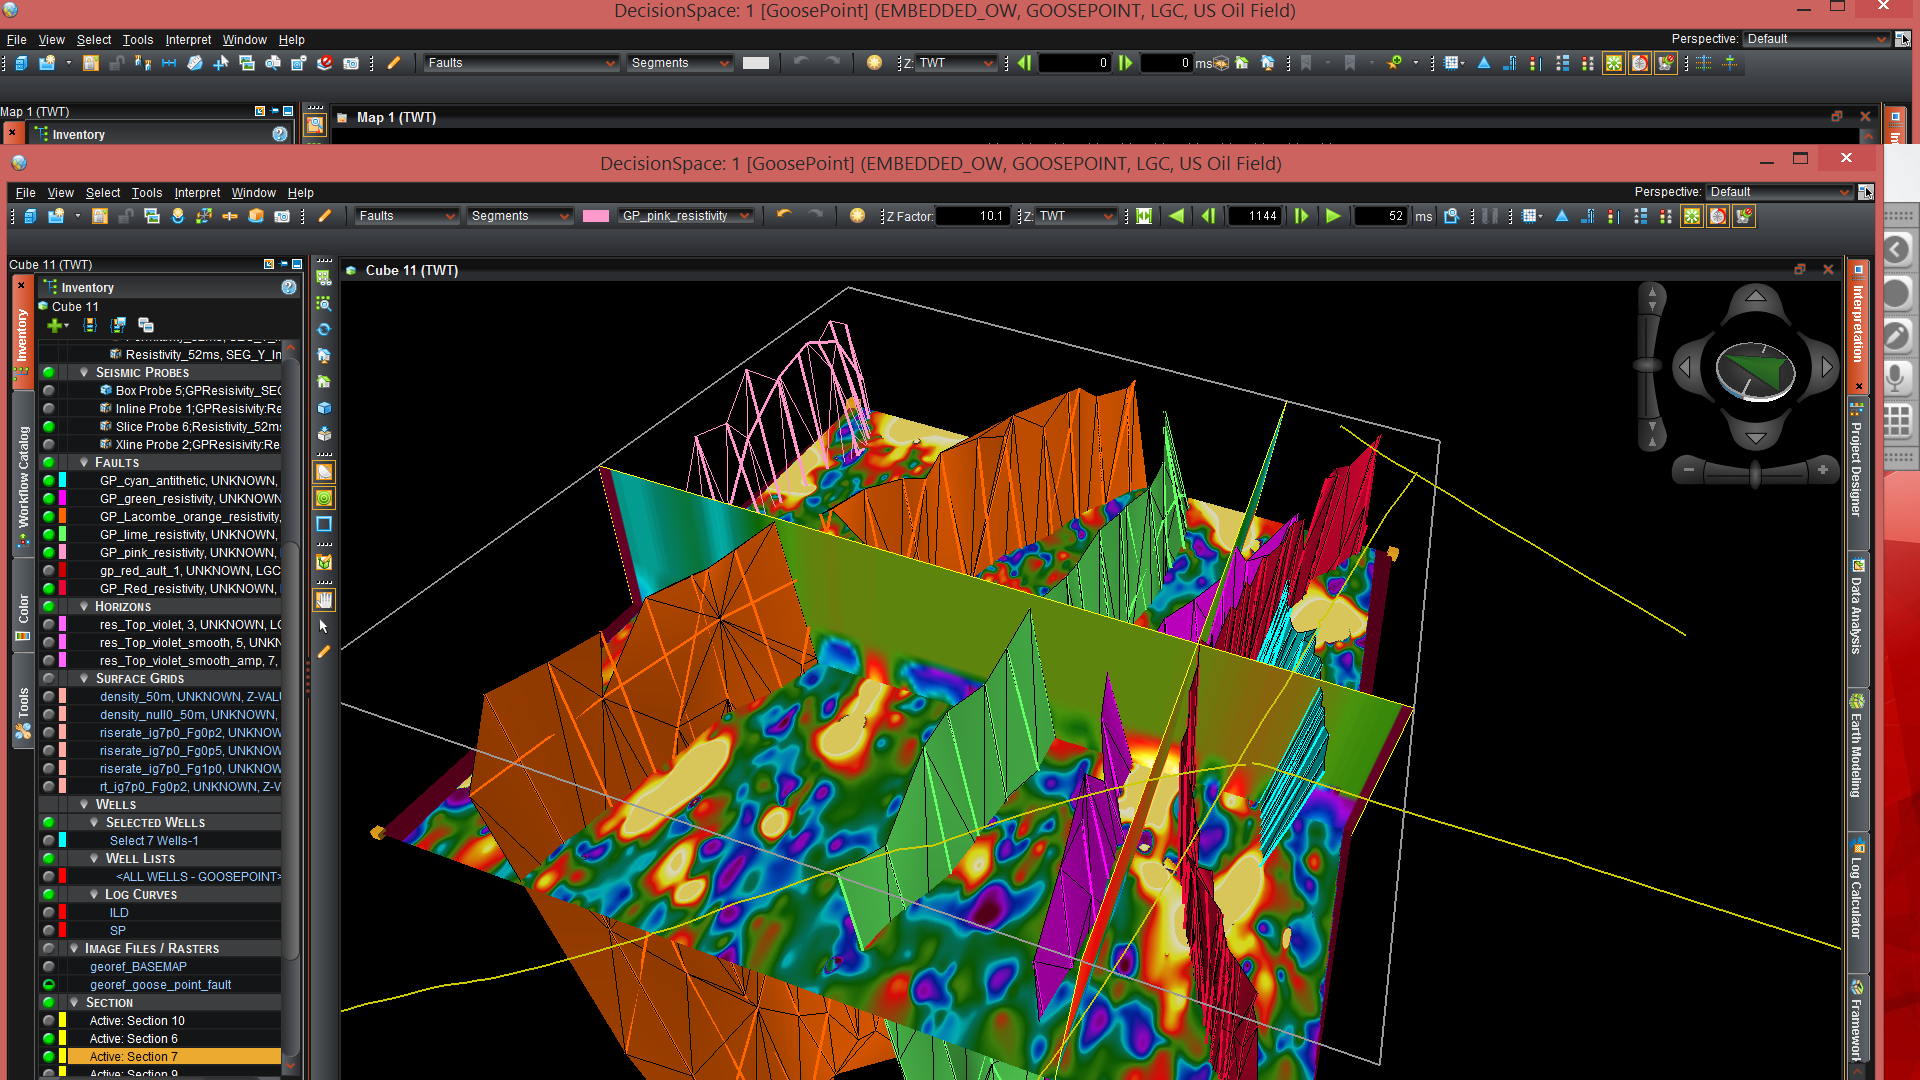
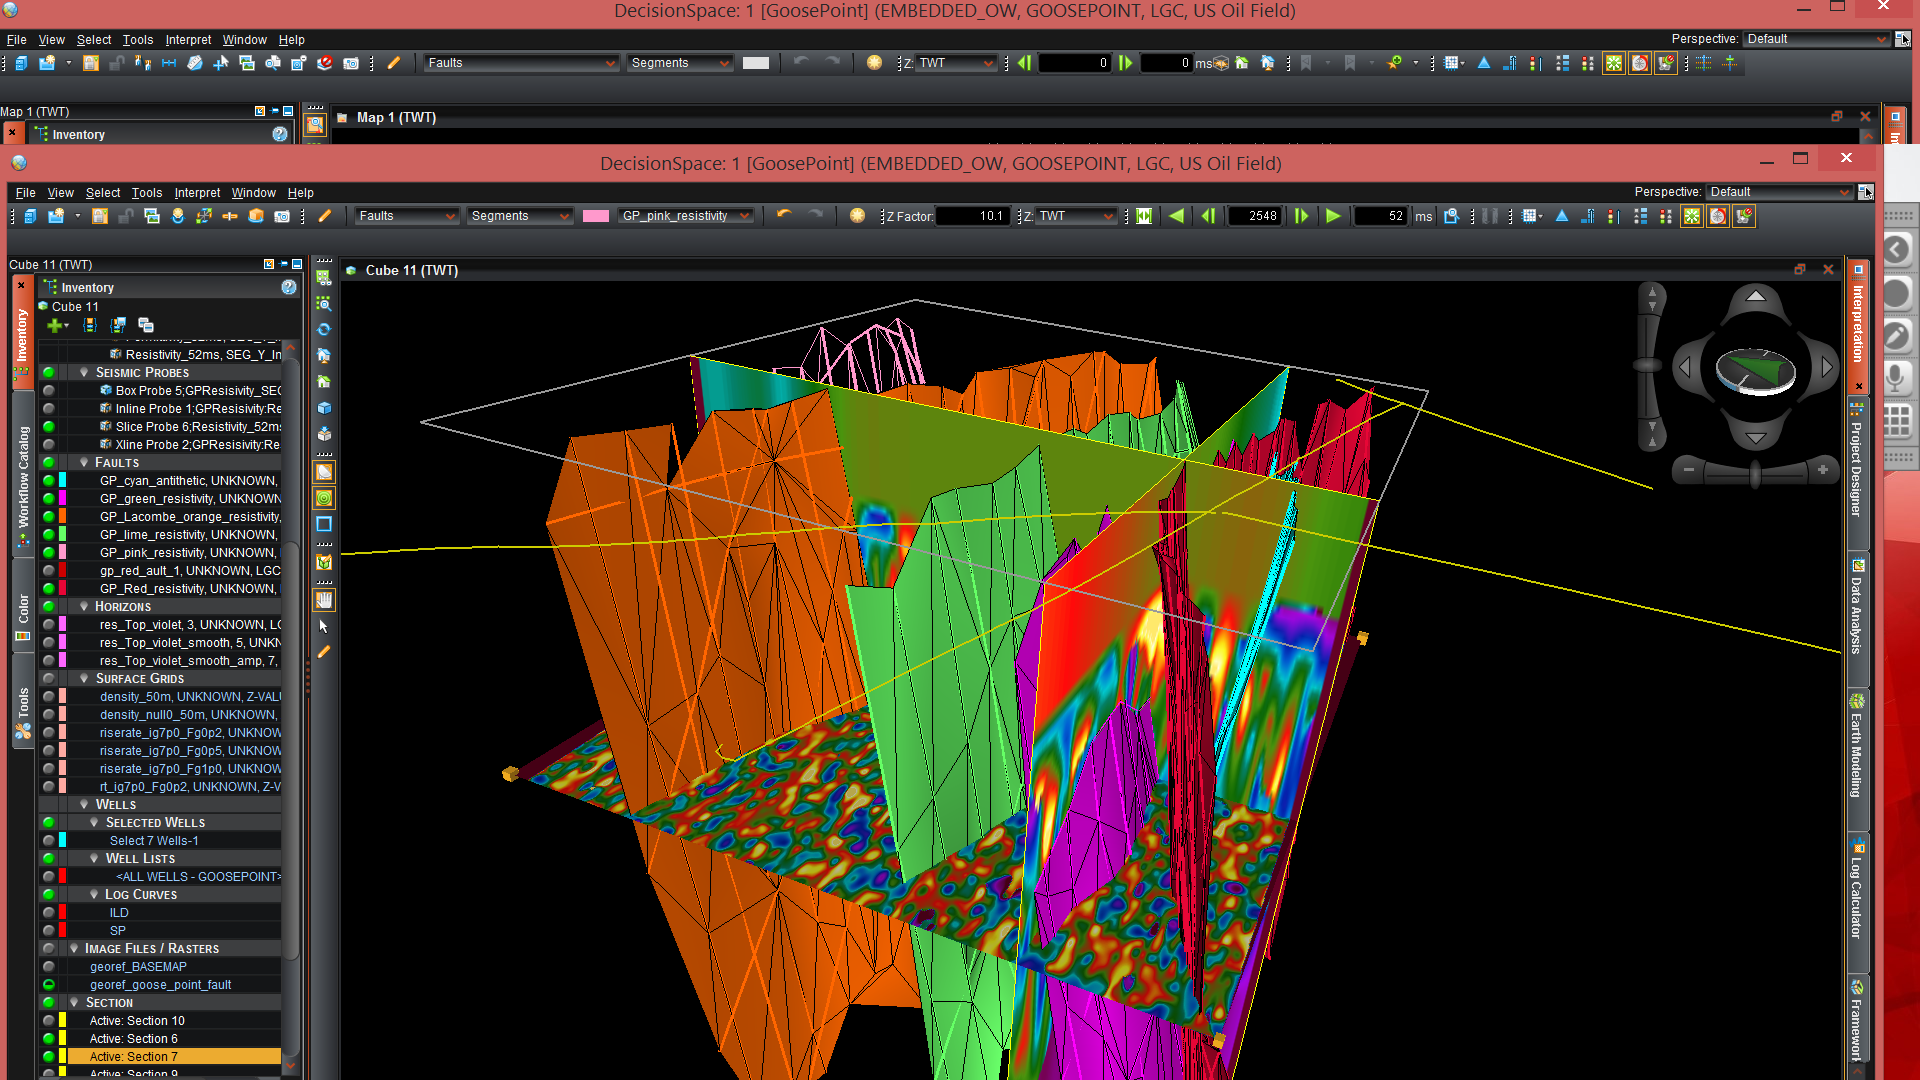
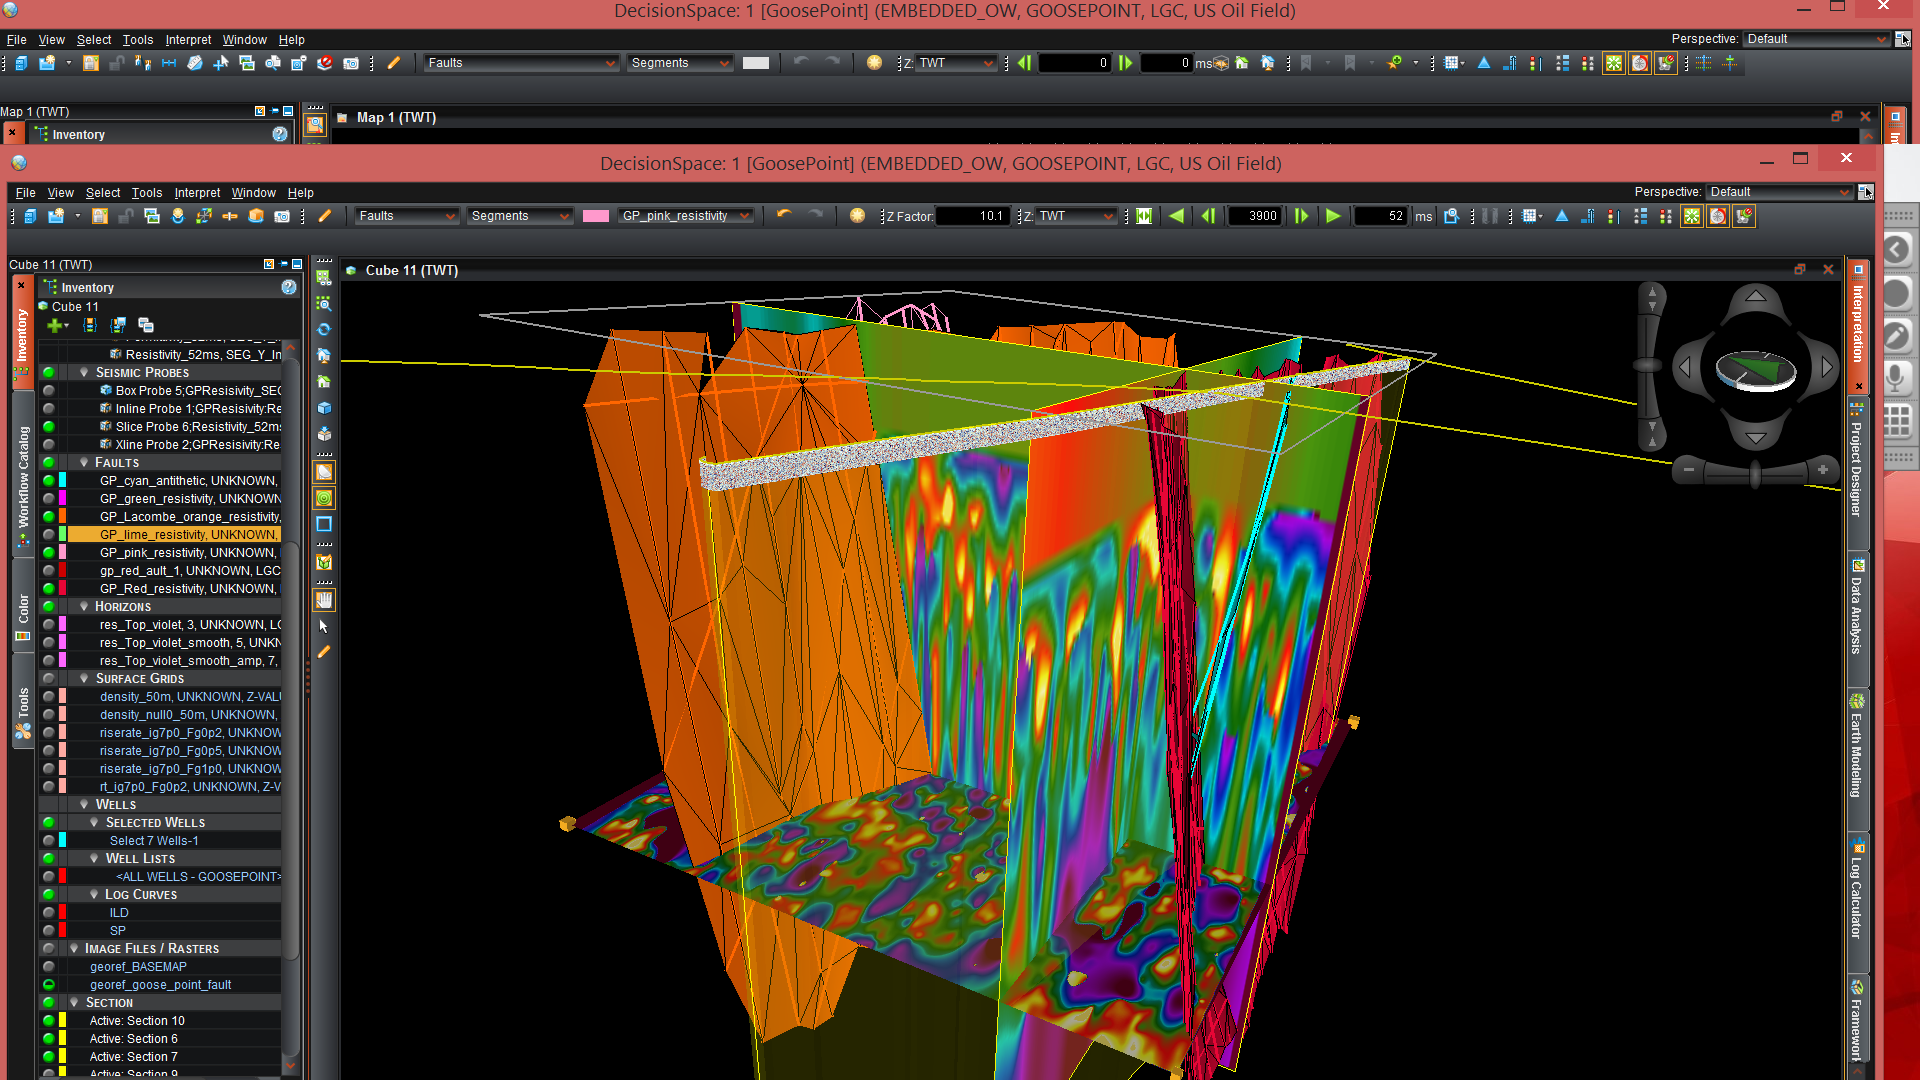
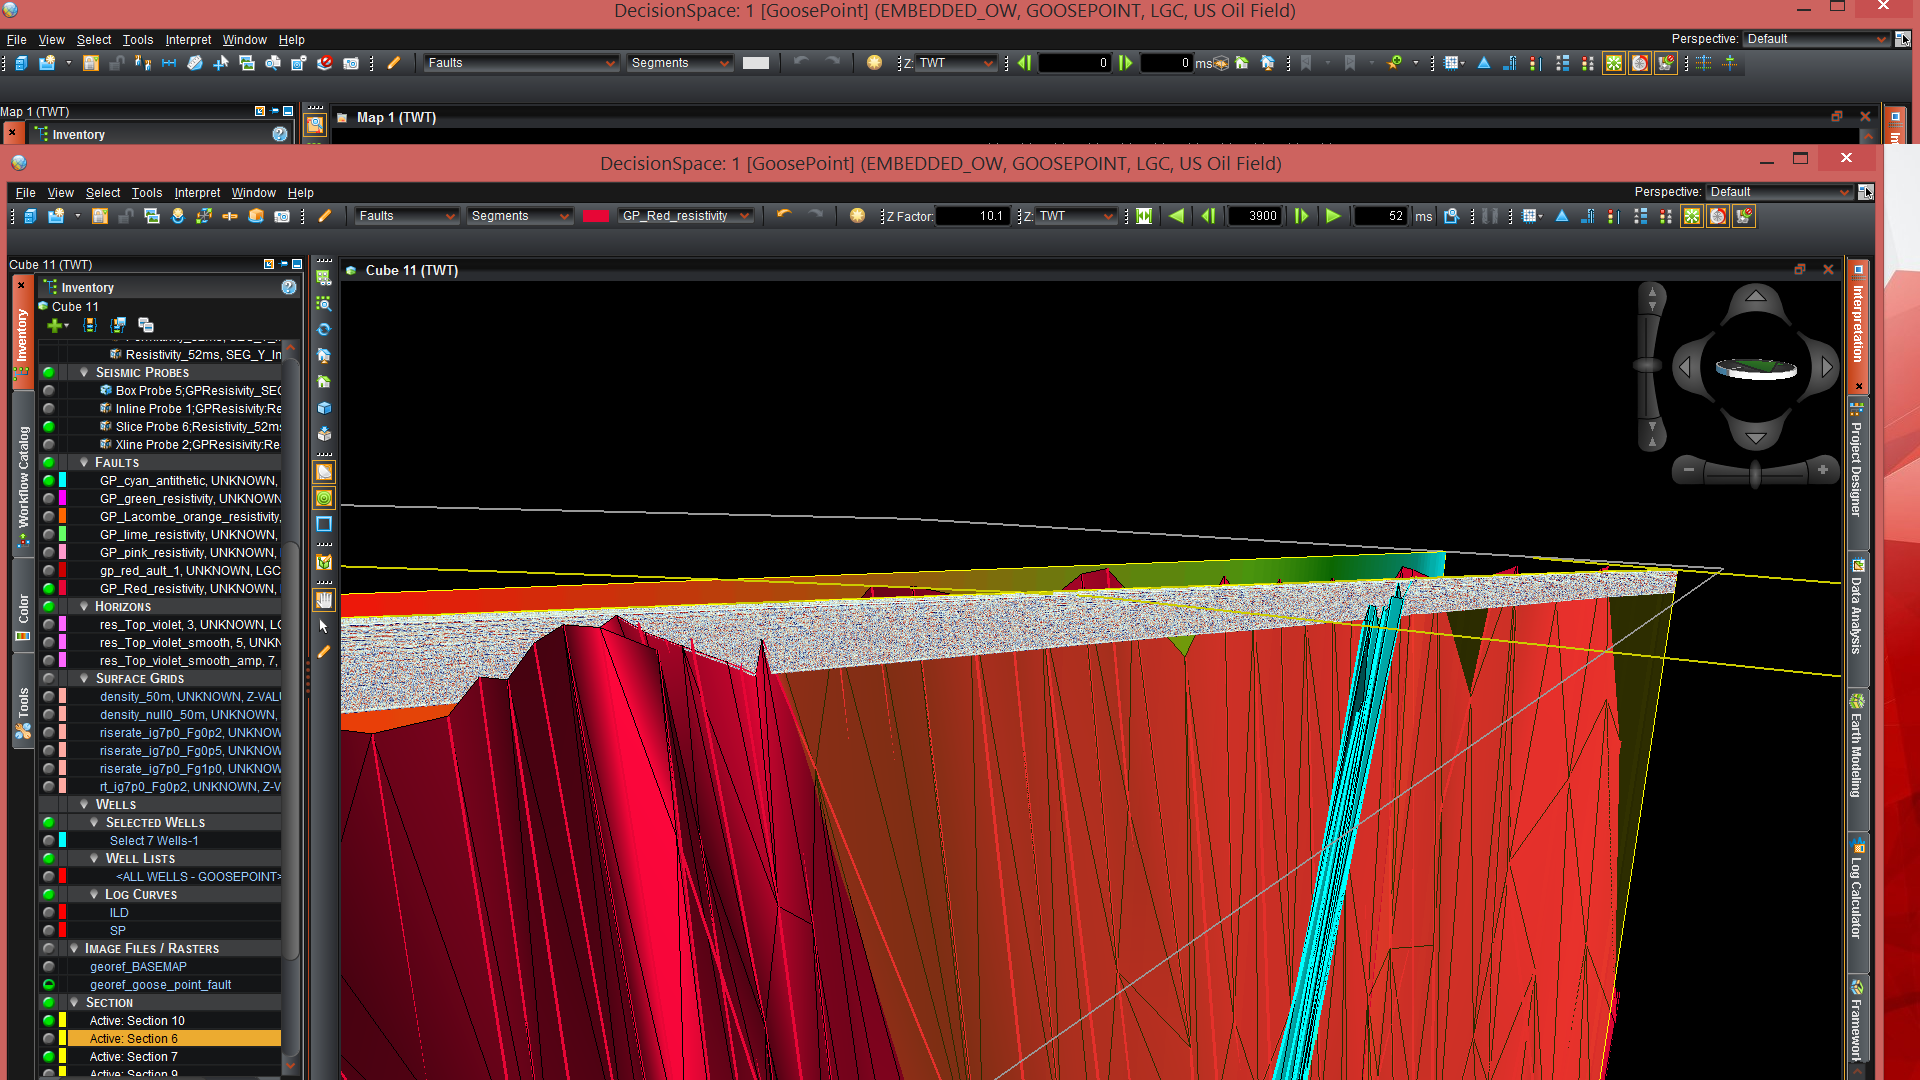
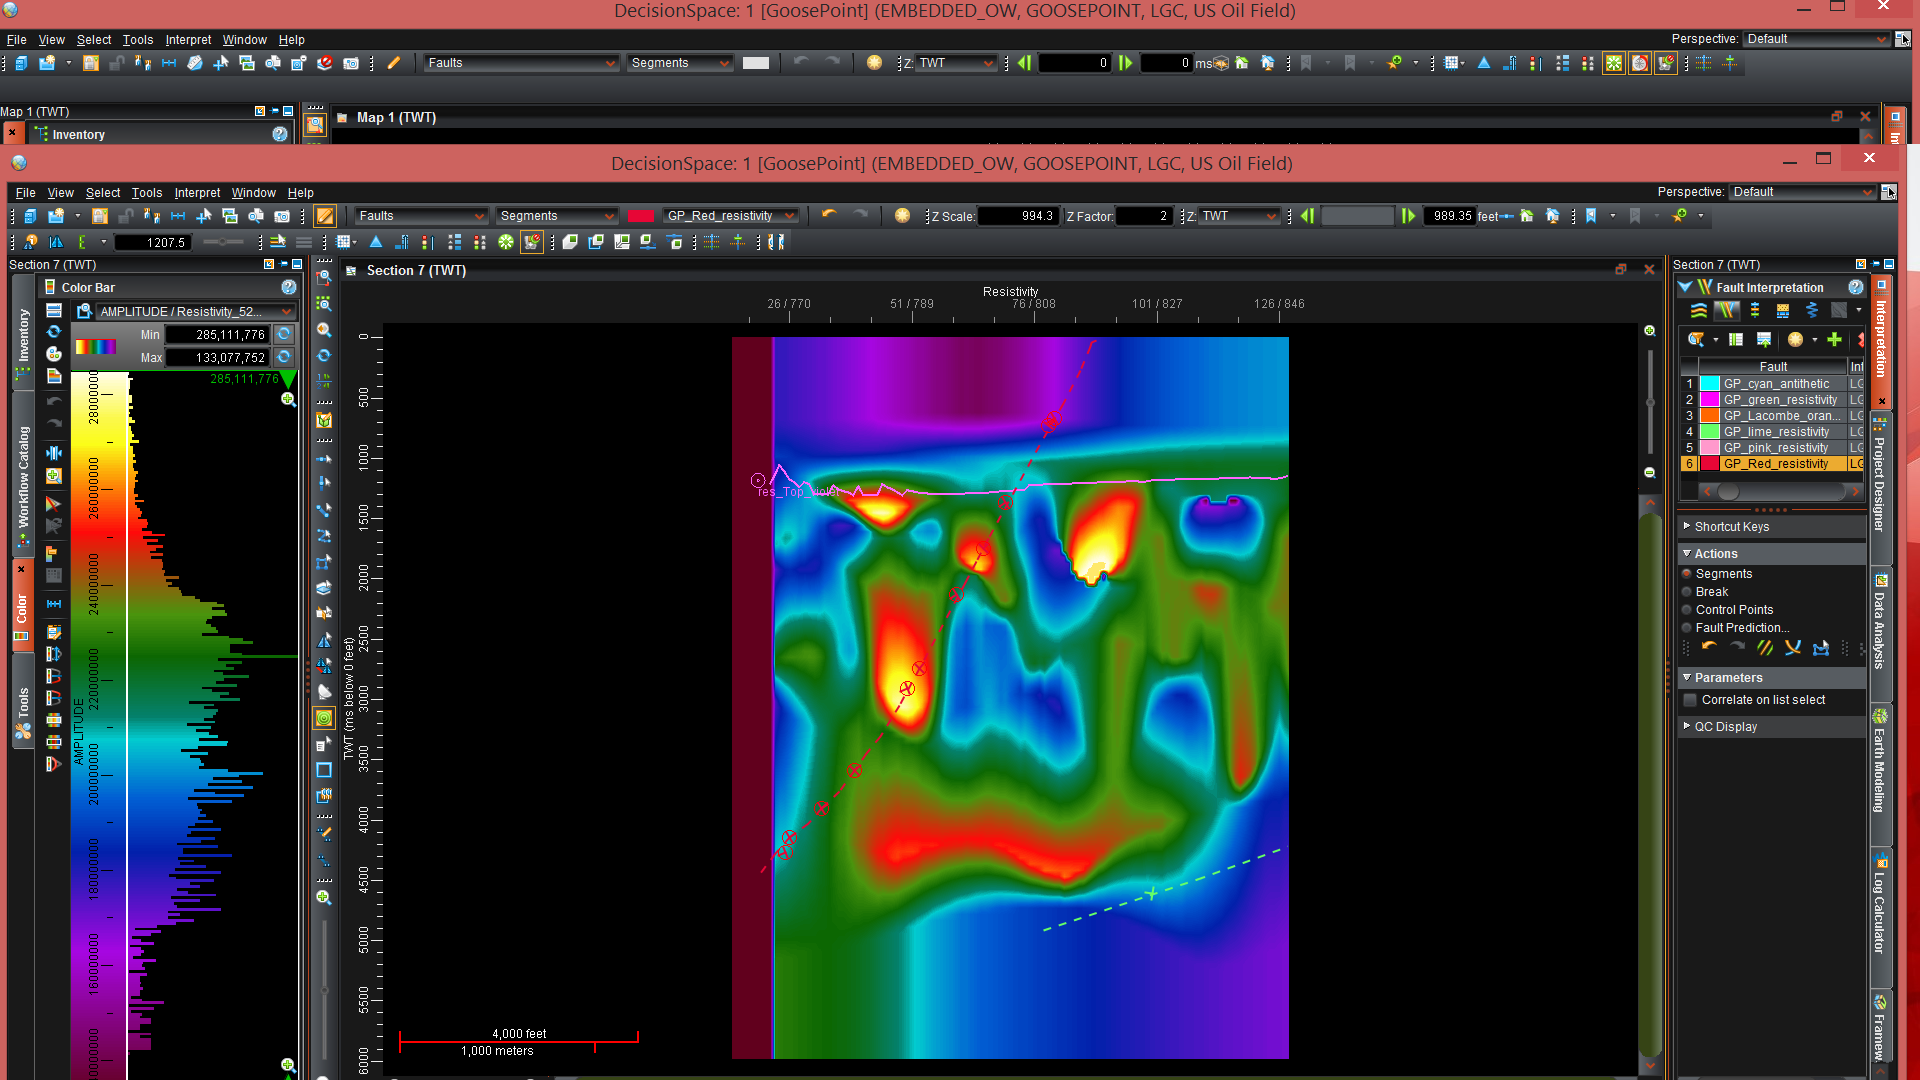
| GIS + Pink + Orange + Green Faults | Violet + Red + Cyan Faults + Dip Section |
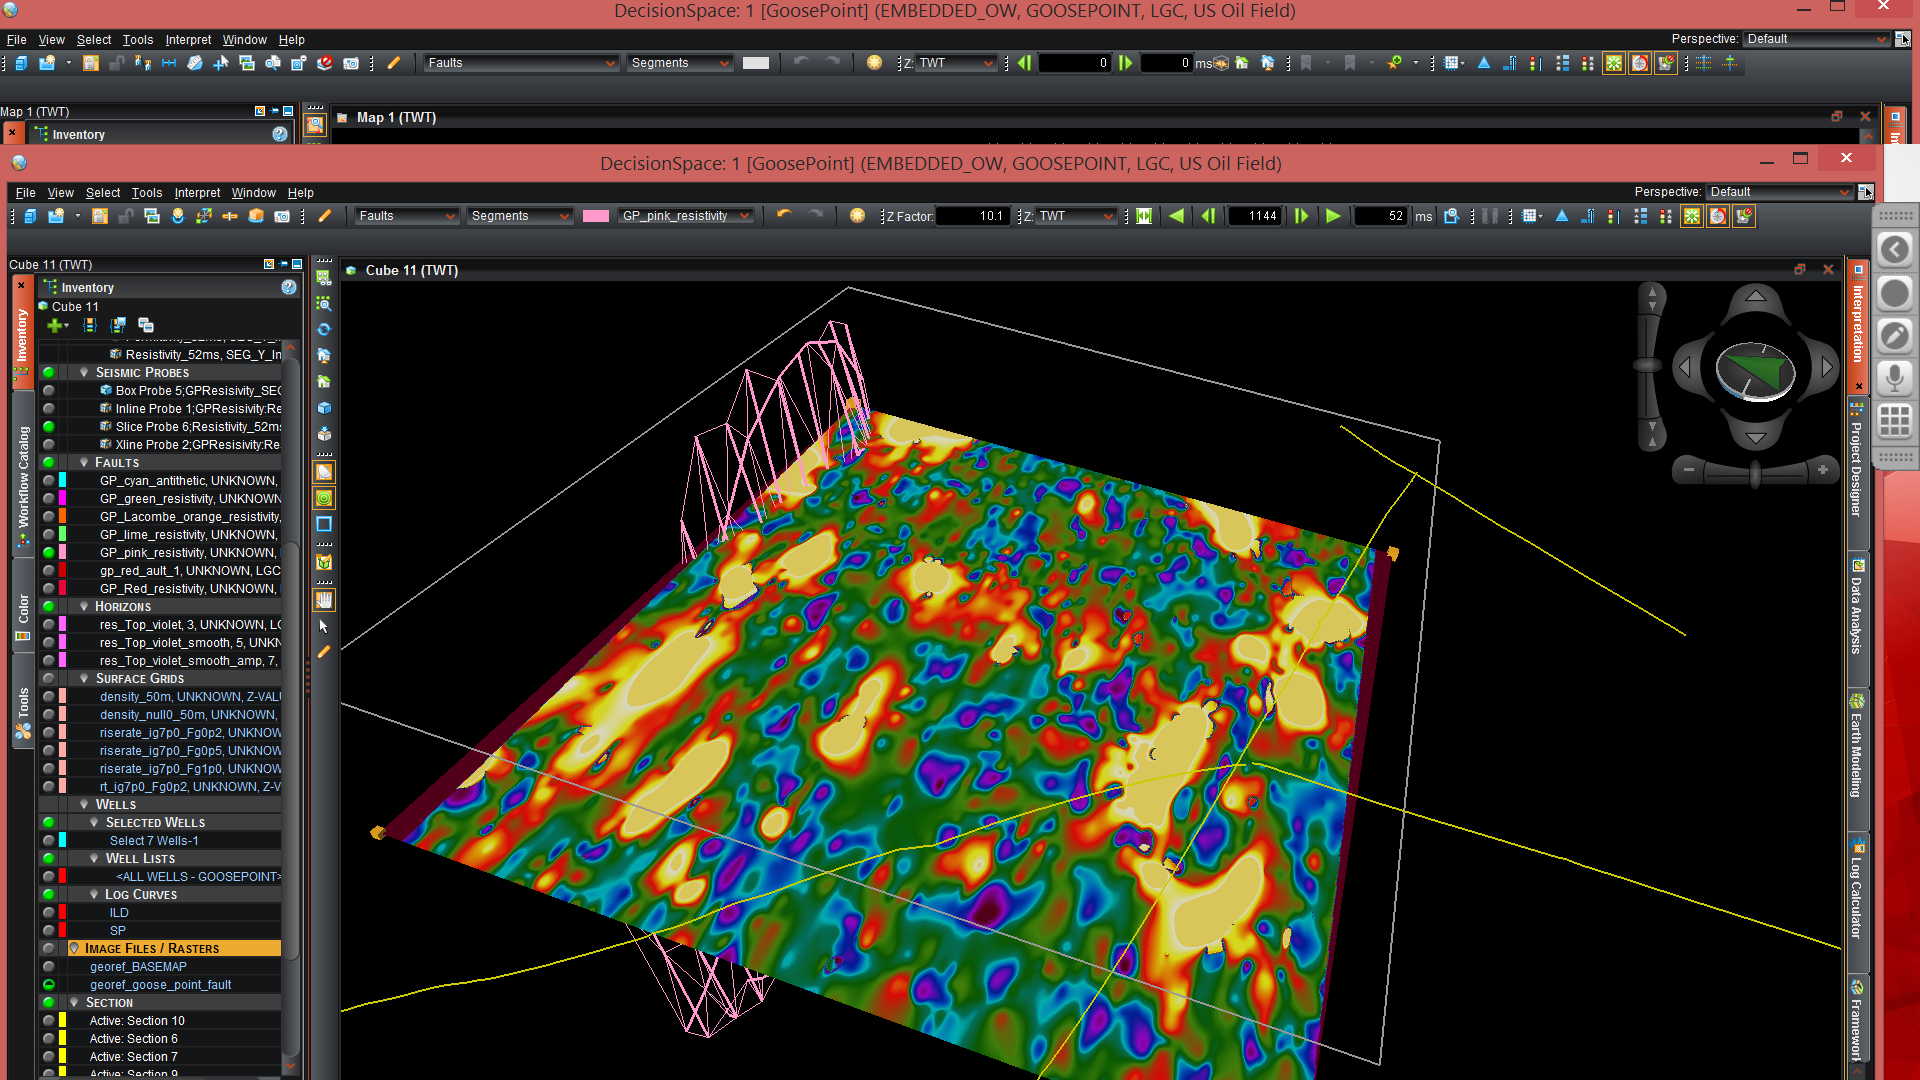
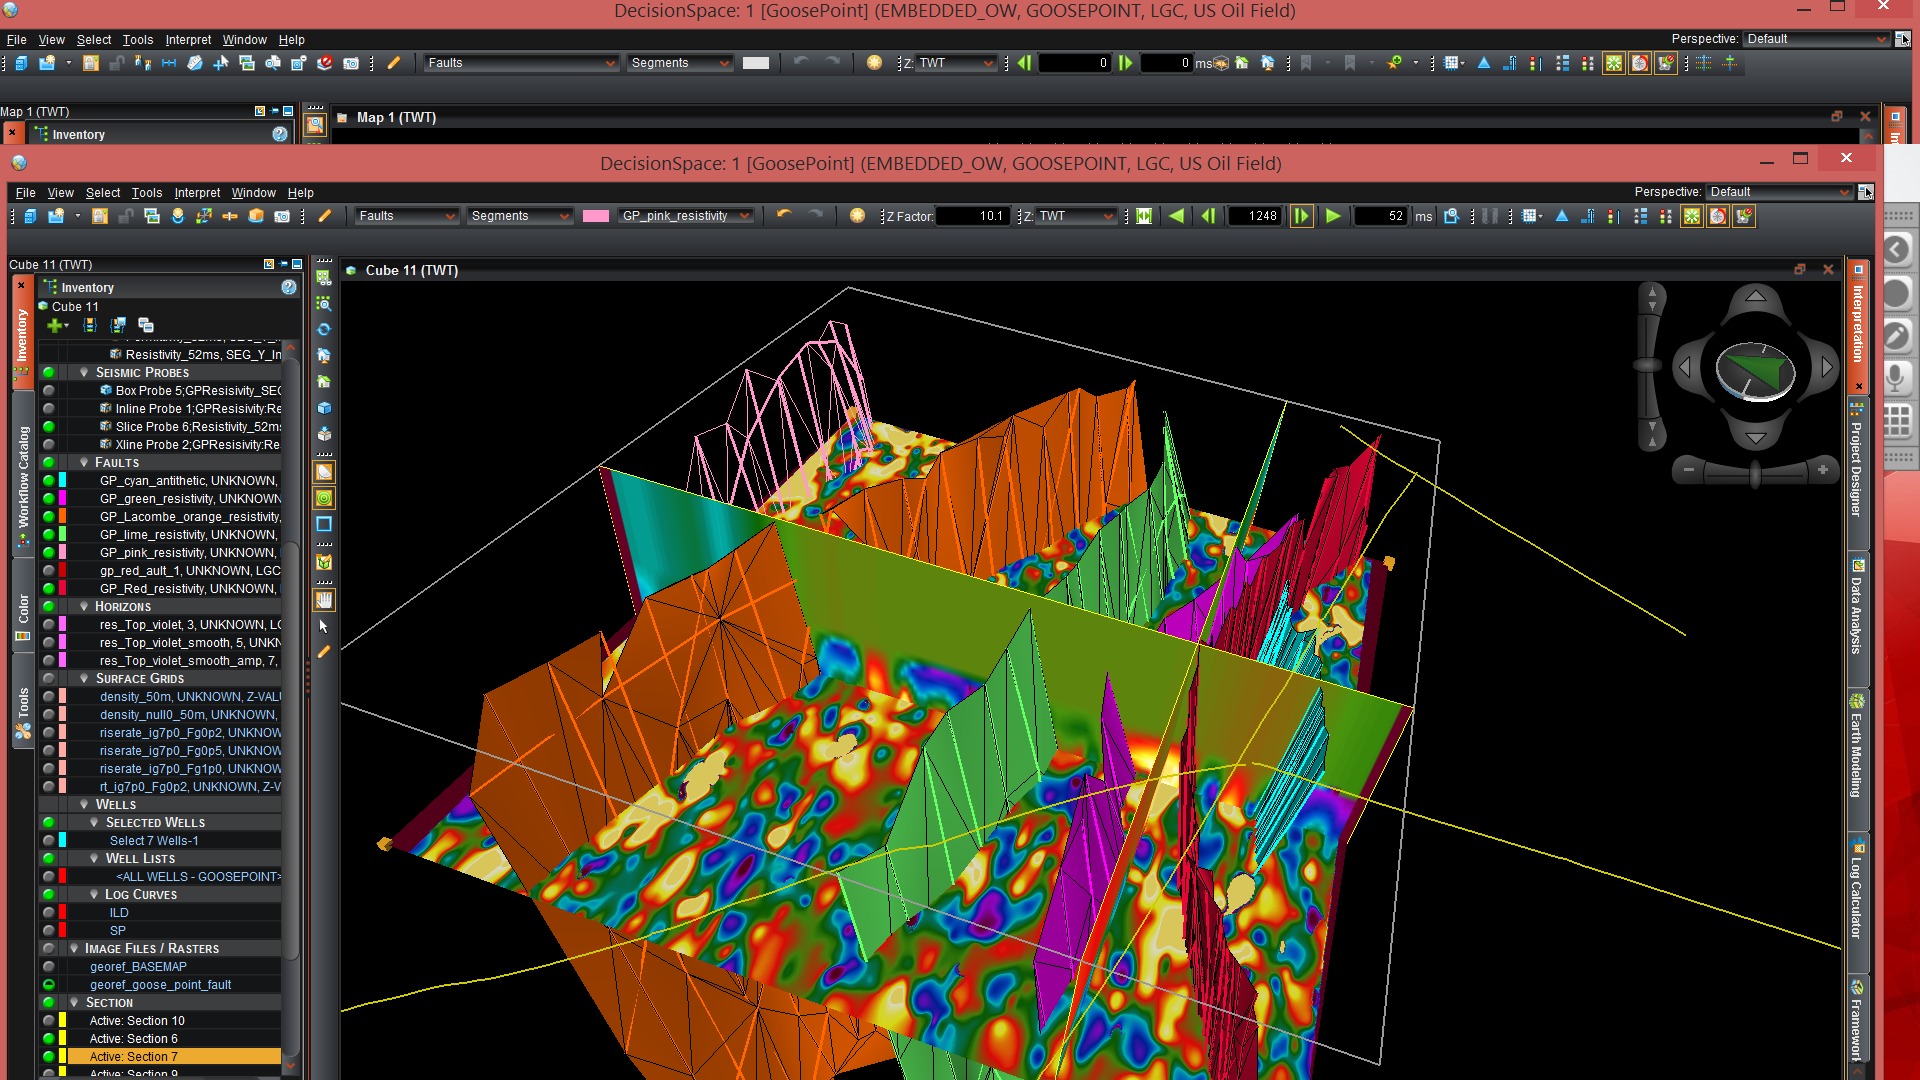
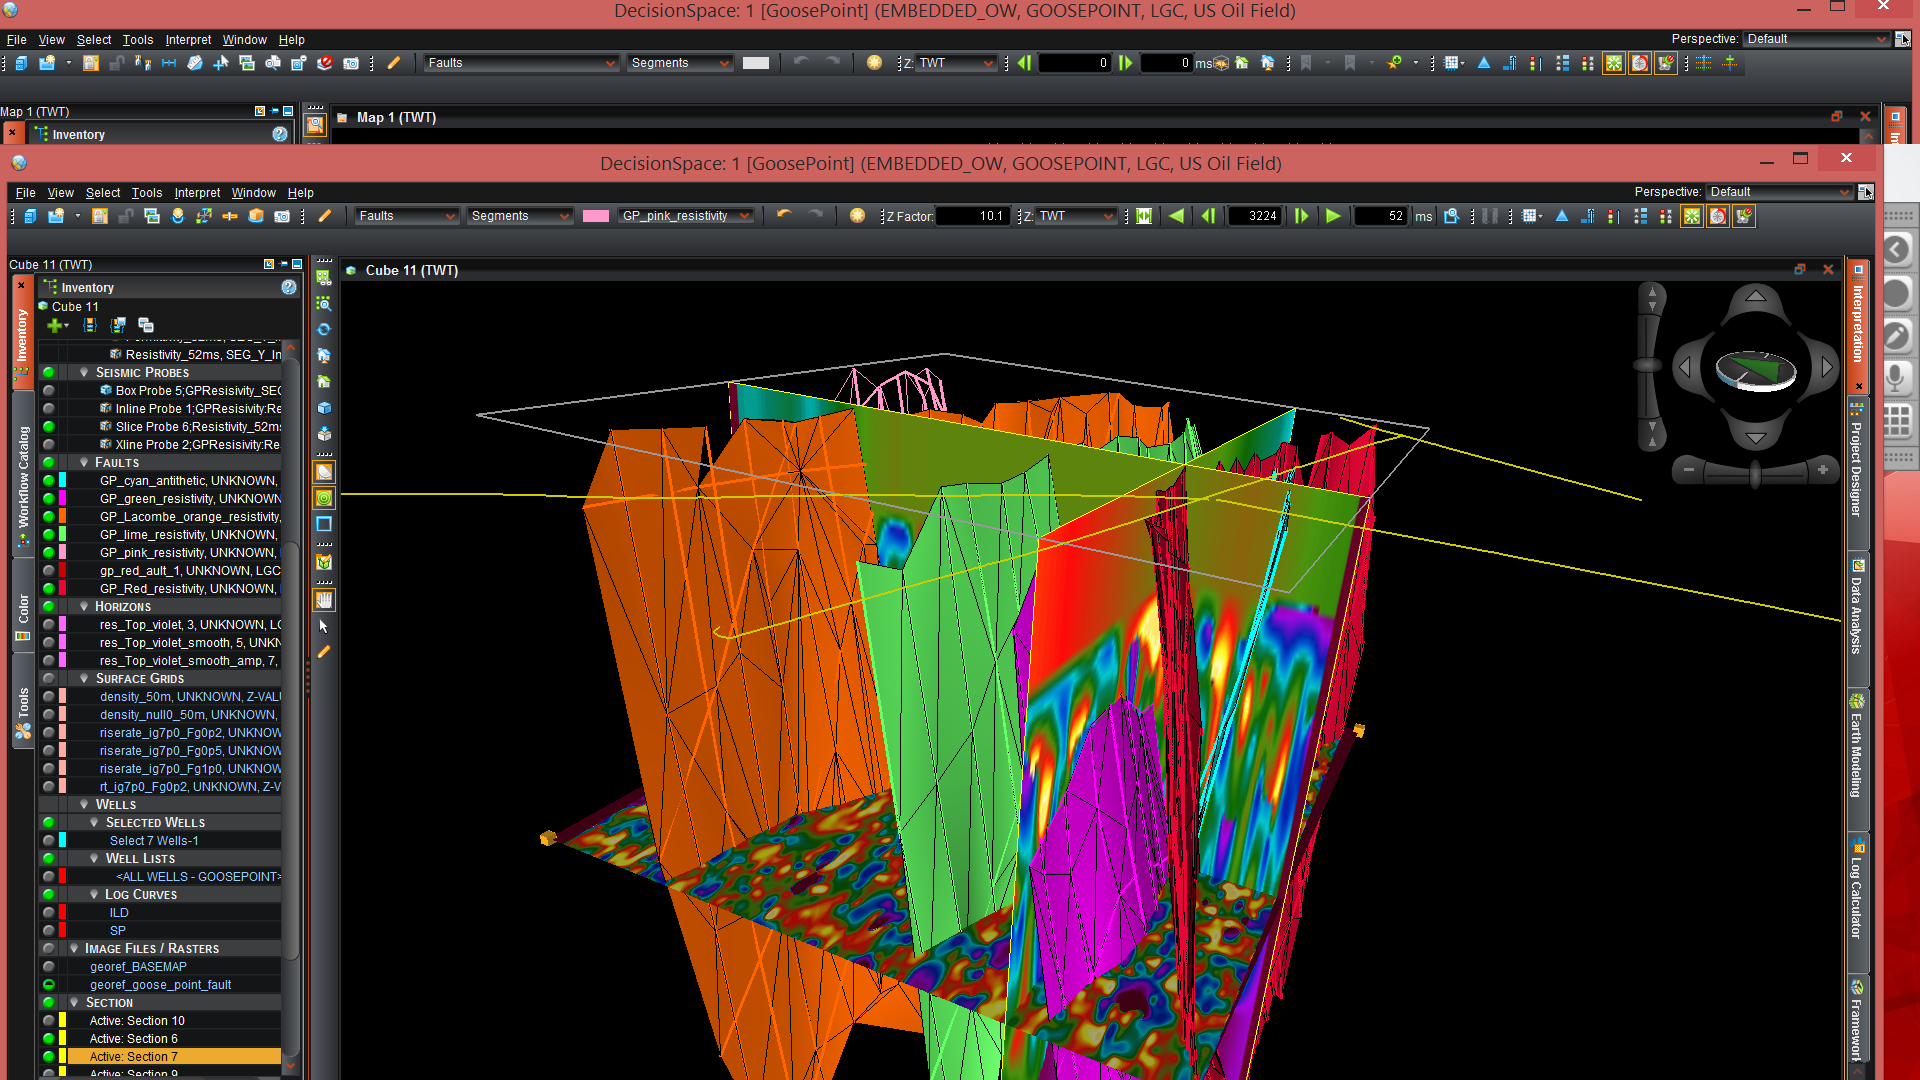
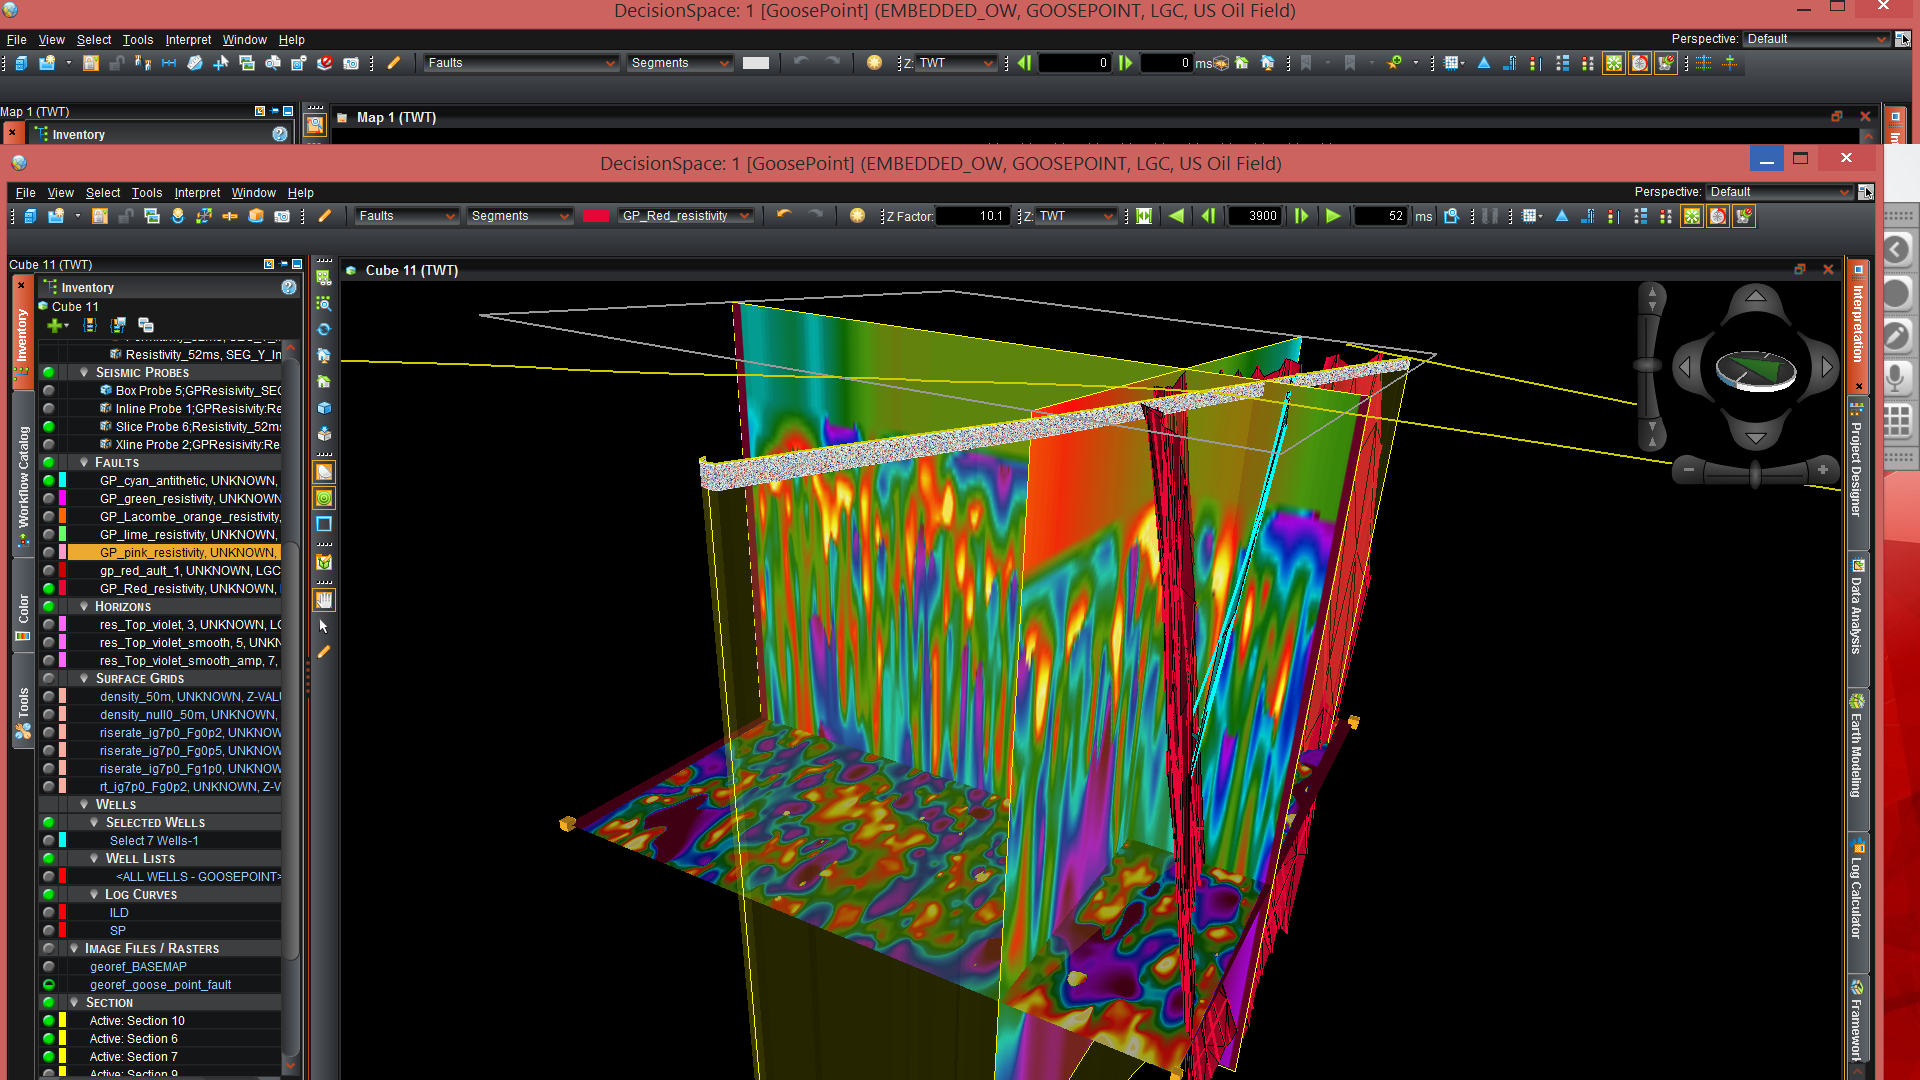
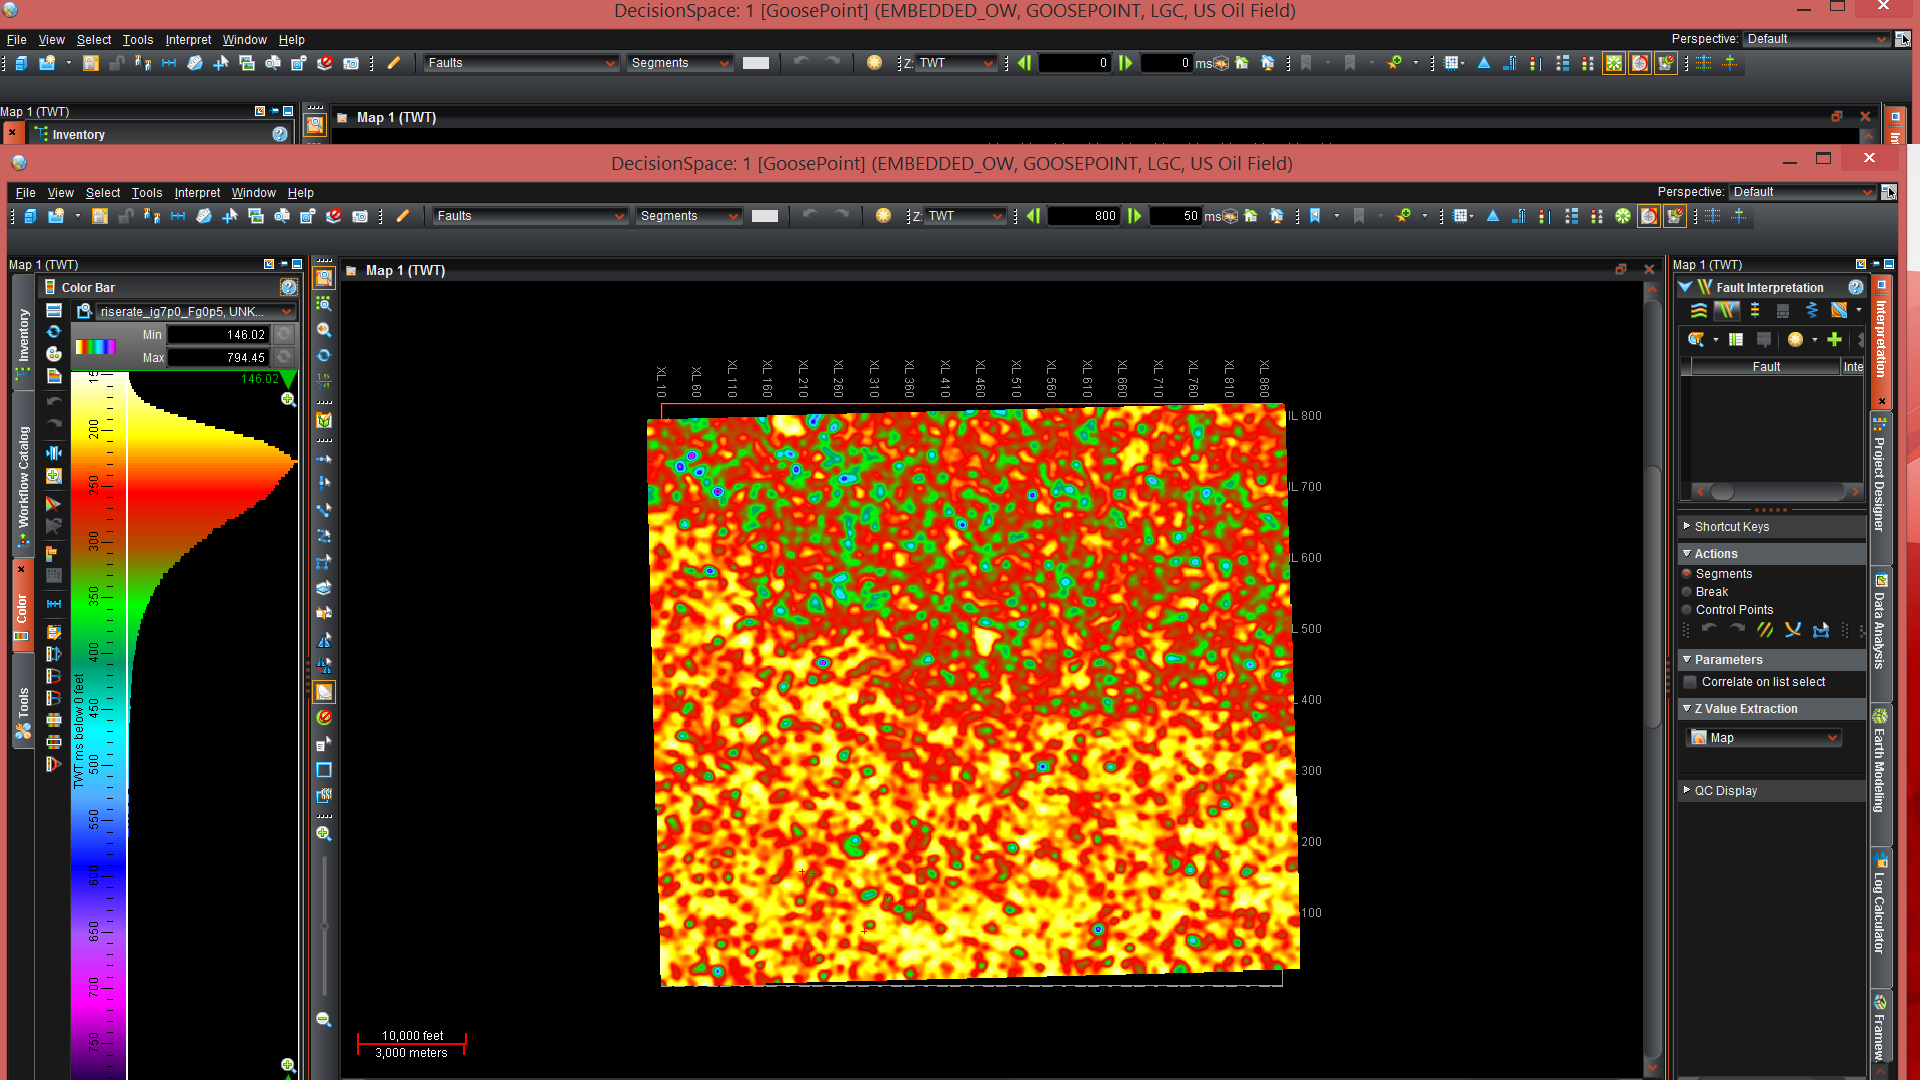
+ Strike Section, scrolling through sections | Resistivity Horizontal Slice Moved |
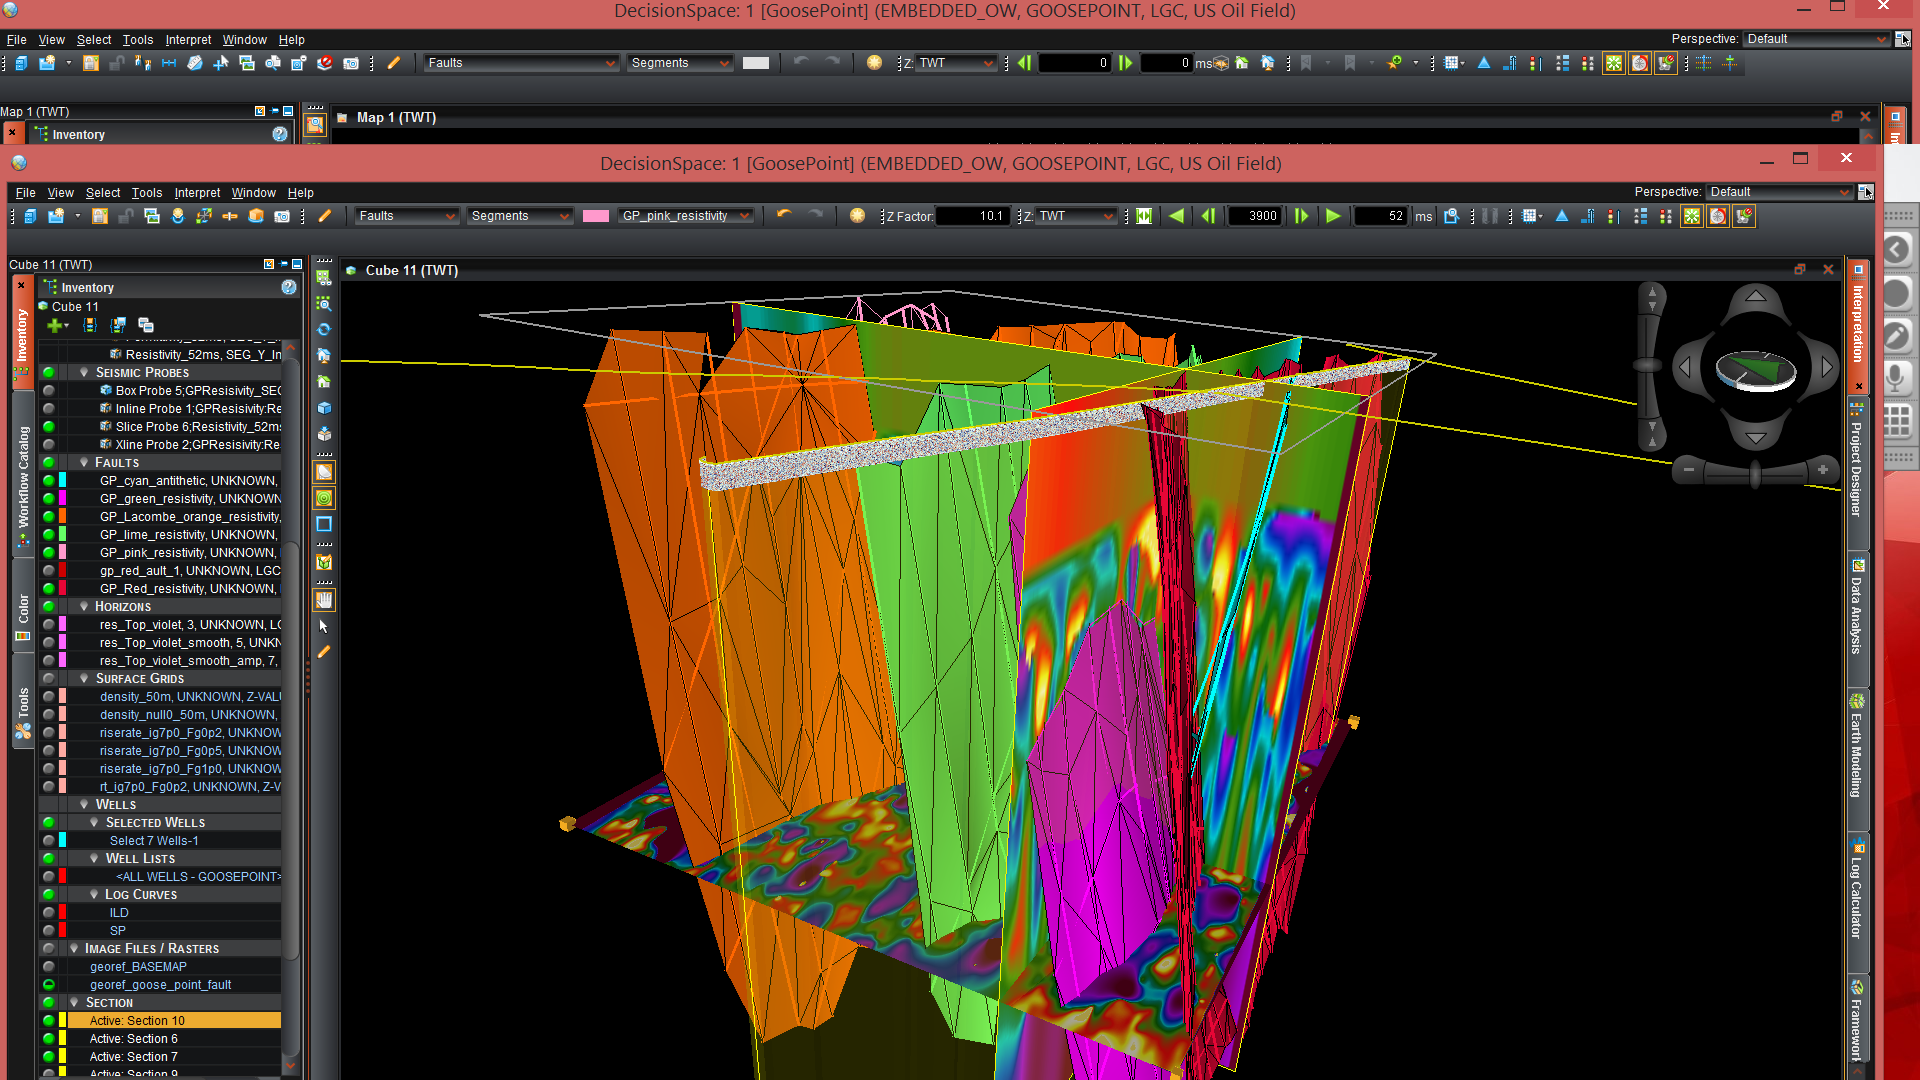
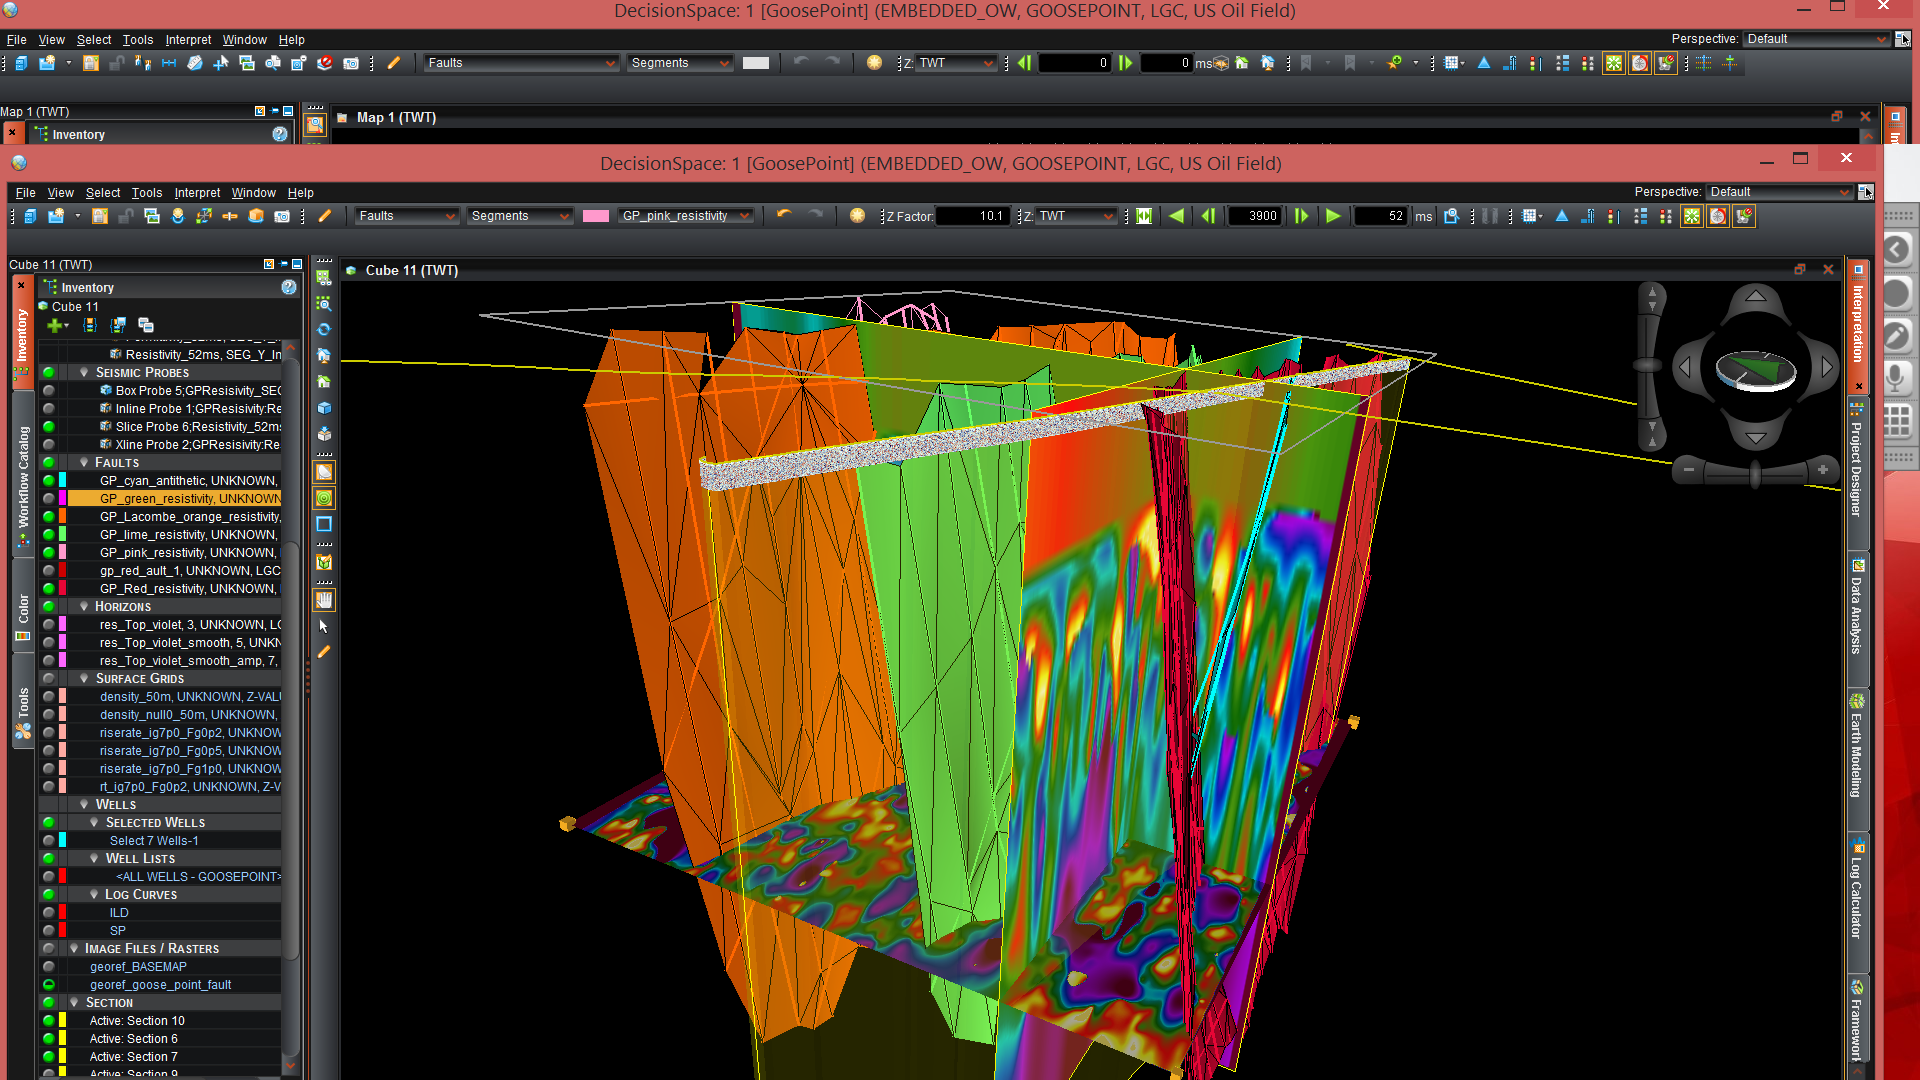
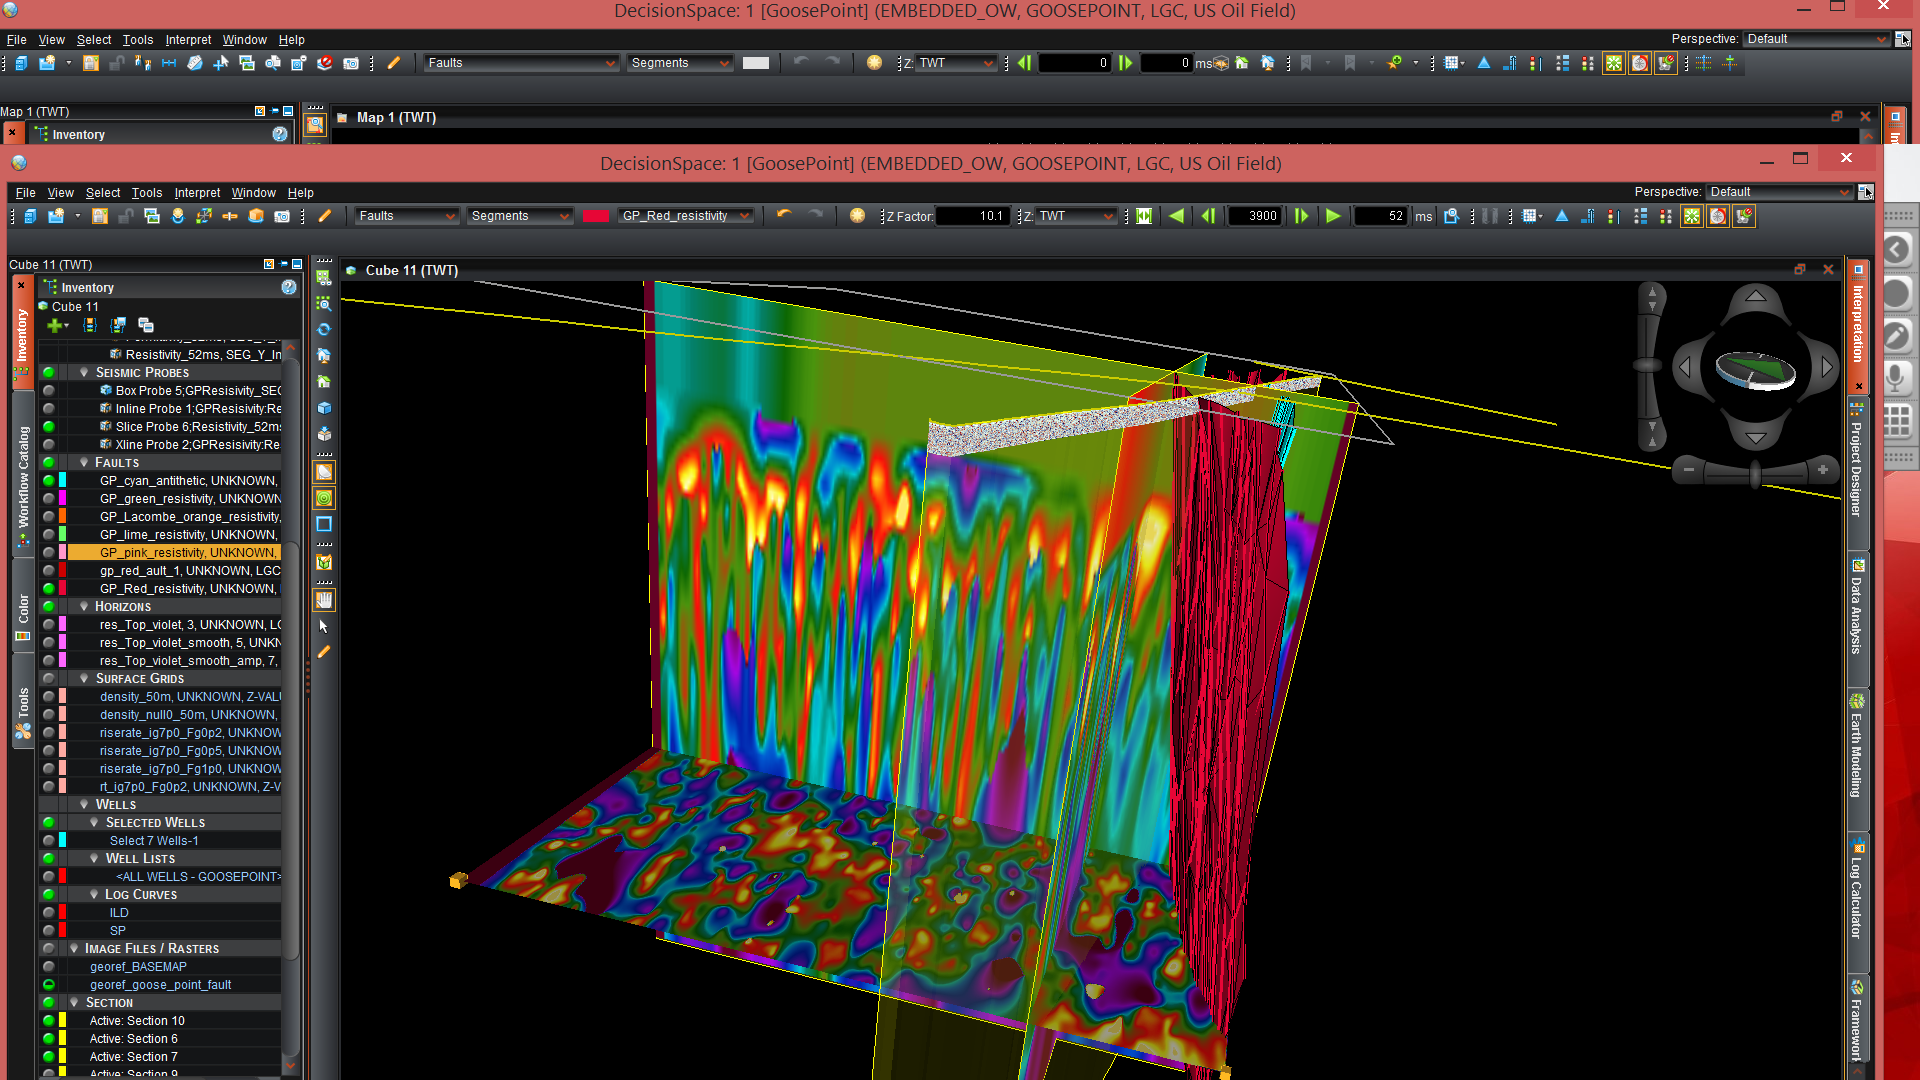
3900 ms Slice + L250 + T200 + Sparker-16 rotated | 4 Rotations of same display shown to left |
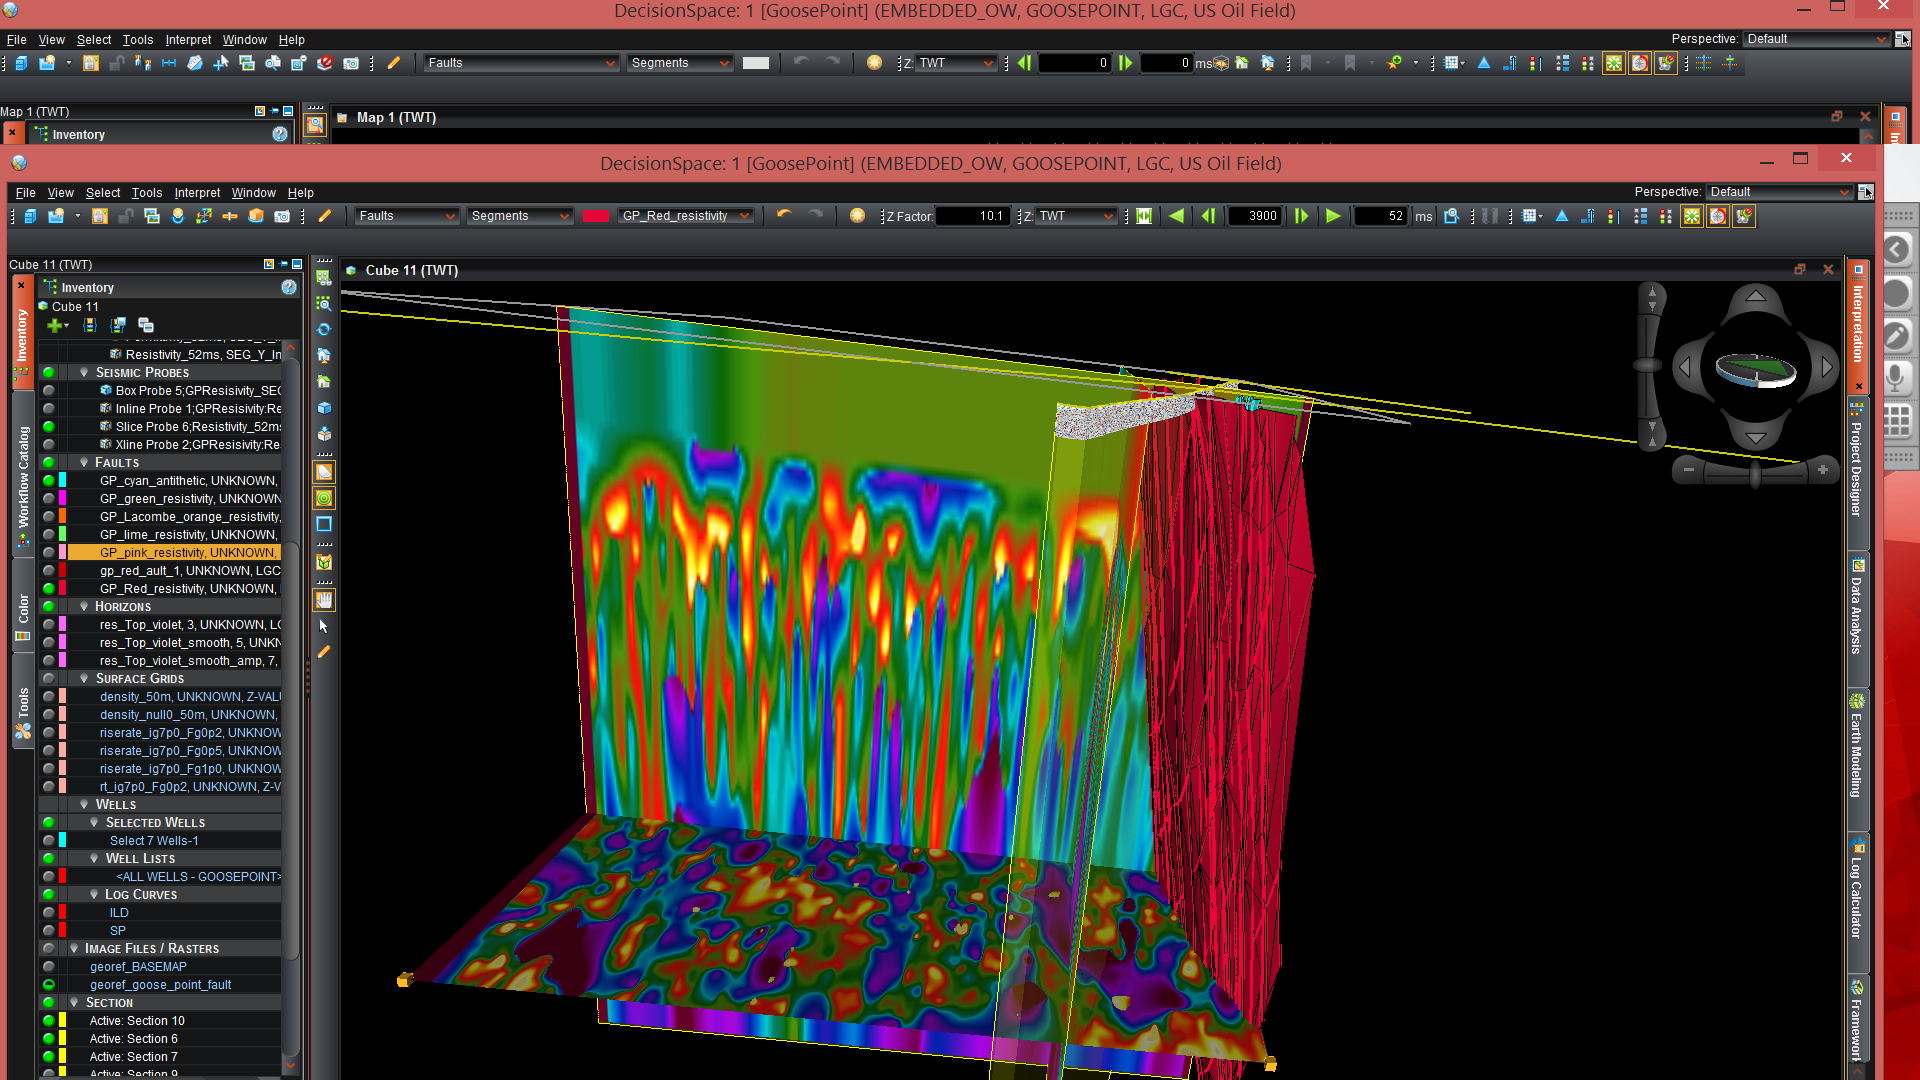
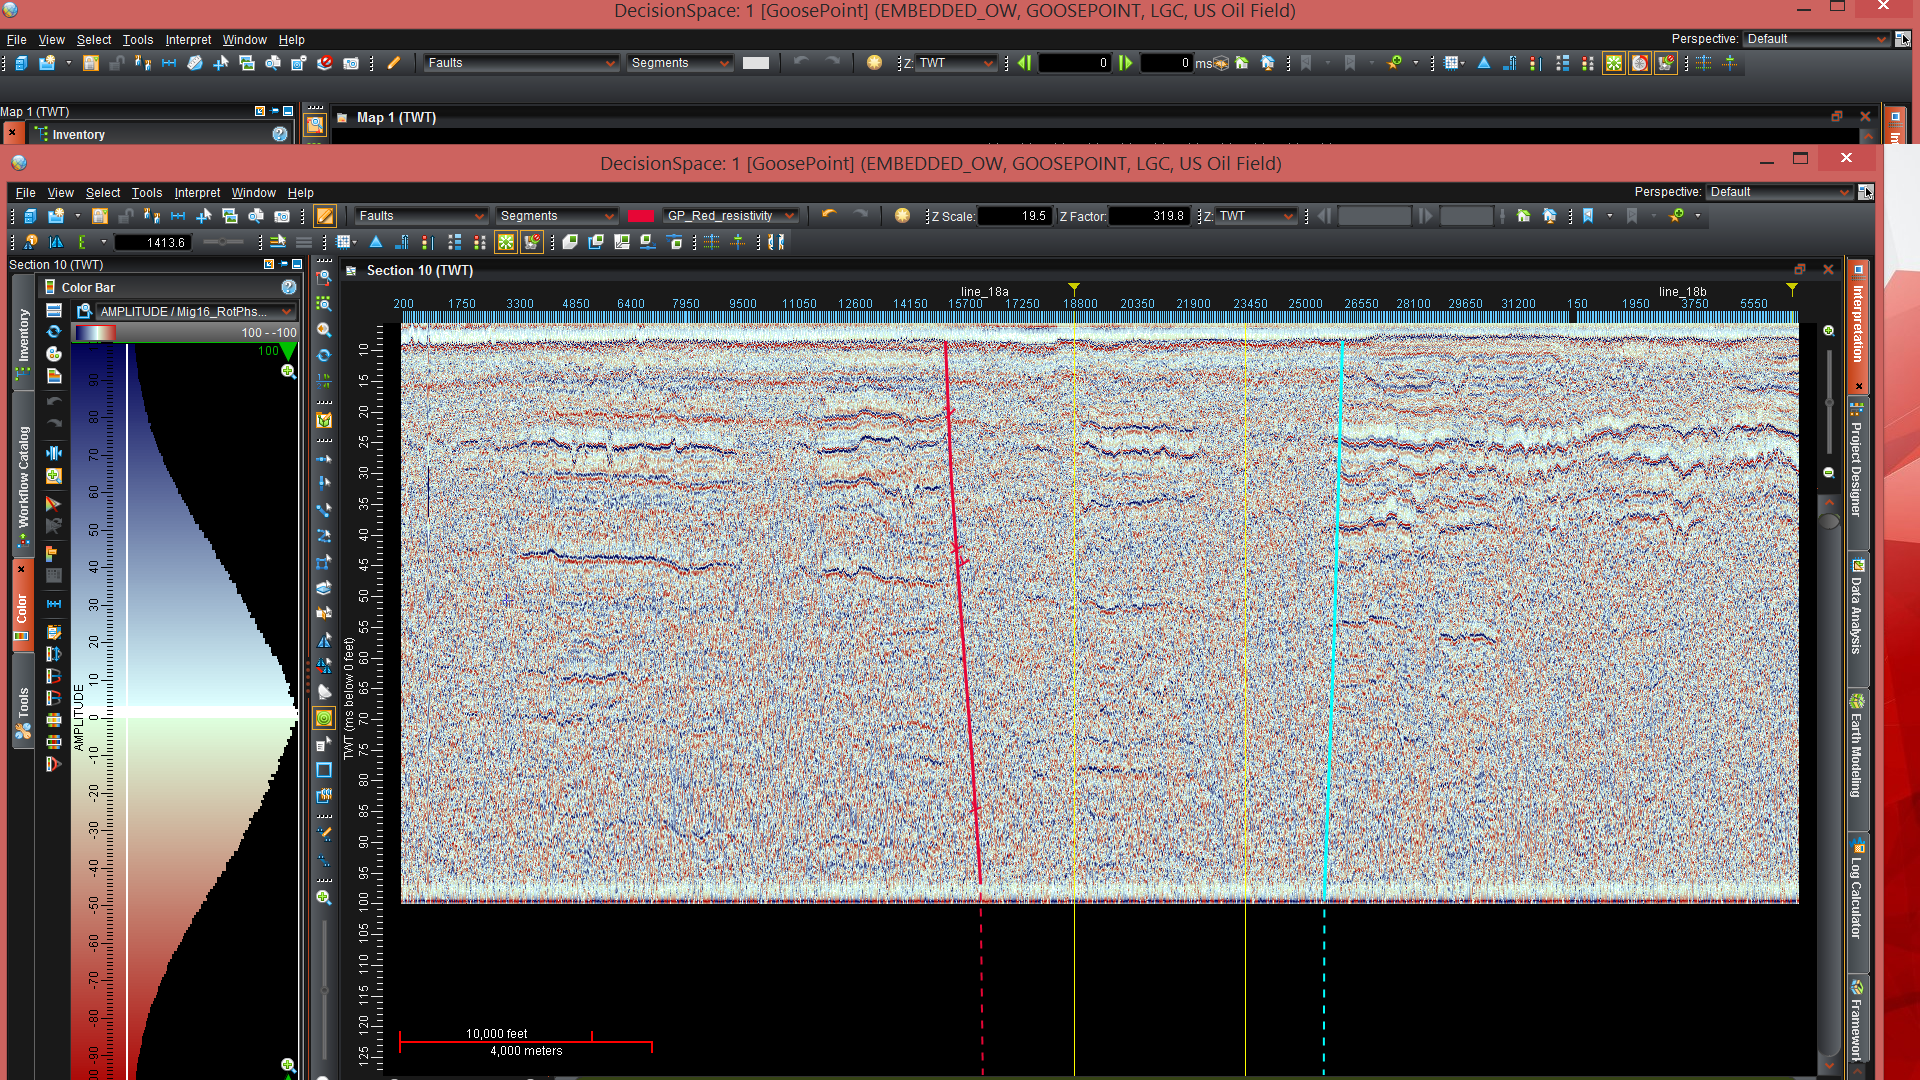
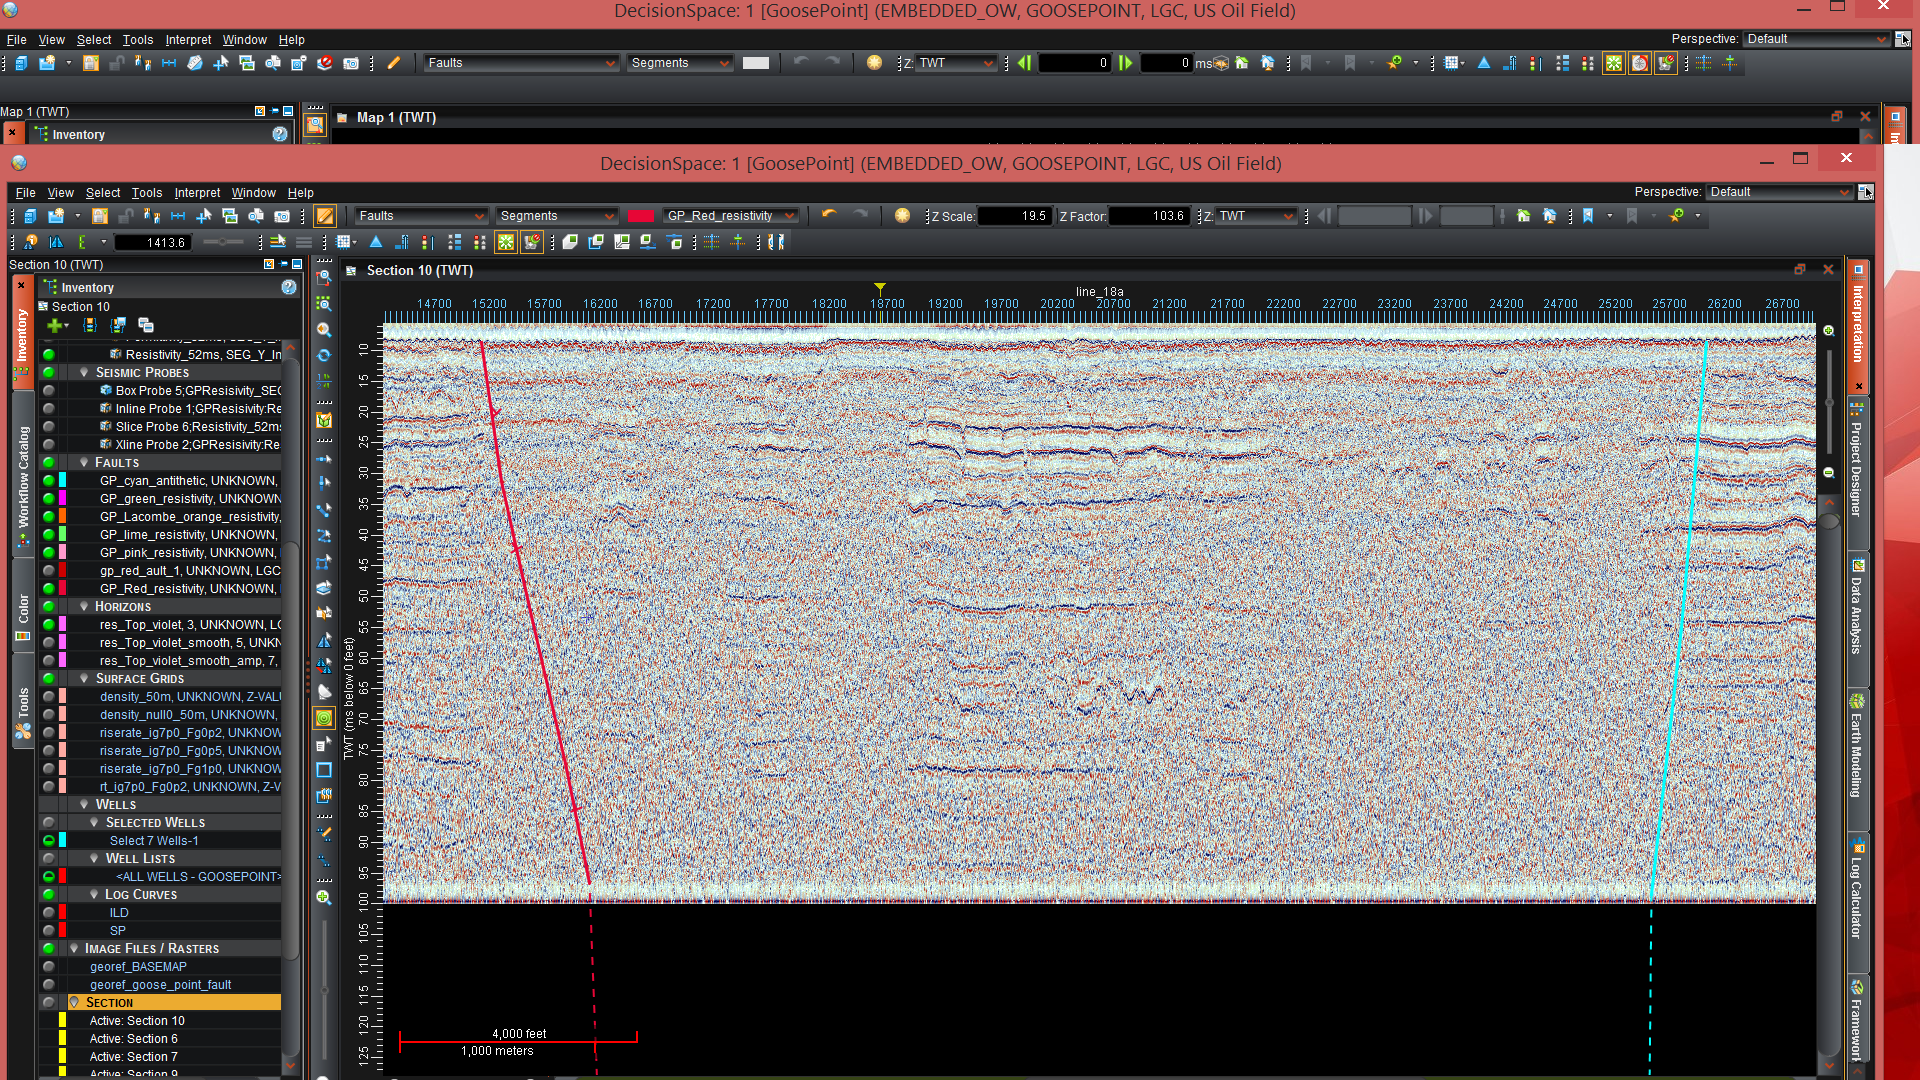
4 Rotations and Zoom of display shown to left | Sparker 18A, 18B, zoom, Red+Cyan Faults Res Perm |
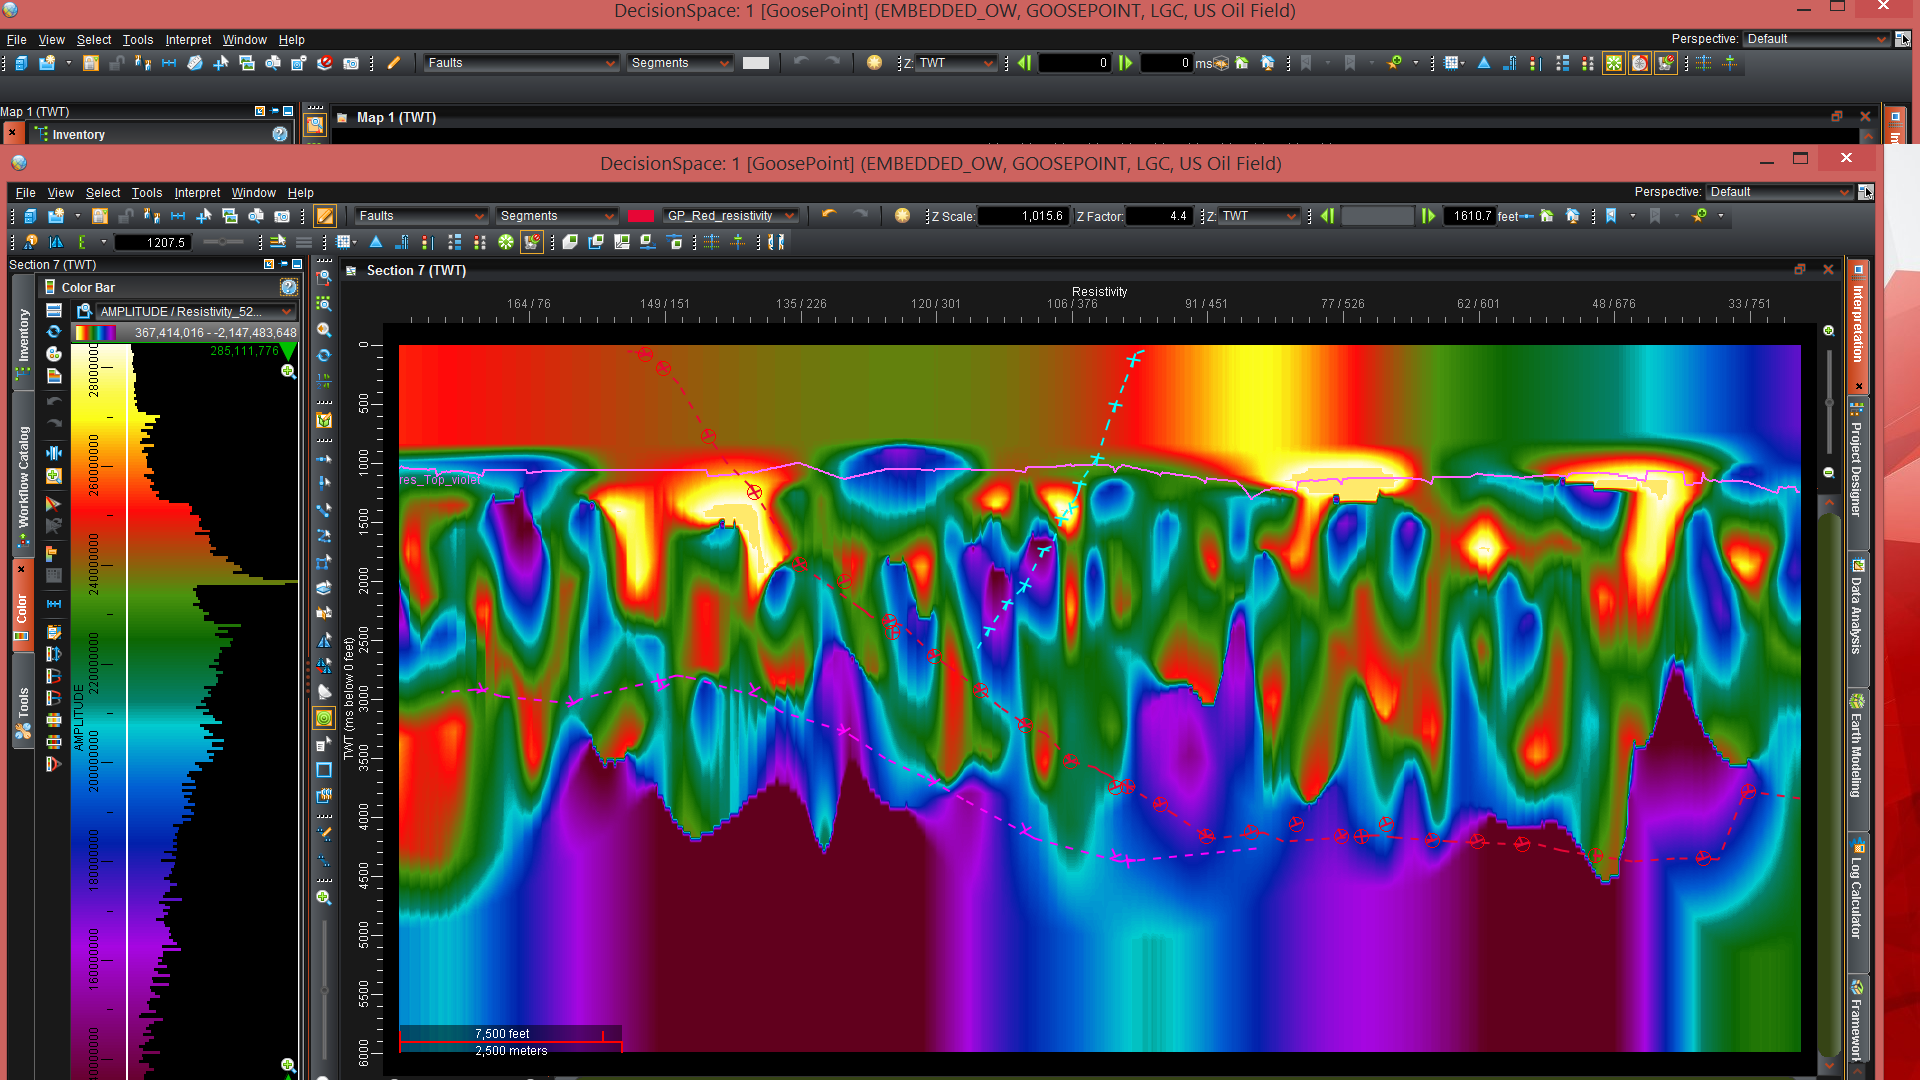
GIS + Apparent Resistivity + Permittivity | Permittivity, Resistivity + Logs, Scaled R-R |
 |  |
 |  |
 |  |
 |  |
 |  |
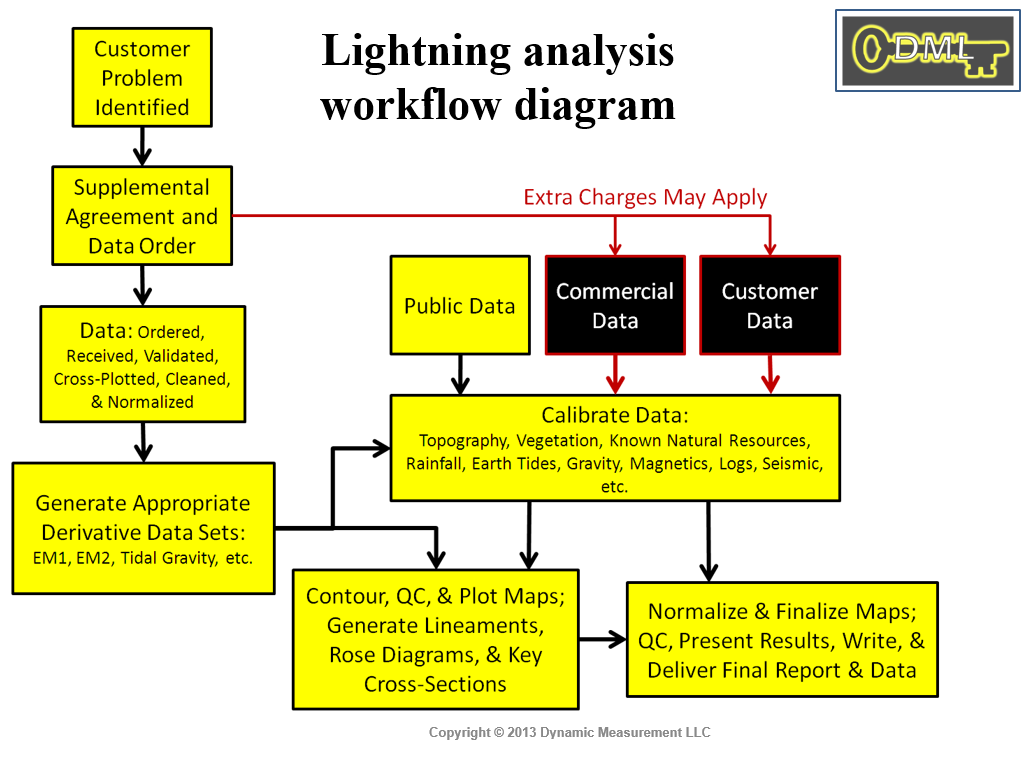
| Analysis Workflow Diagram | Raw Data Validation Display of Strikes |
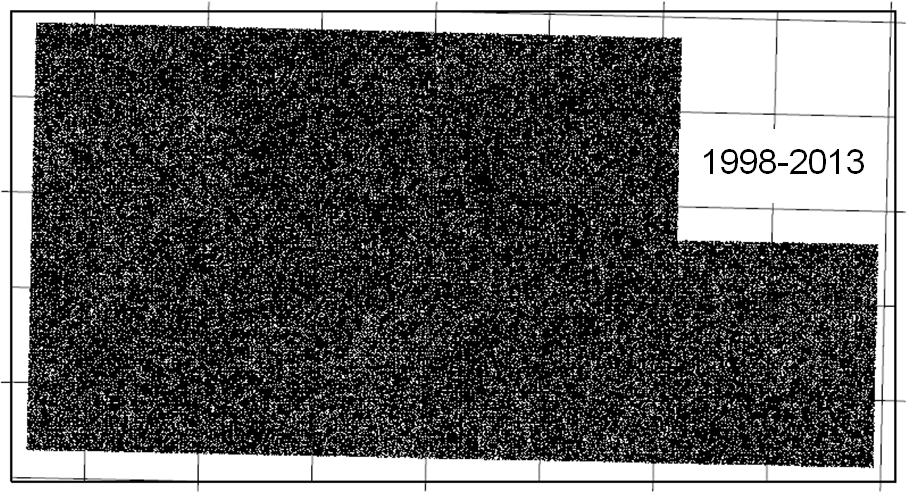
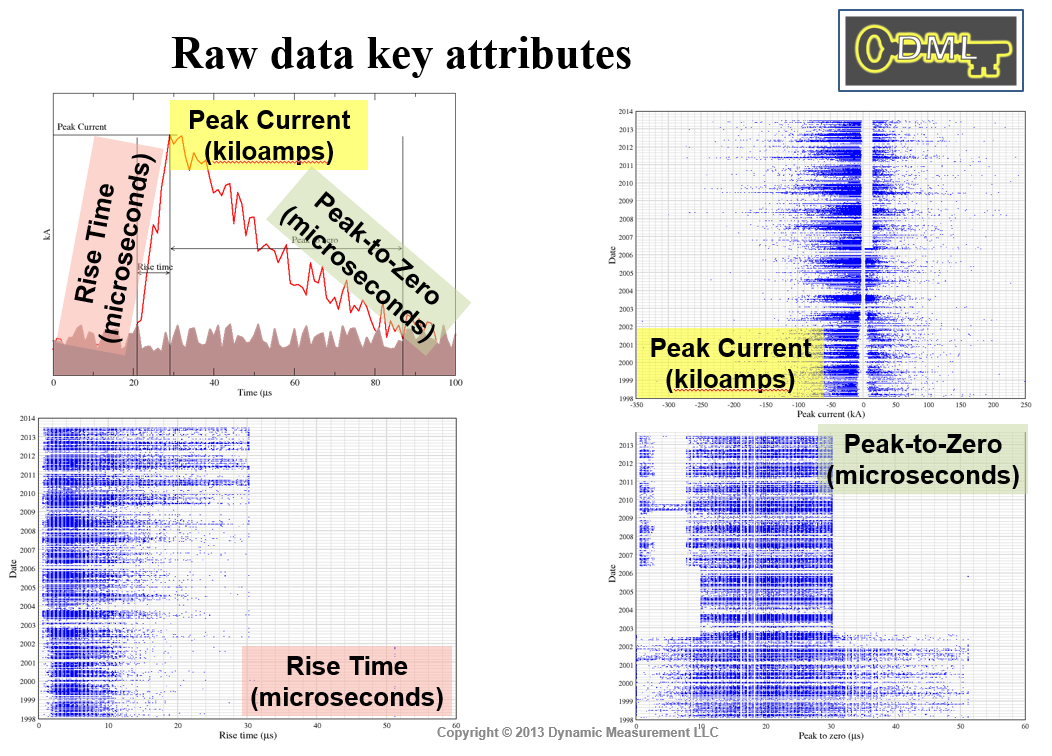
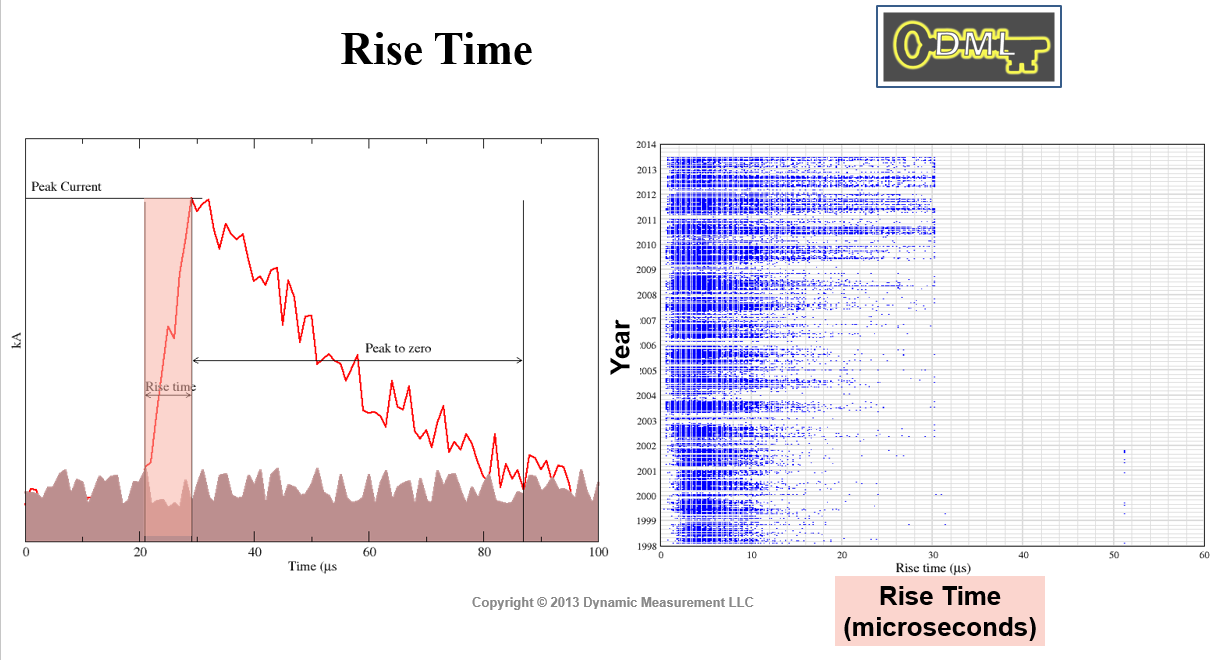
Rise-Time, Peak Current, Peak-to-Zero Data | Rise-Time Lightning Data Values |
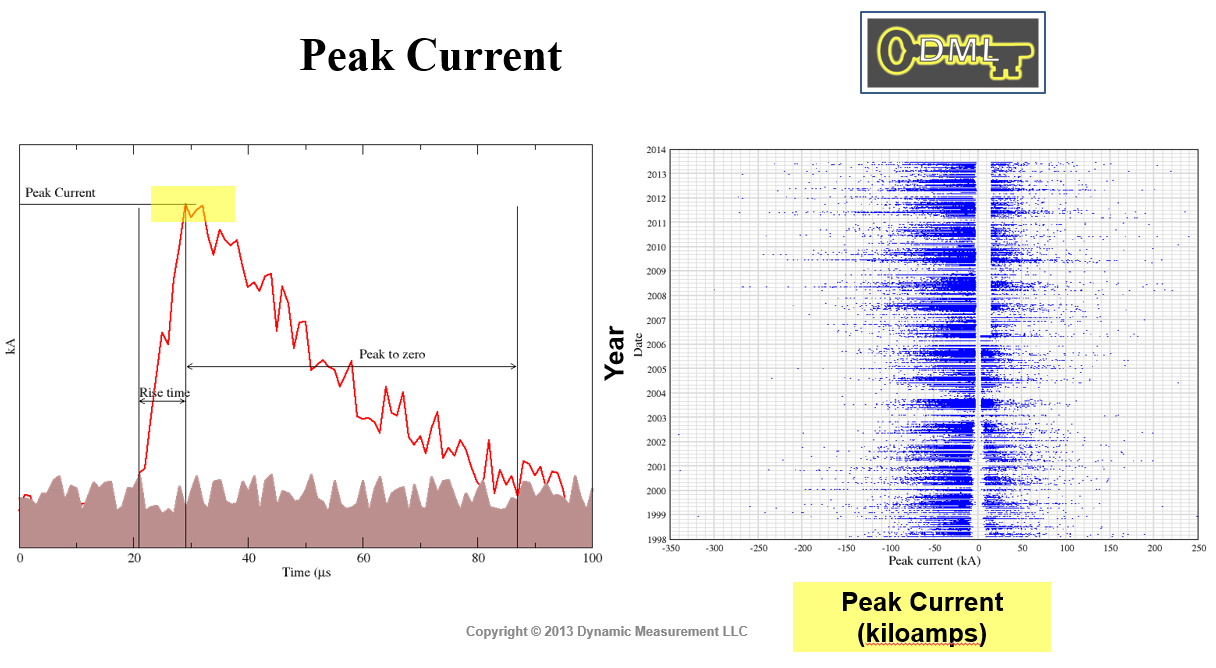
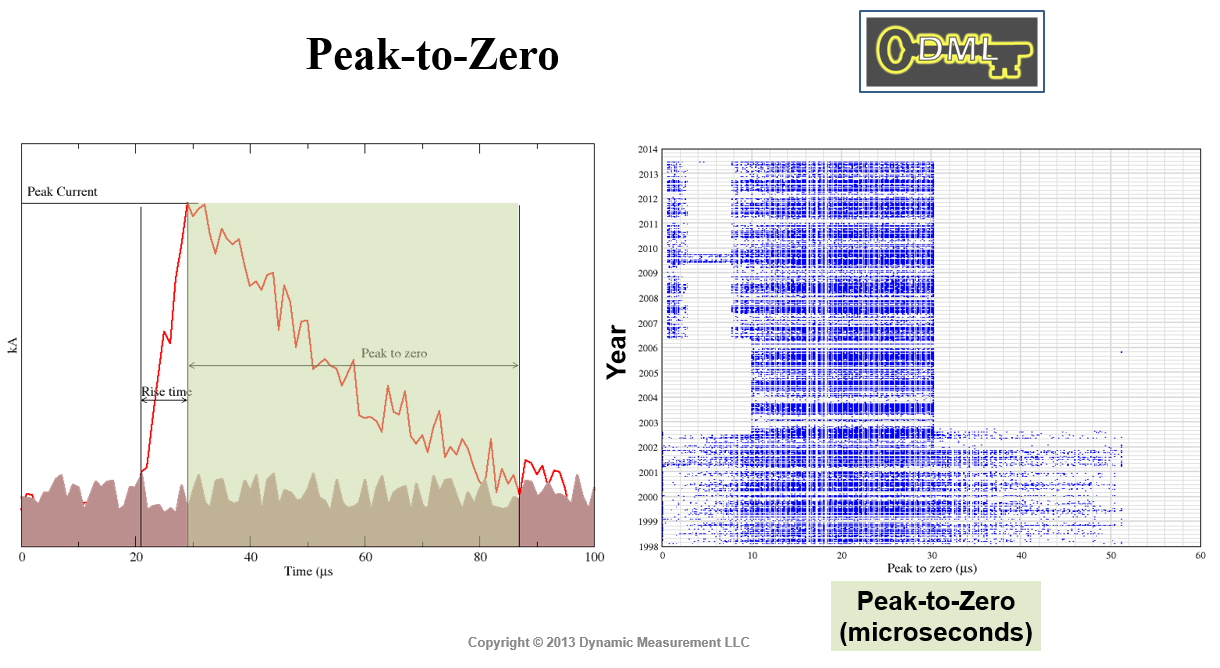
Peak Current Lightning Data Values | Peak-to-Zero Lightning Data Values |
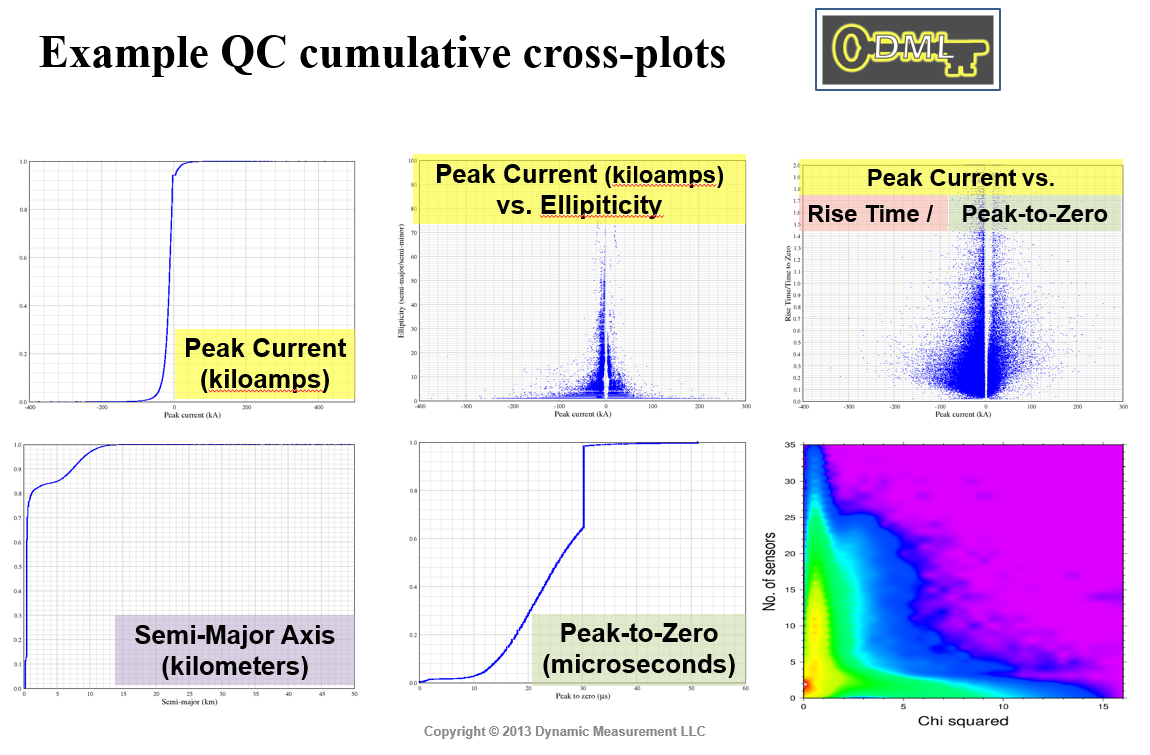
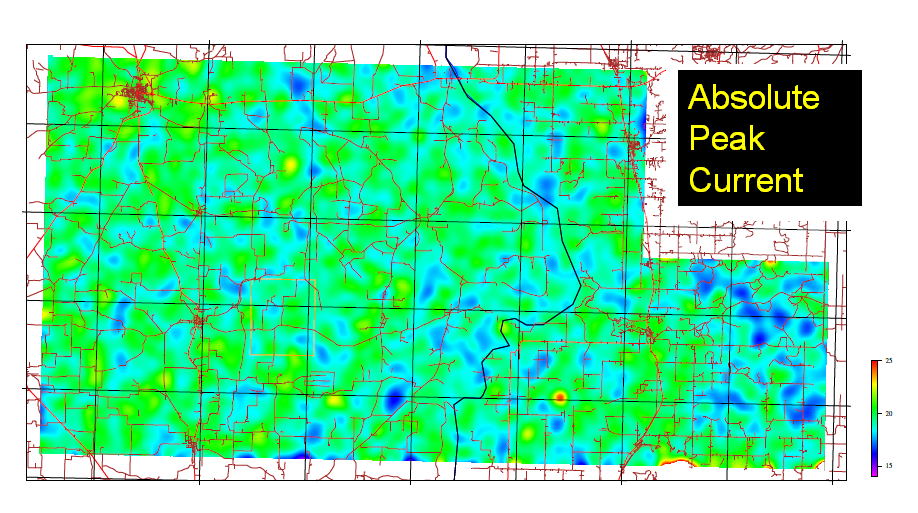
Example QC Cumulative Cross-Plots | Absolute Peak Current Lightning Map |
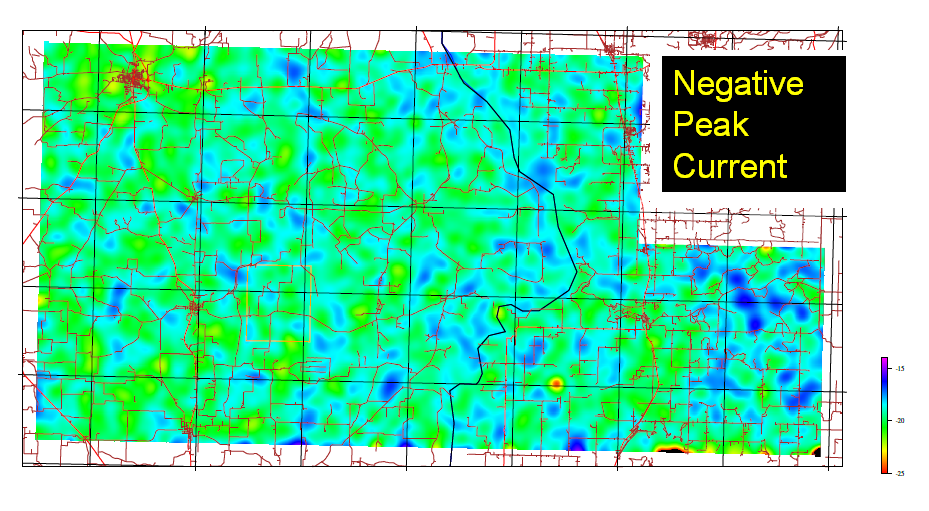
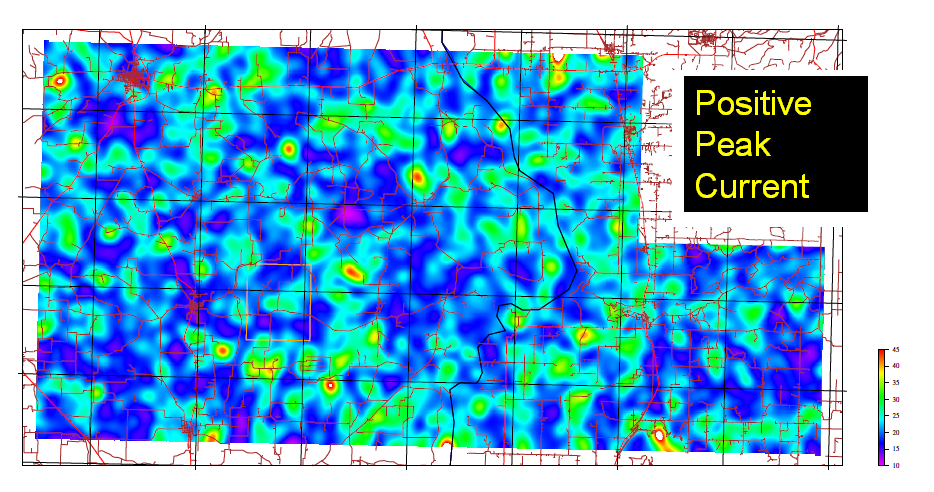
Negative Peak Current Lightning Map | Positive Peak Current Lightning Map |
 |  |
 |  |
 |  |
 |  |
 |  |
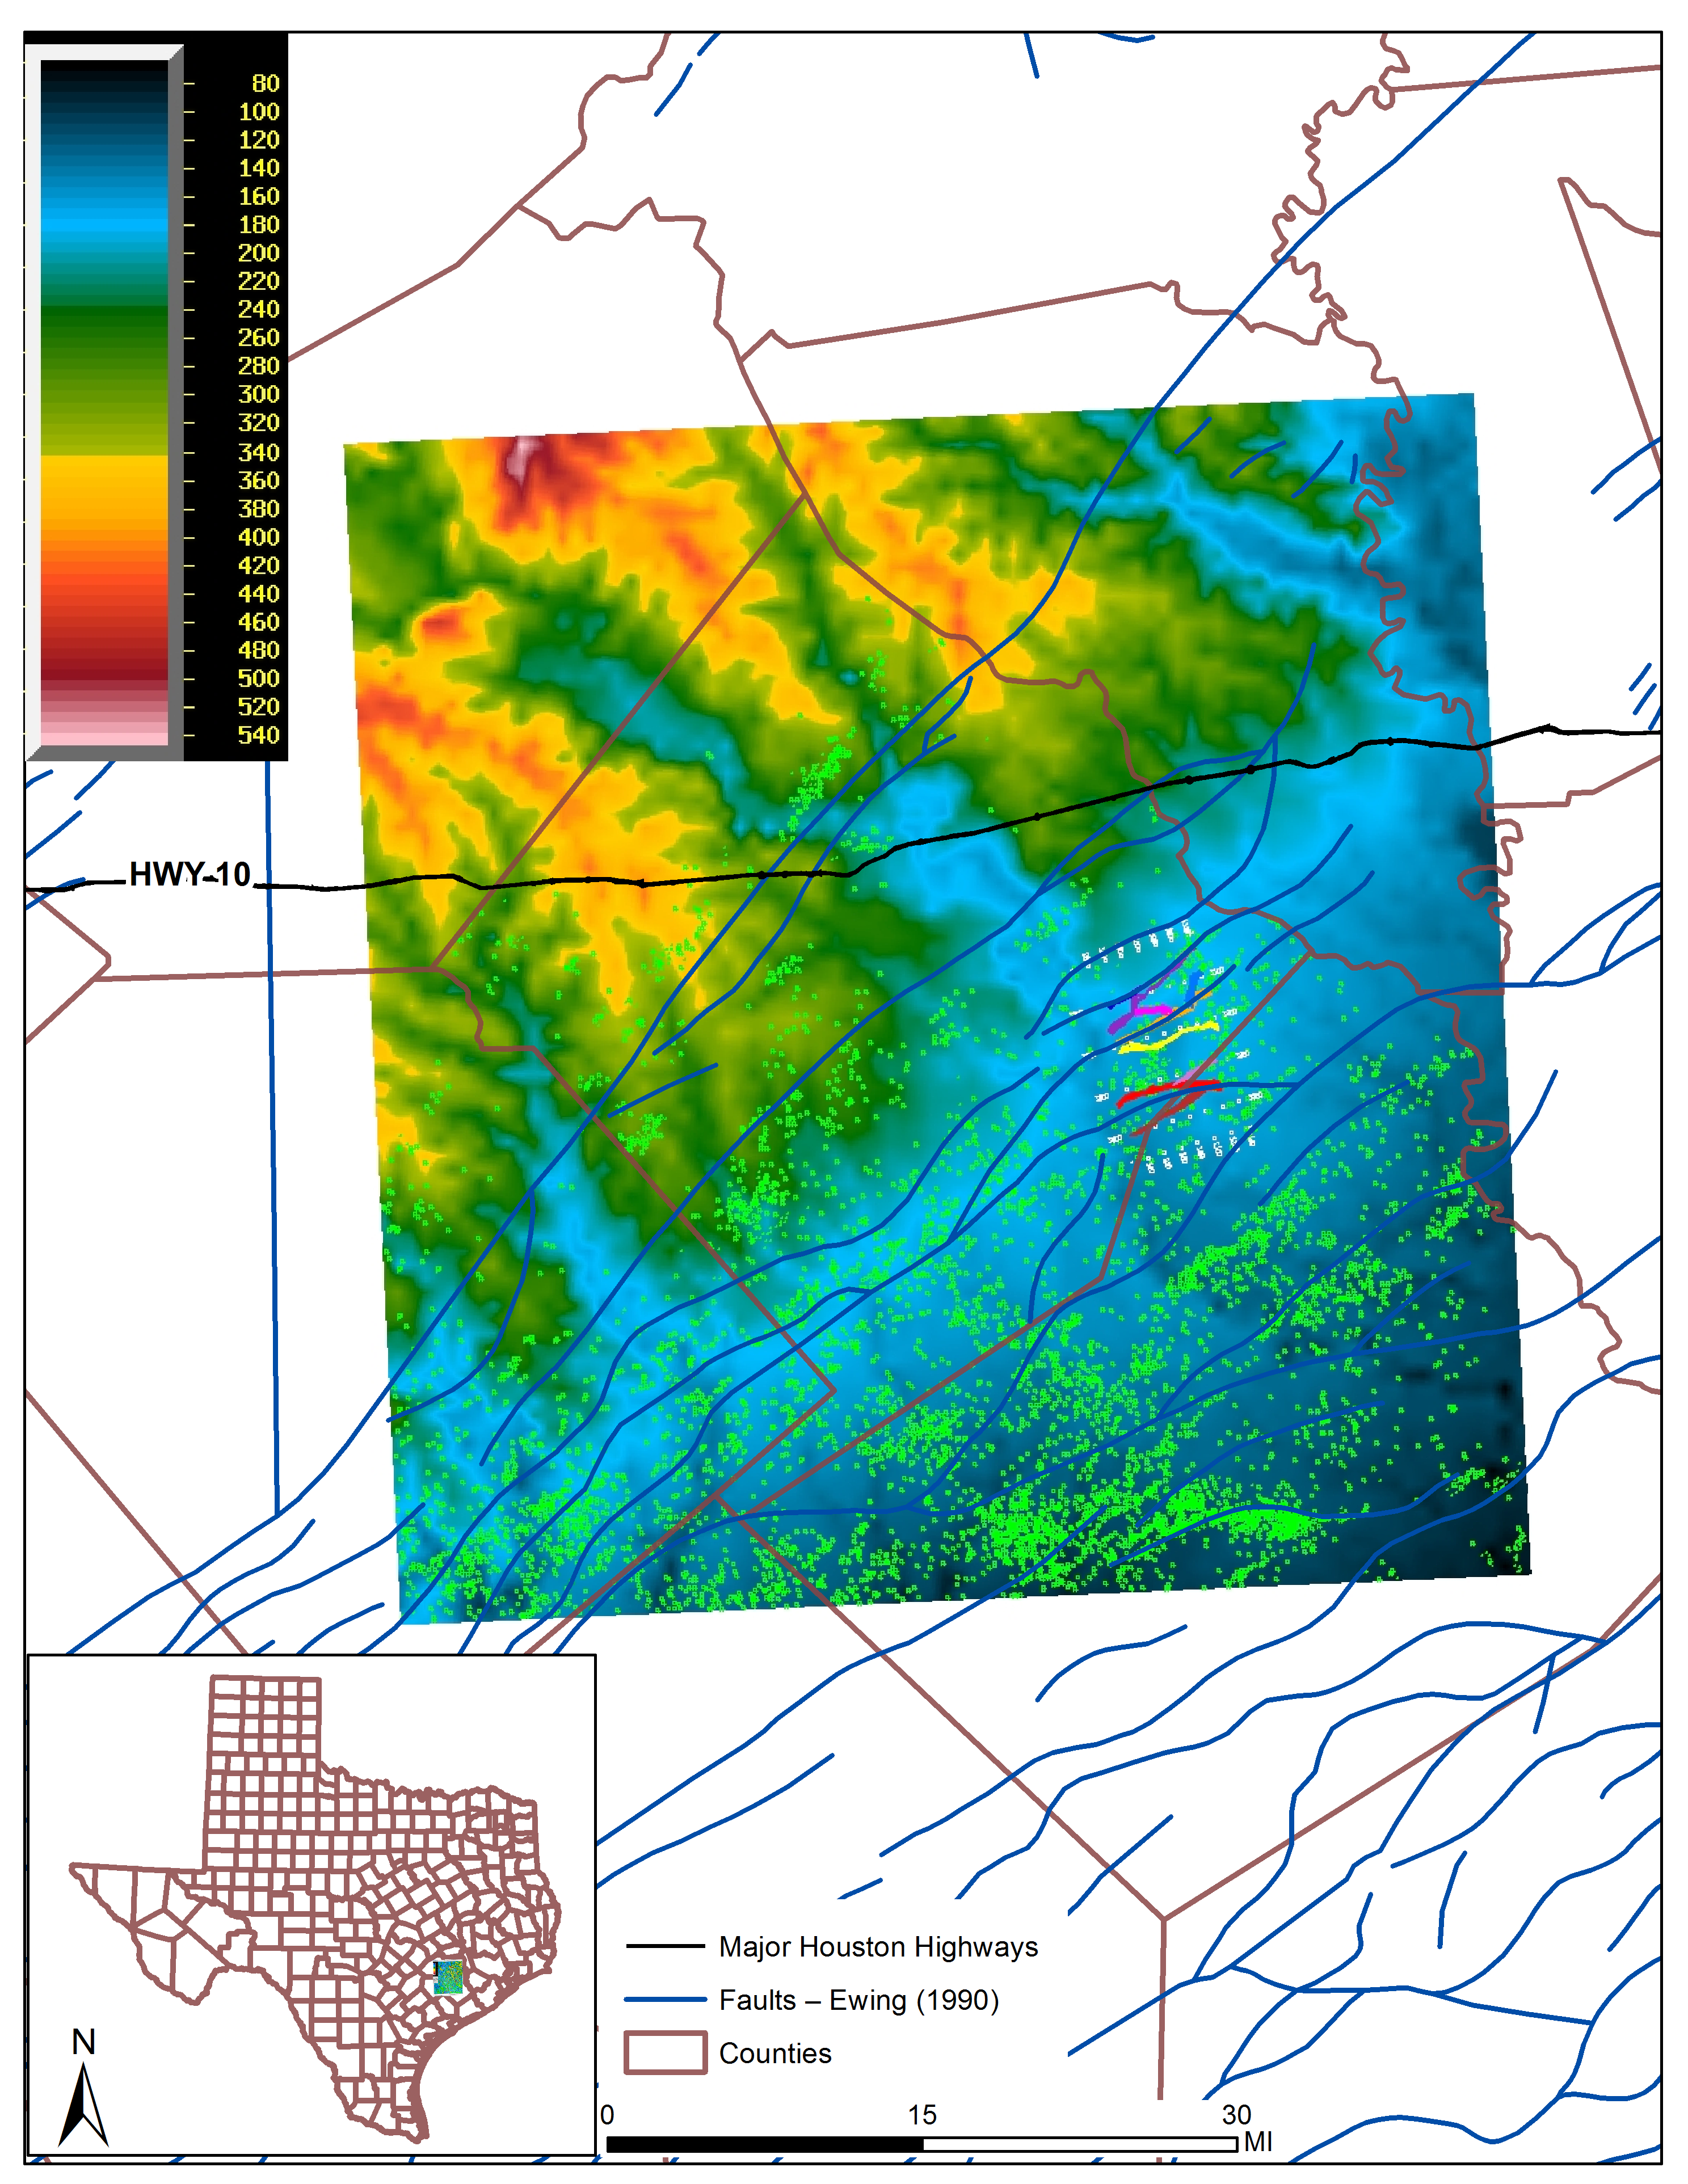
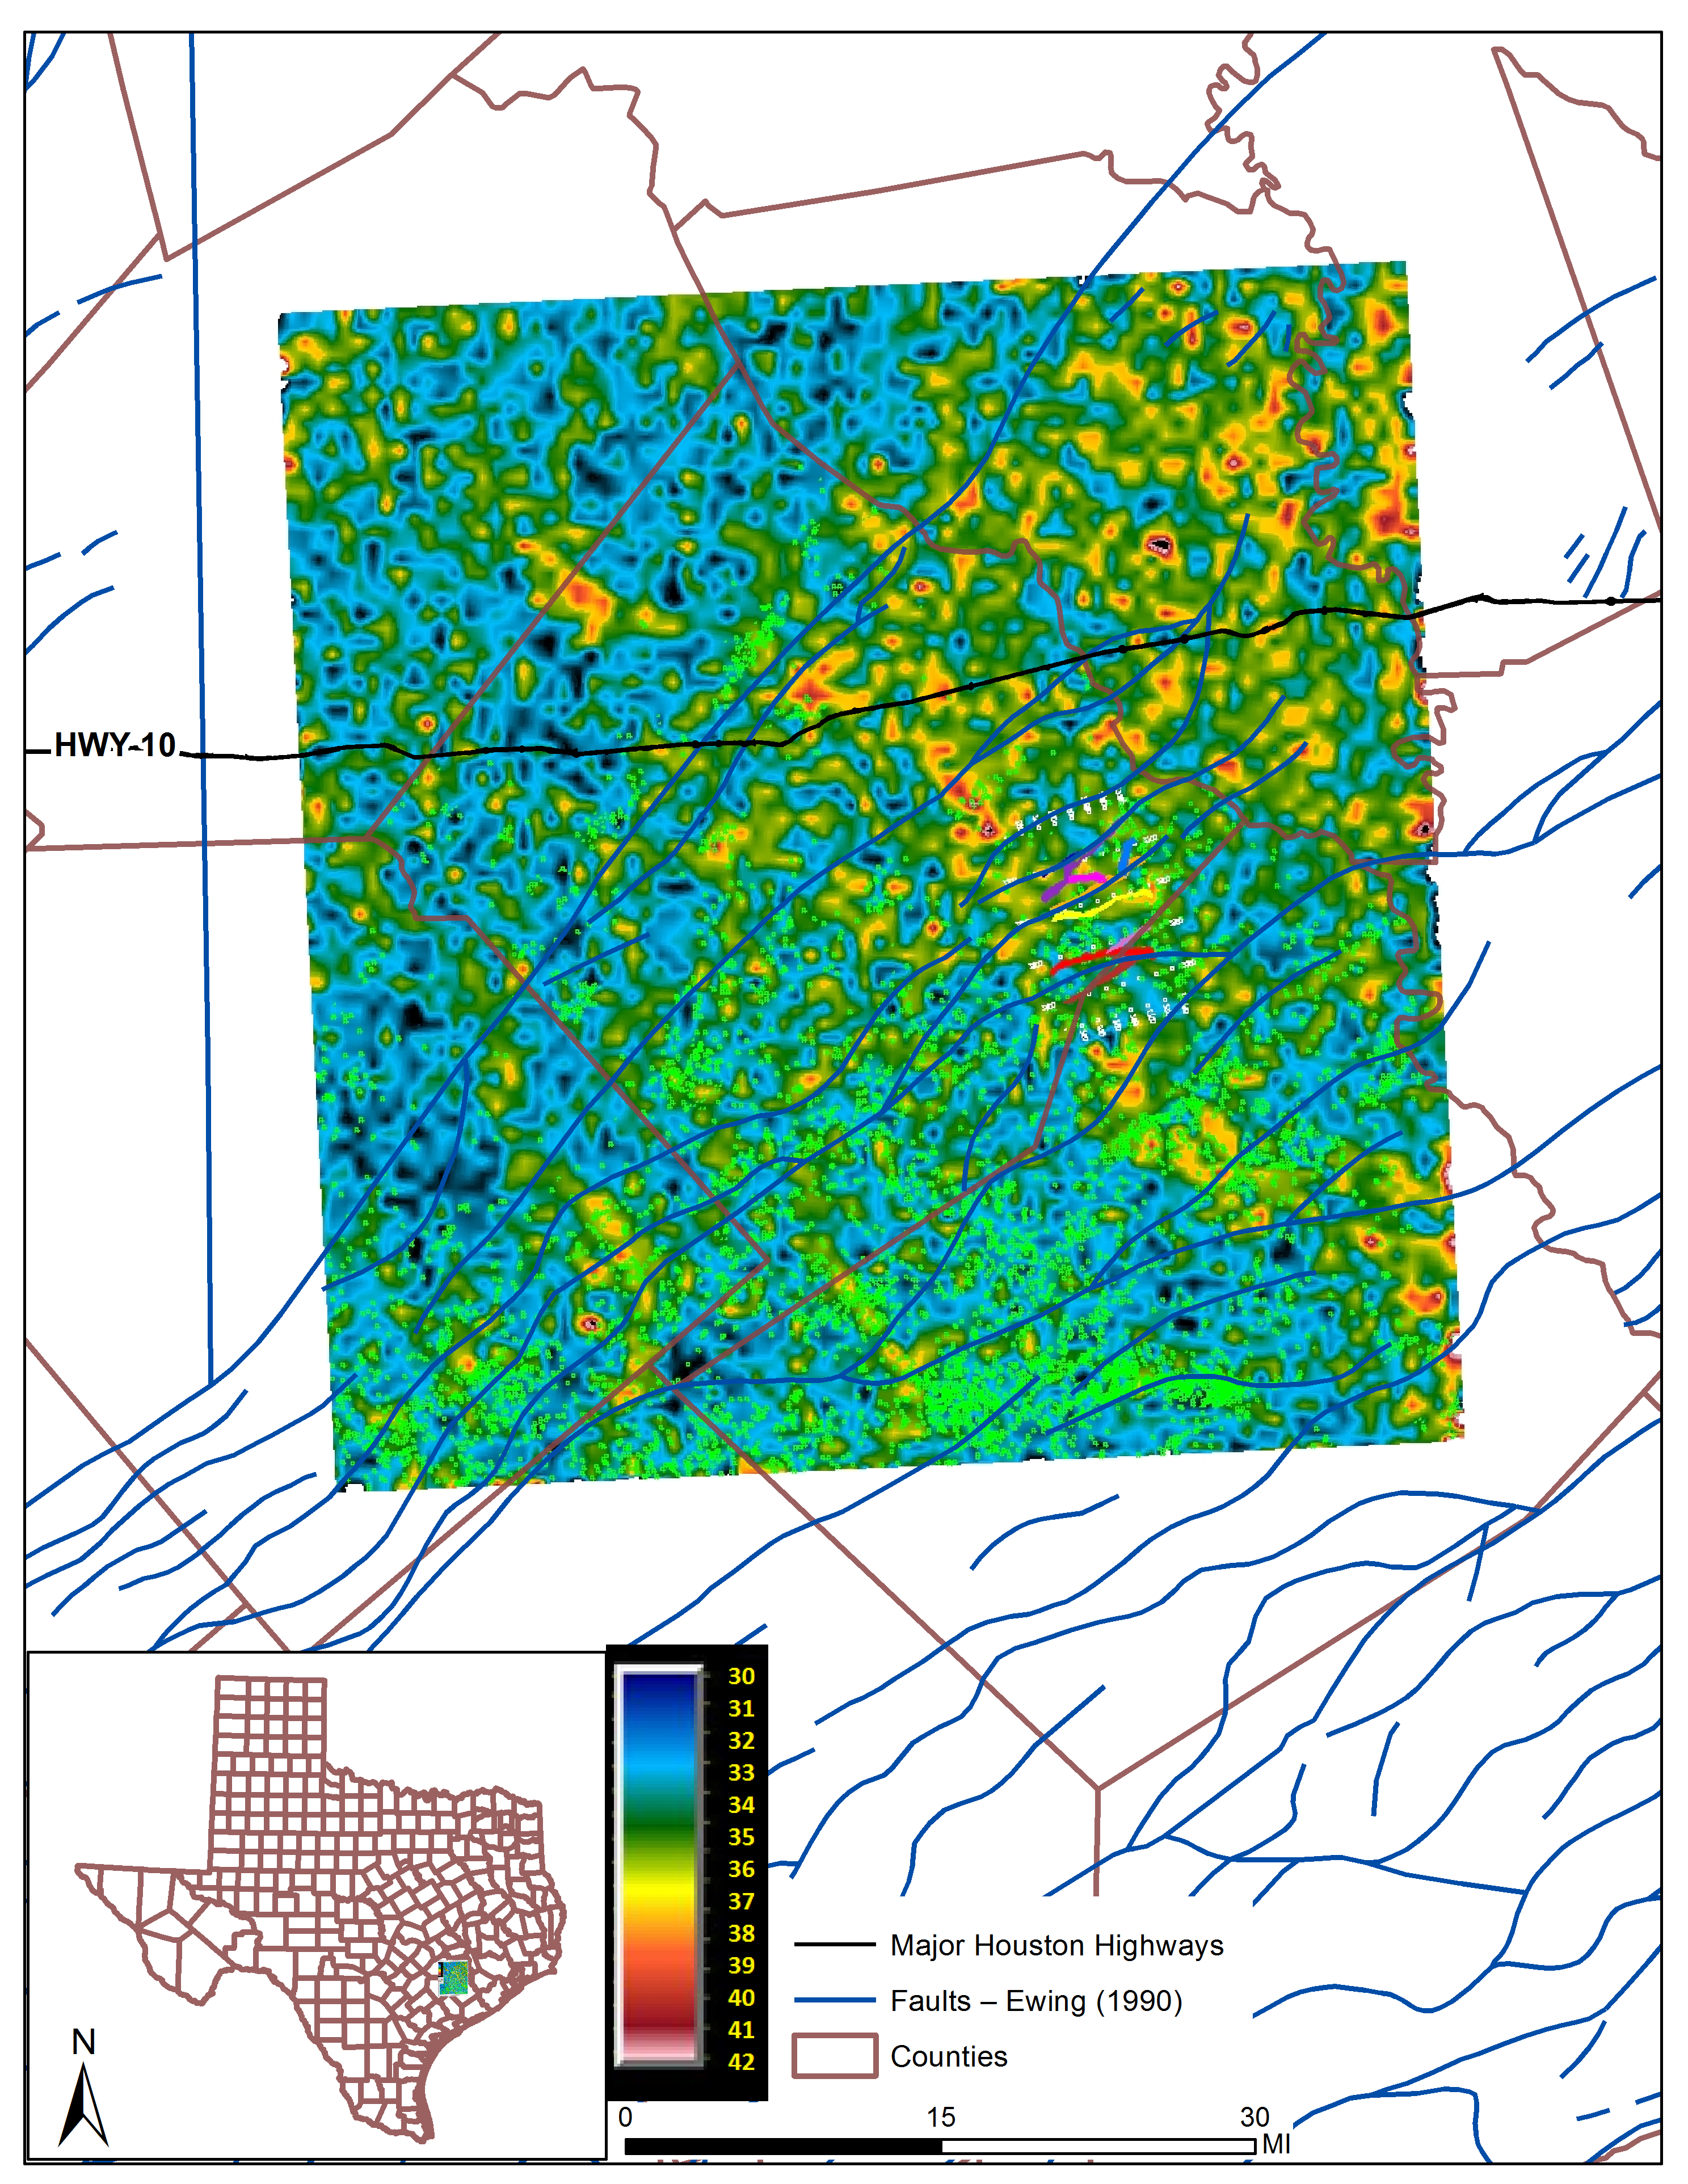
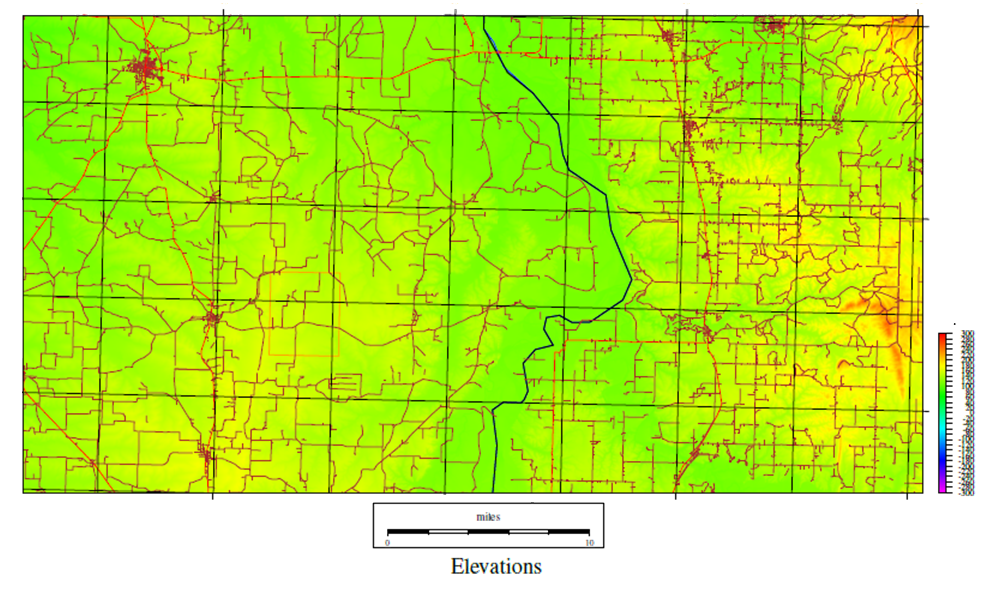
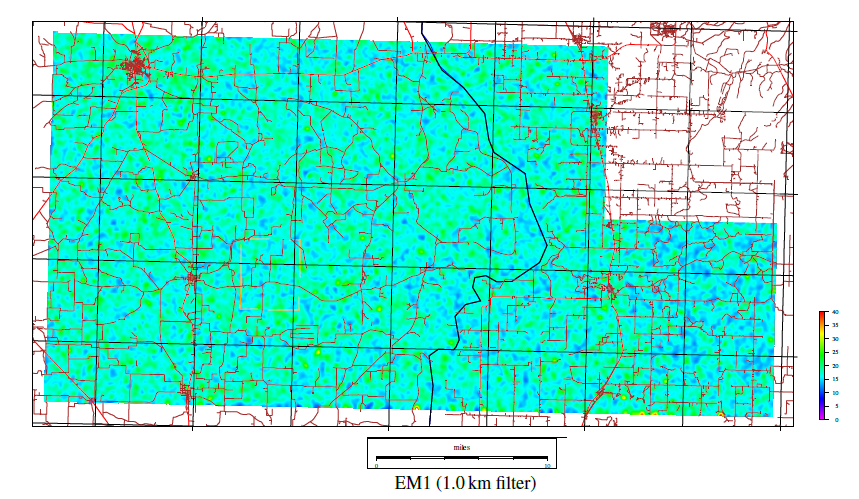
| Topography Map over Project Area | EM1 over Project Area |
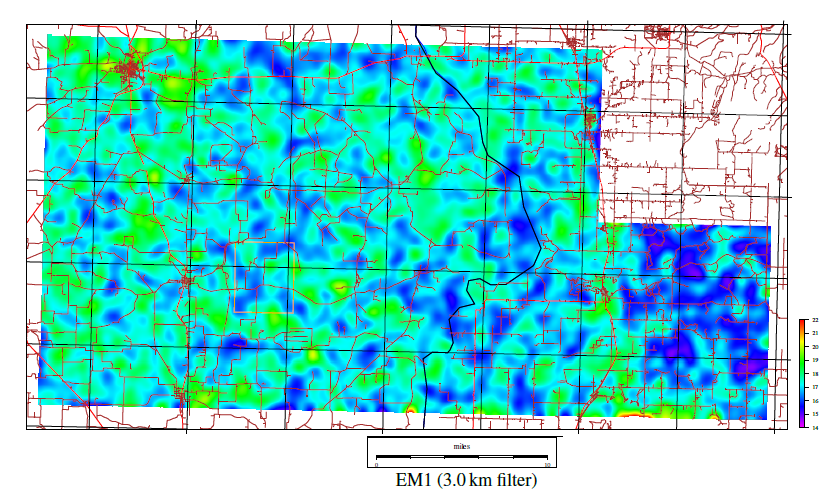
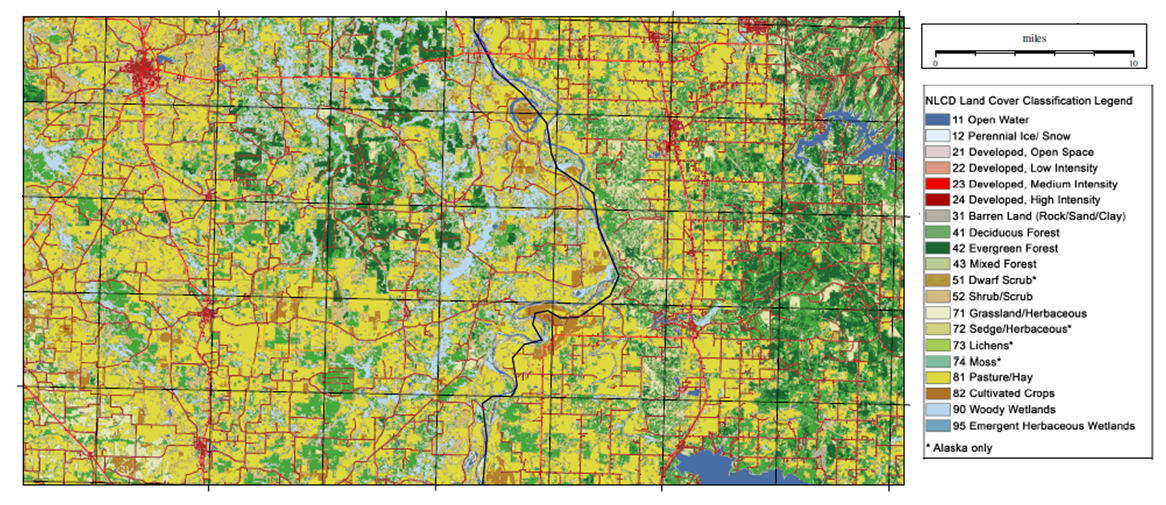
EM1 (3km Filter) over Project Area | Map Land Cover Classification |
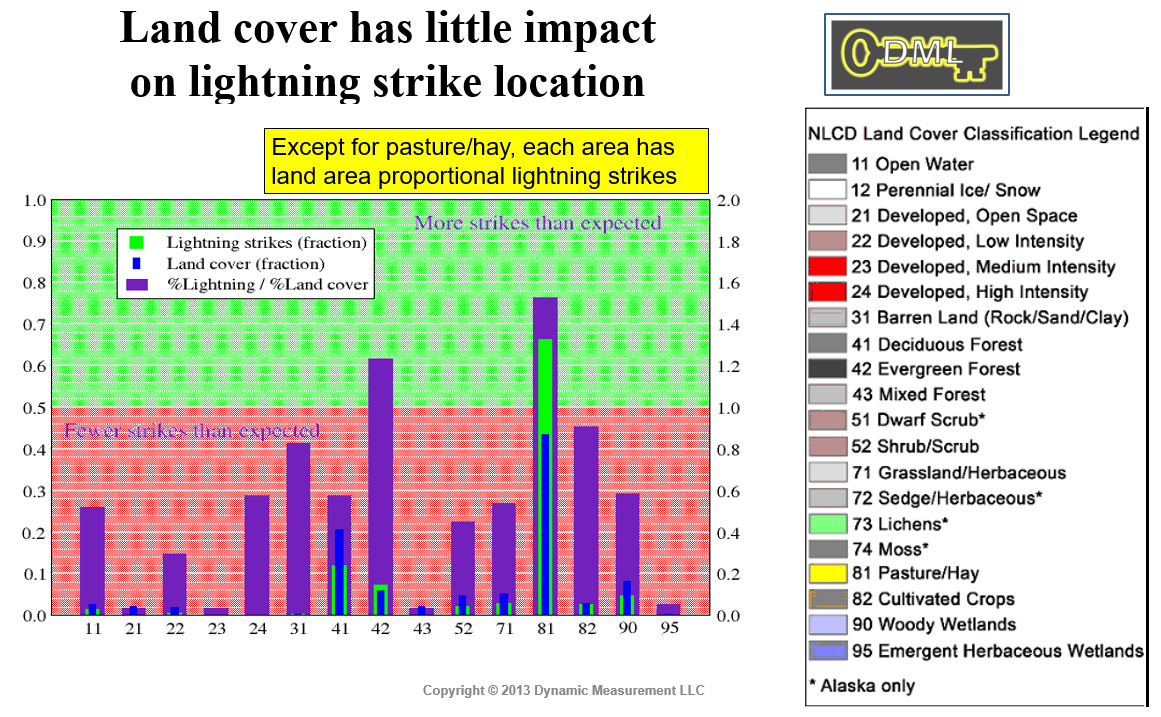
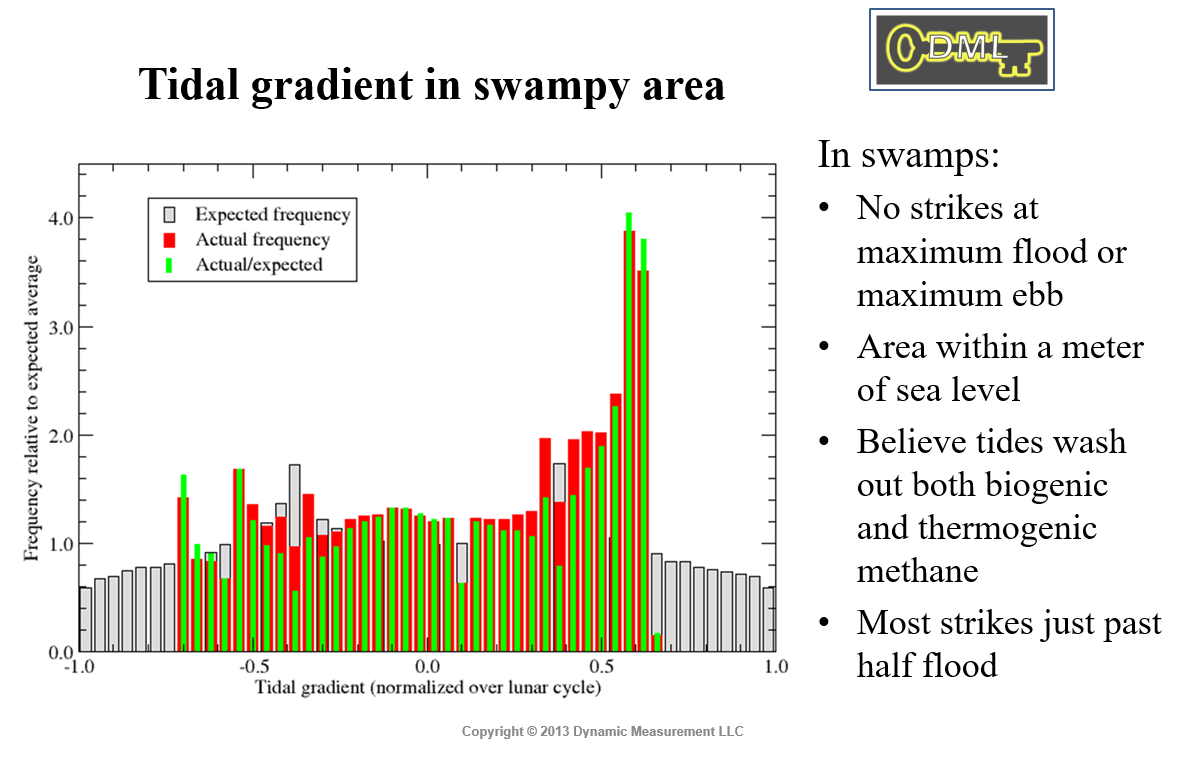
Land Cover Little Strike Impact | Florida Tidal Gradient |
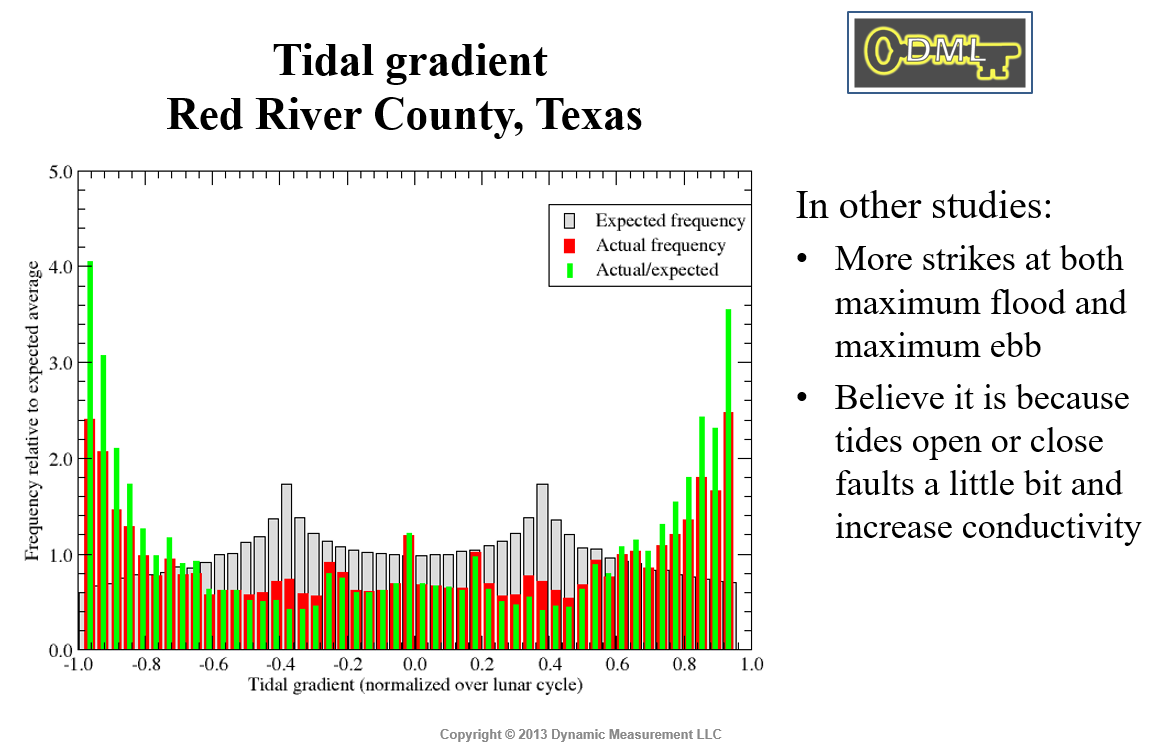
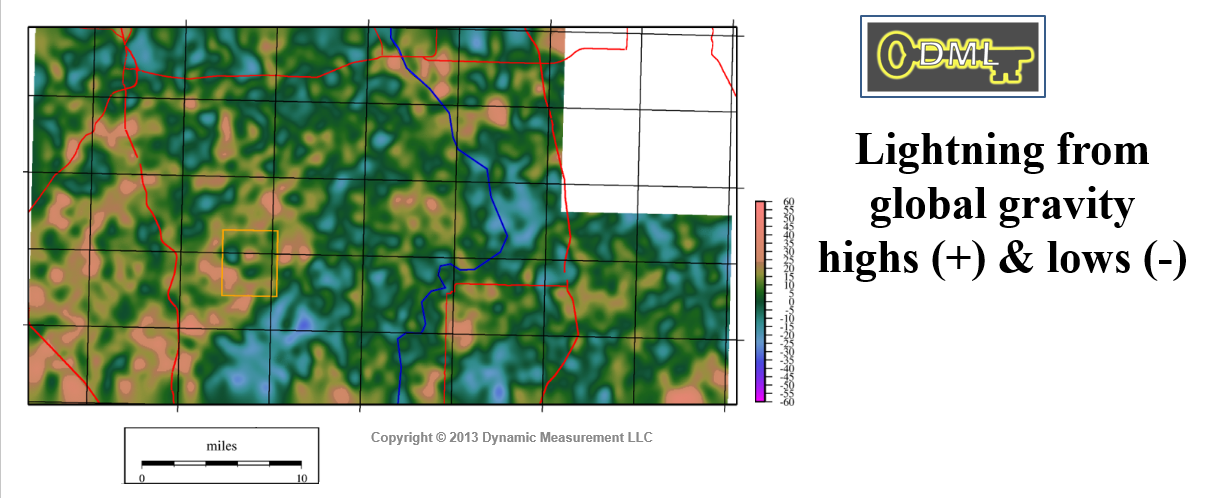
Red River County Tidal Gradient | Lightning Gravity Highs/Lows |
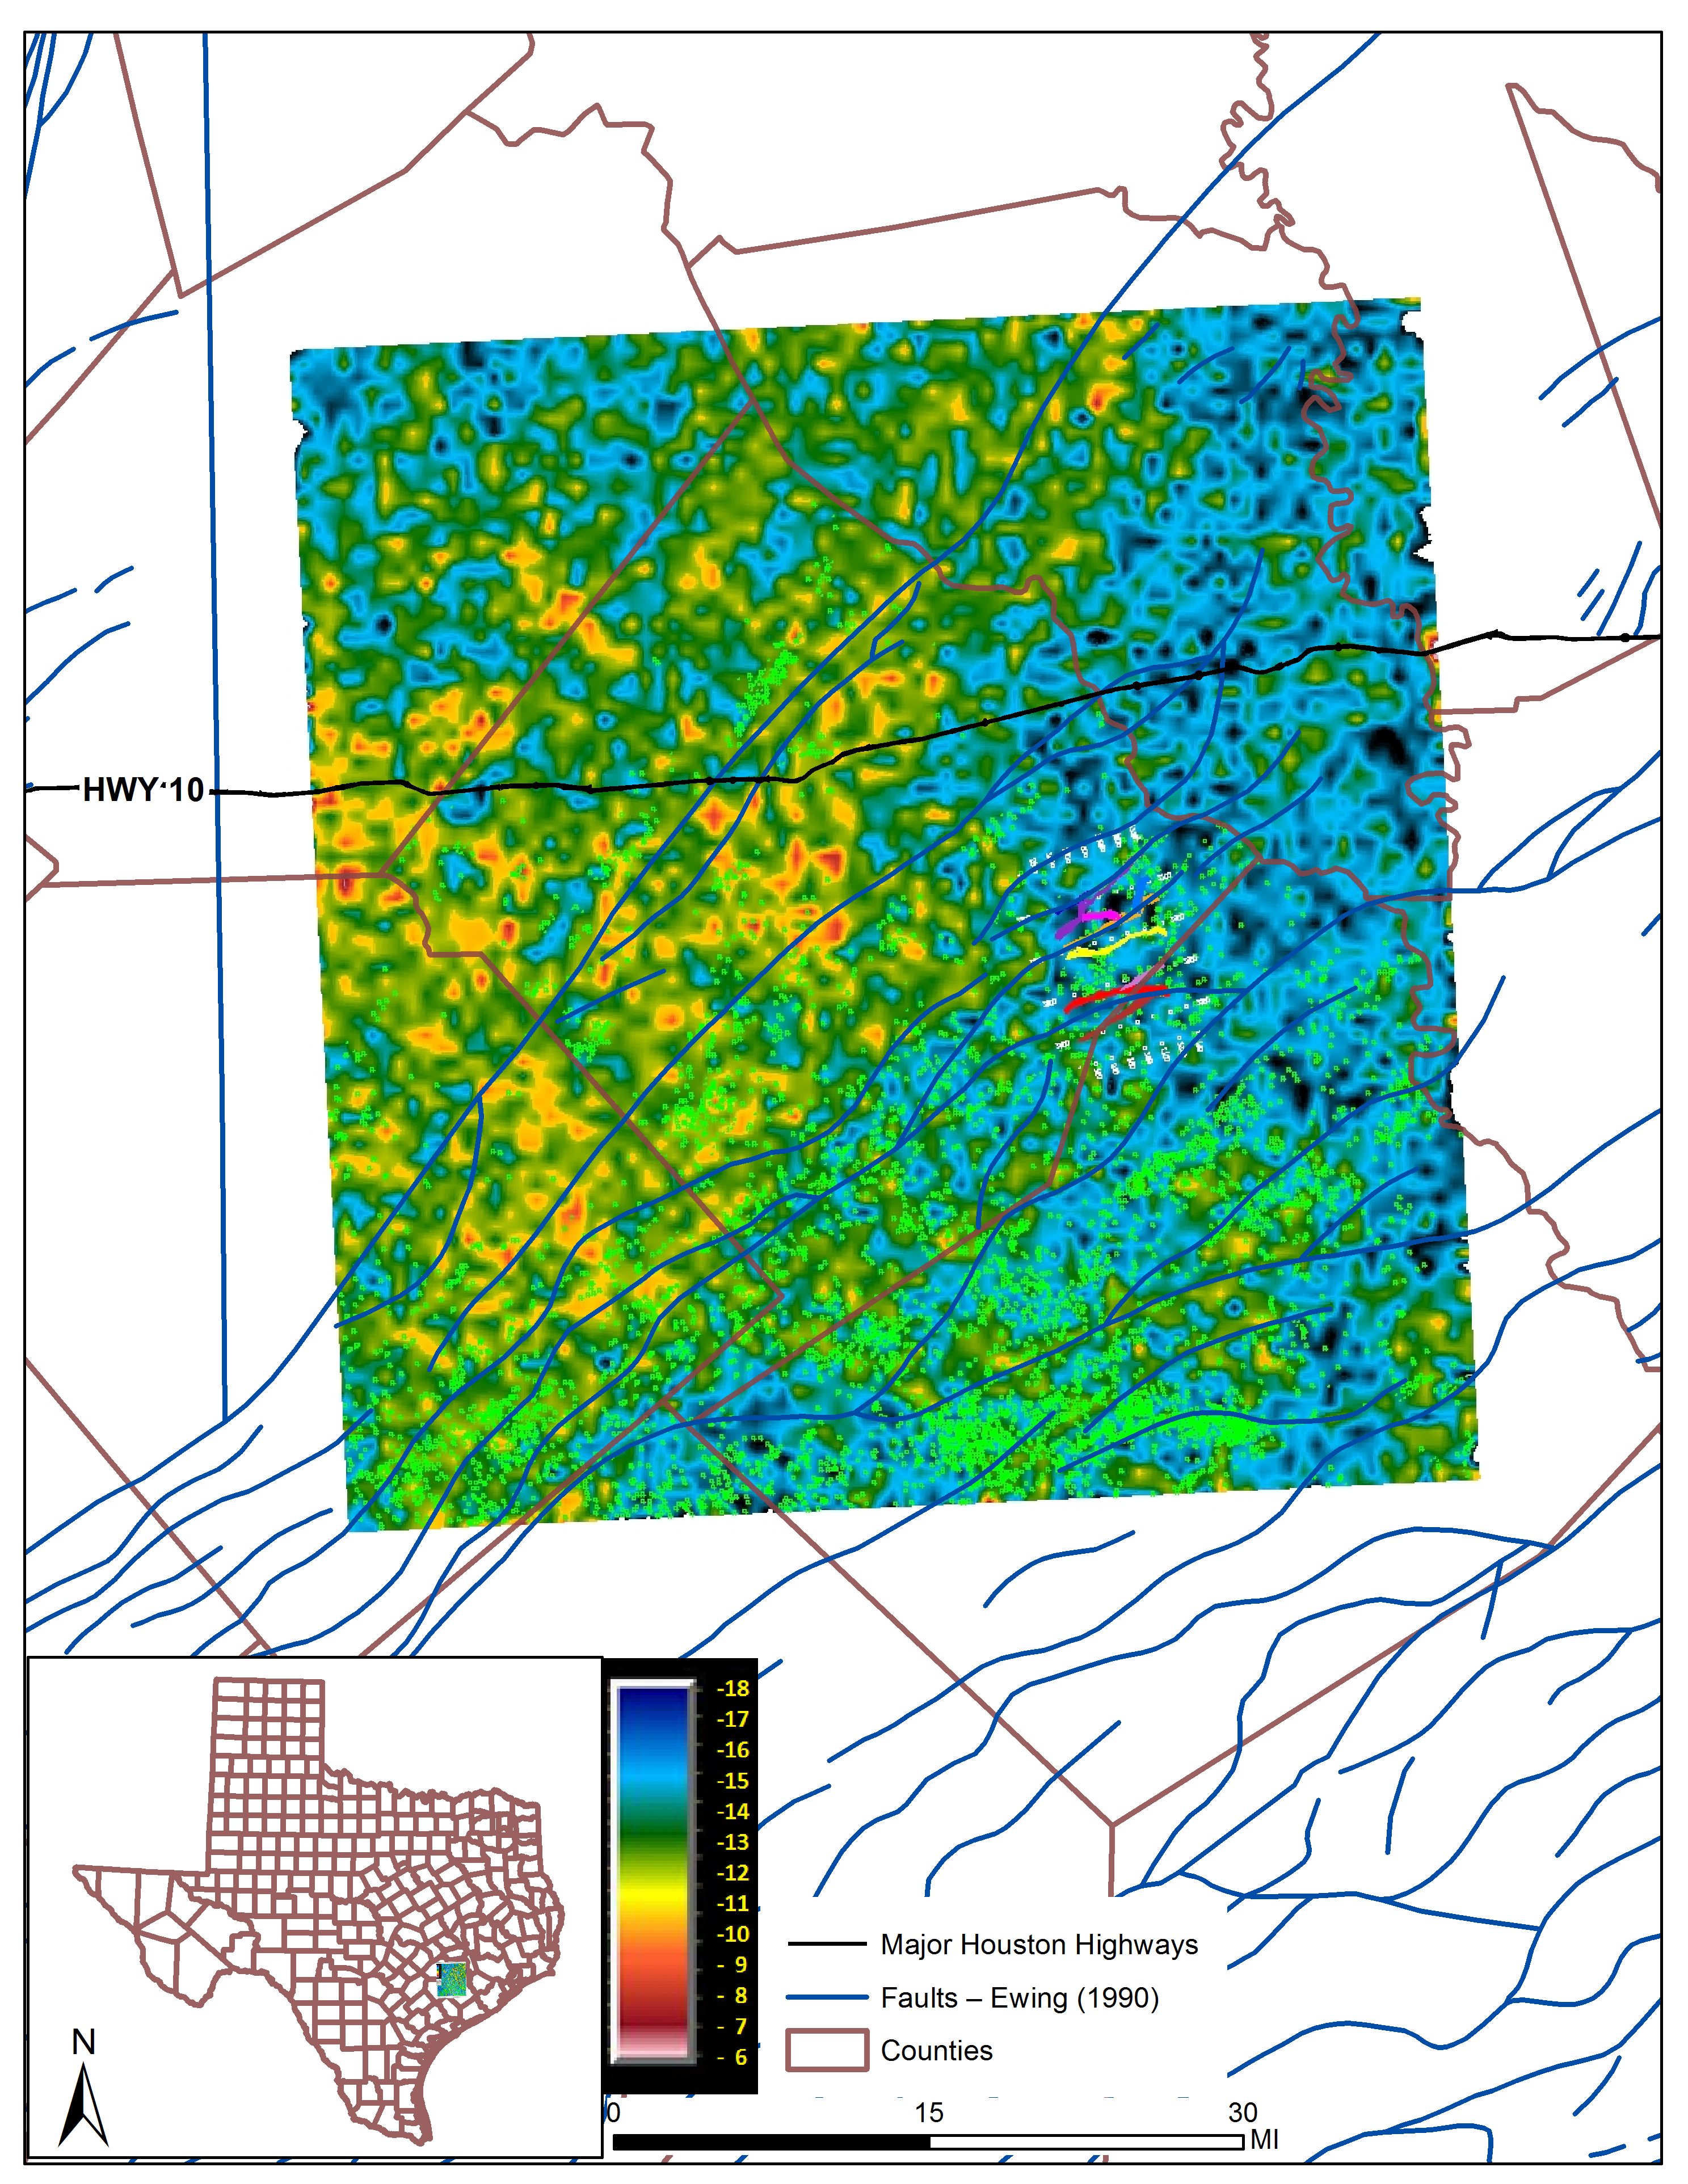
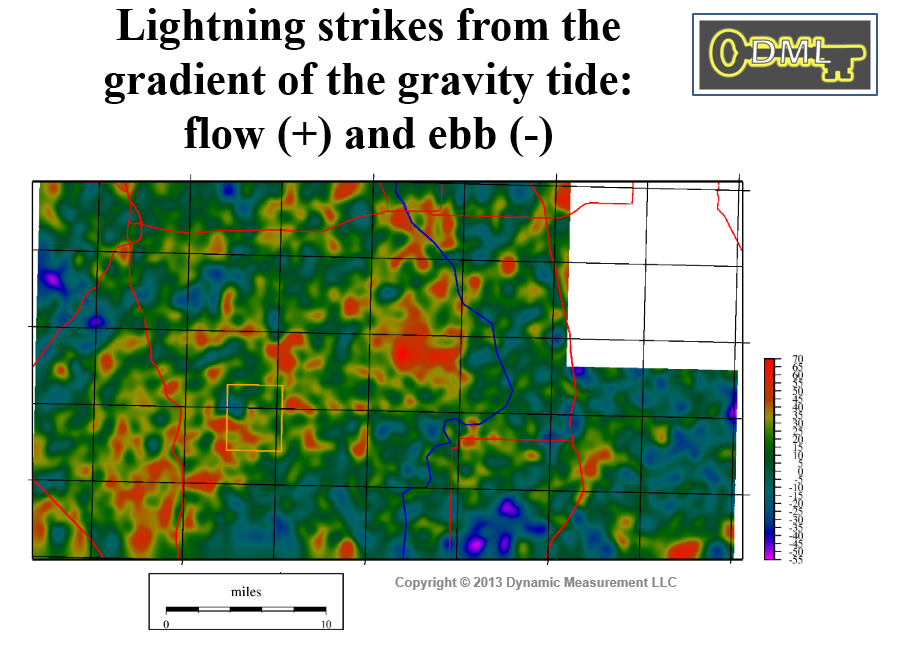
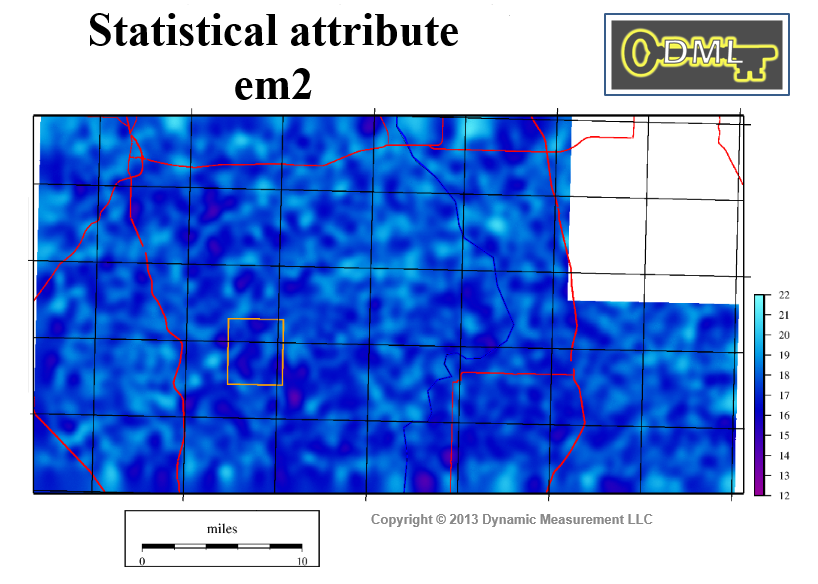
Lightning from Gradient of Tide | EM2 over Project Area |
 |  |
 |  |
 |  |
 |  |
 |  |
| IG-4 Lightning Density Map | .5IG-4 Lightning Density Map |
IG-5 Lightning Density Map | .5IG-5 Lightning Density Map |
IG-6 Lightning Density Map | IG-6 Density 6-sigma 3km Filter |
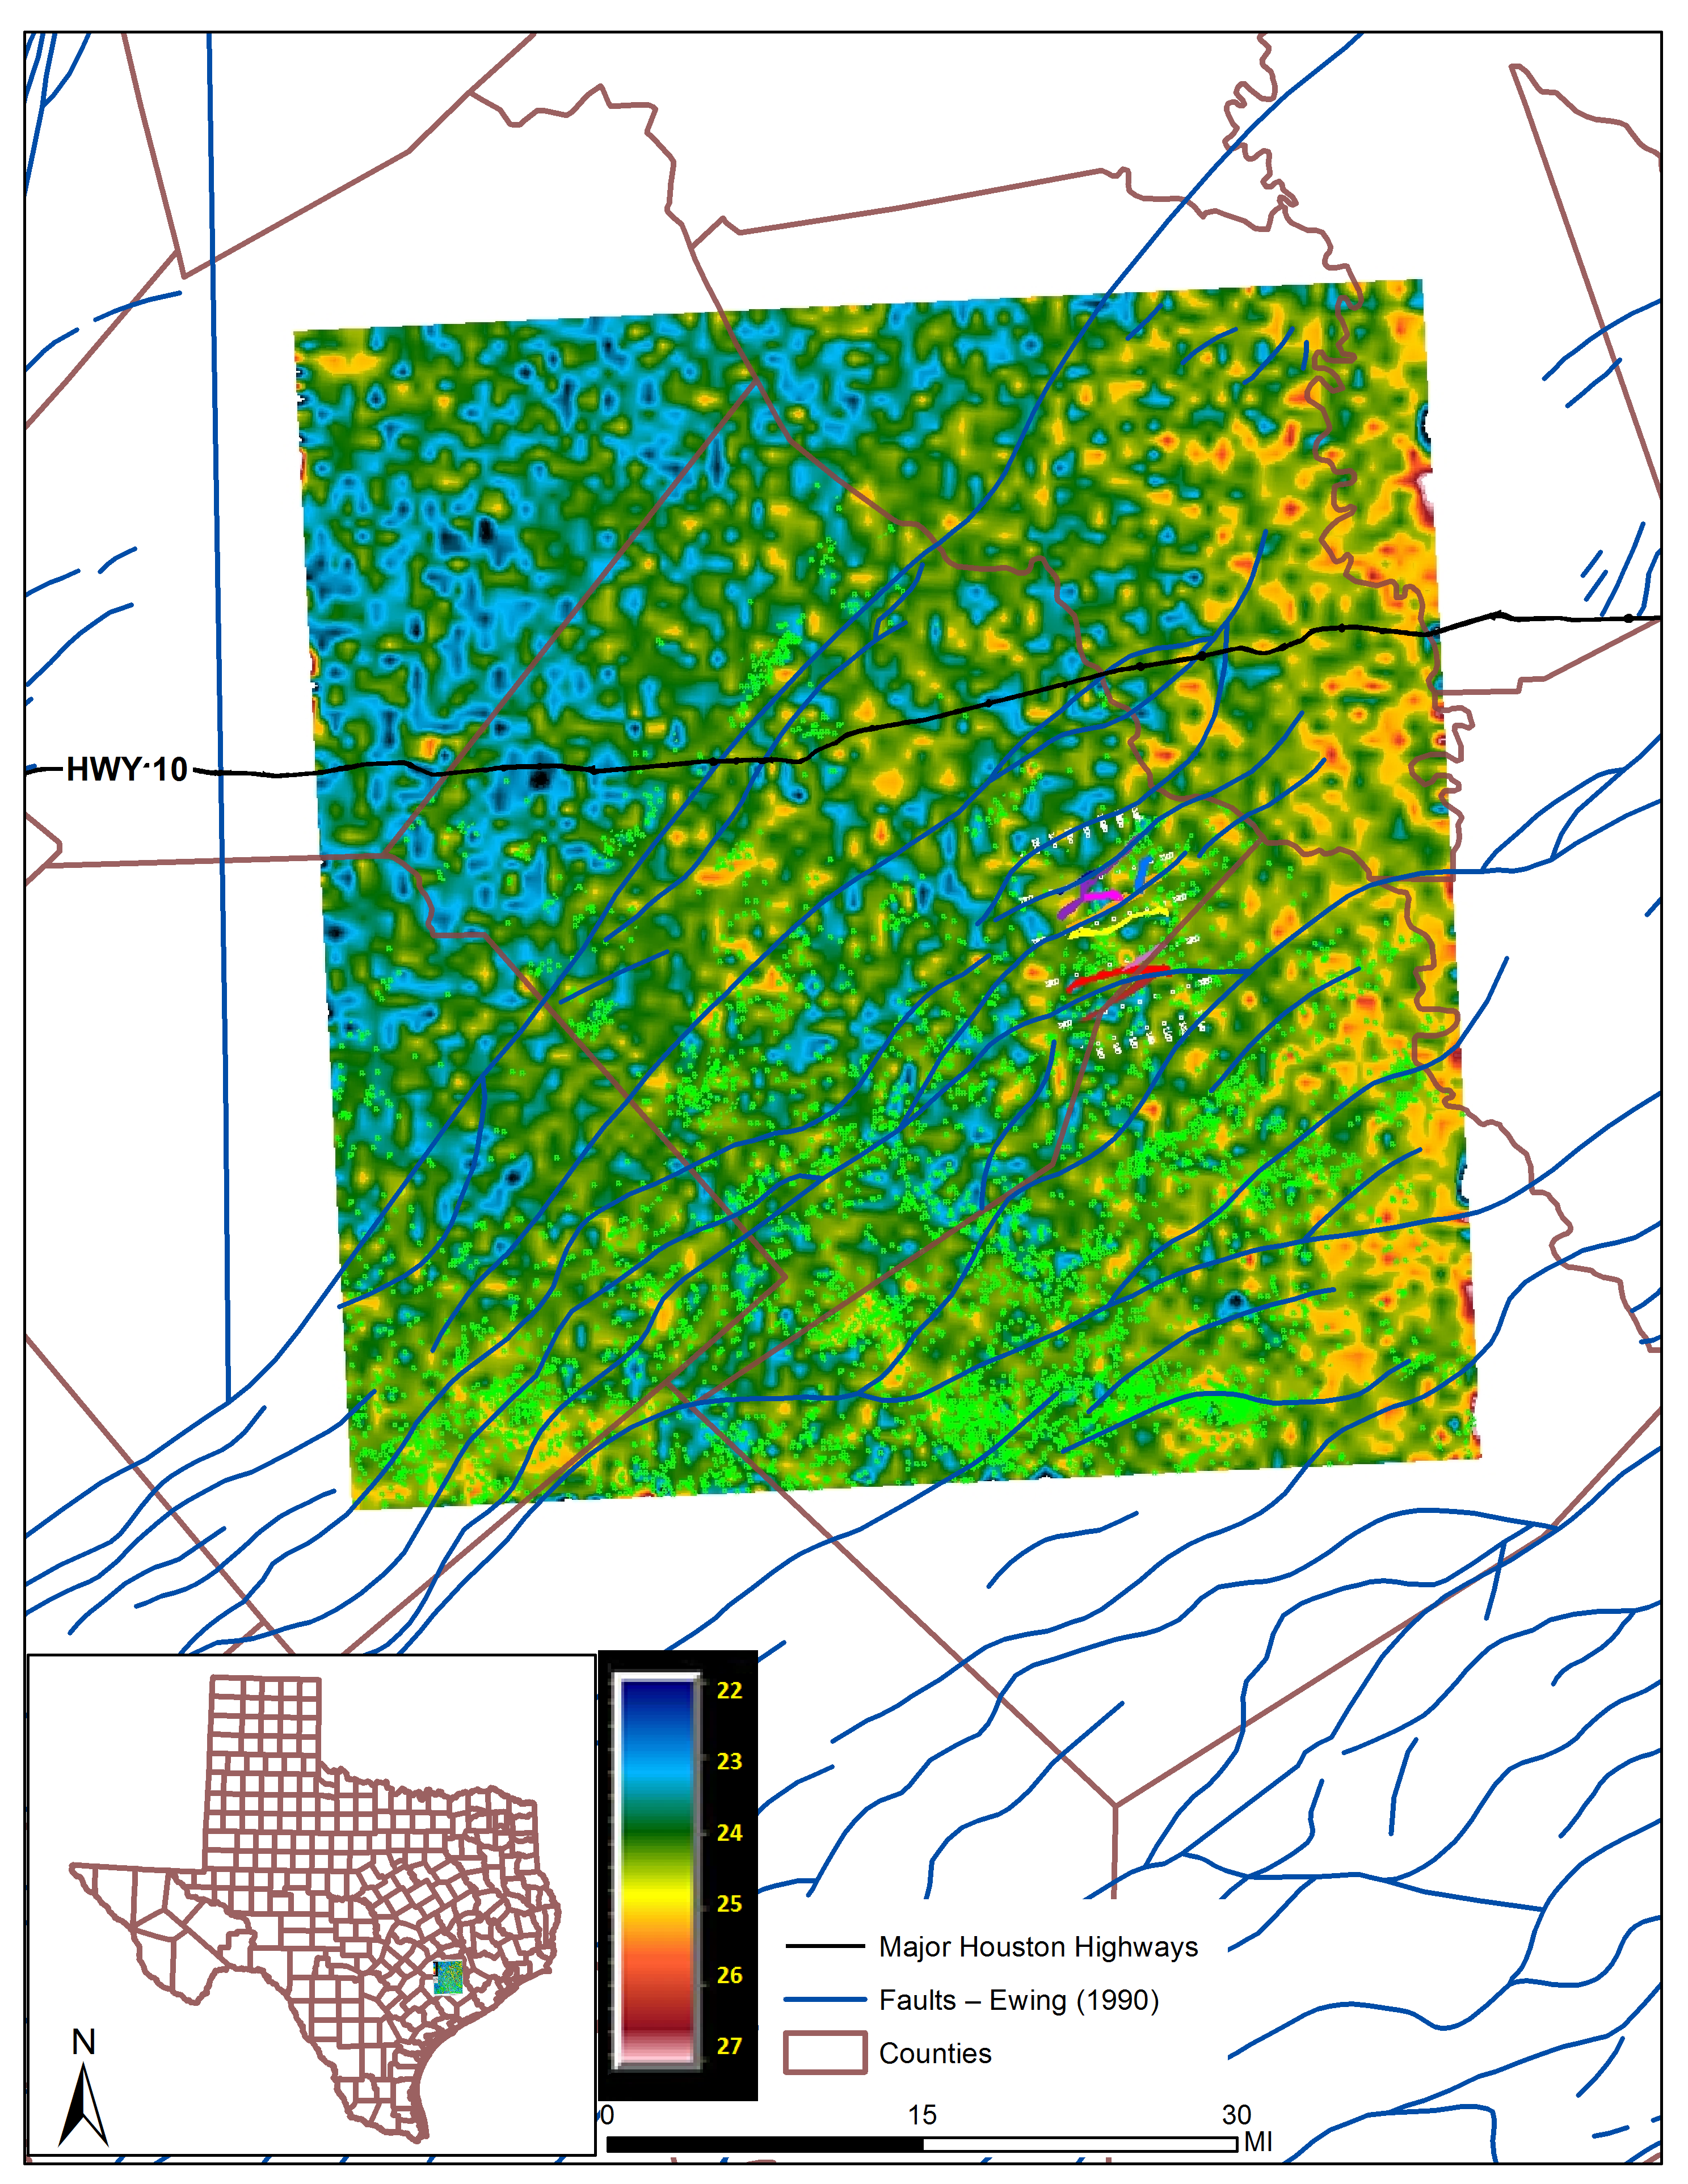
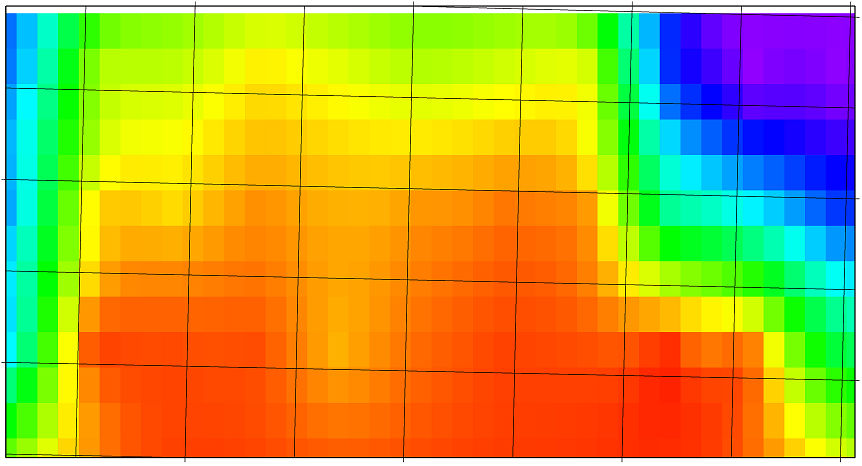
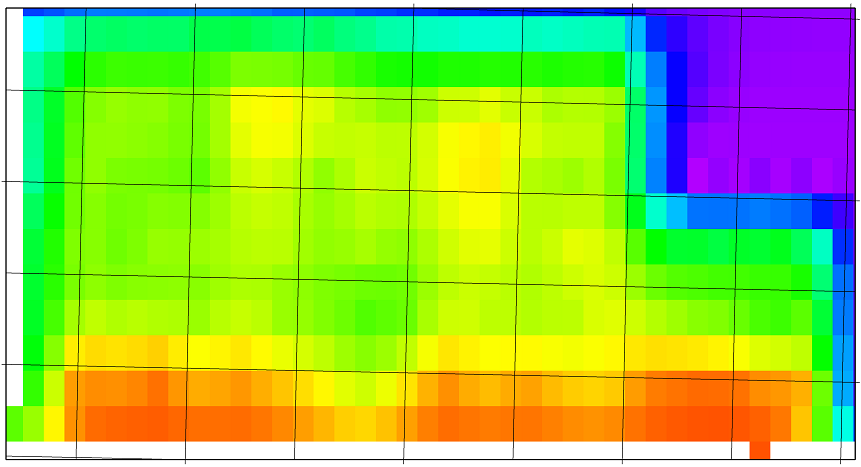
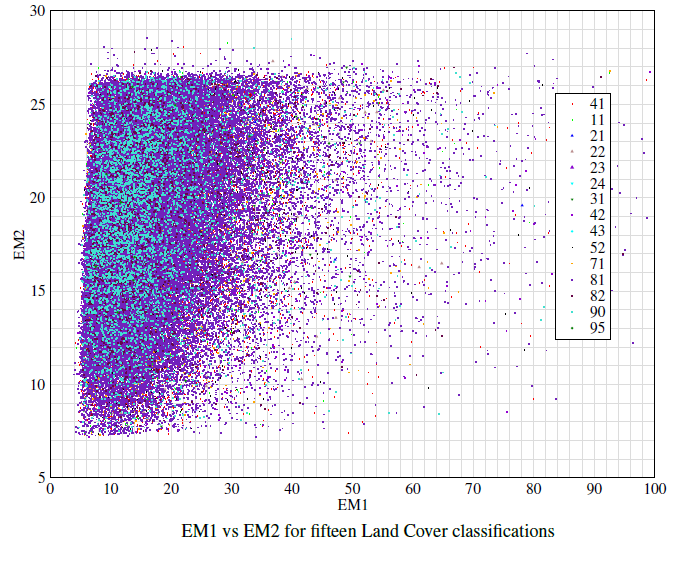
Map to left with Chi2 < 1.0 | EM1 vs EM2 15 Land Covers |
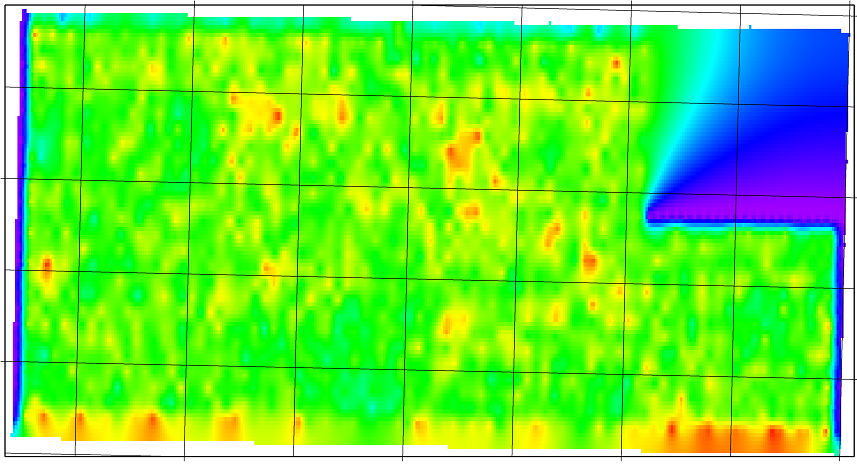
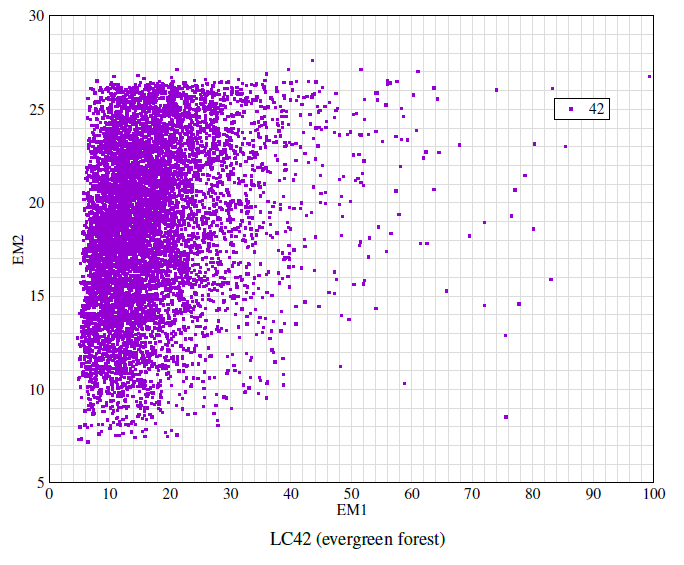
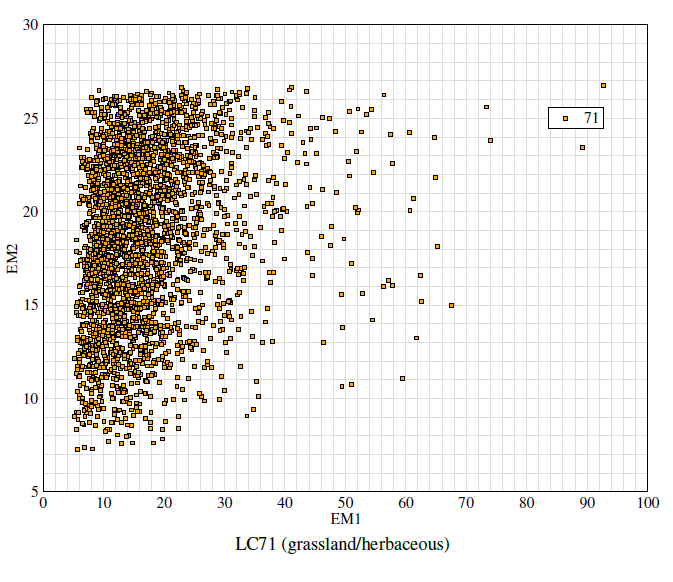
EM1 vs EM2 15 Evergreen Forest | EM1 vs EM2 15 Grassland |