 |  |
 |  |
 |  |
 |  |
 |  |
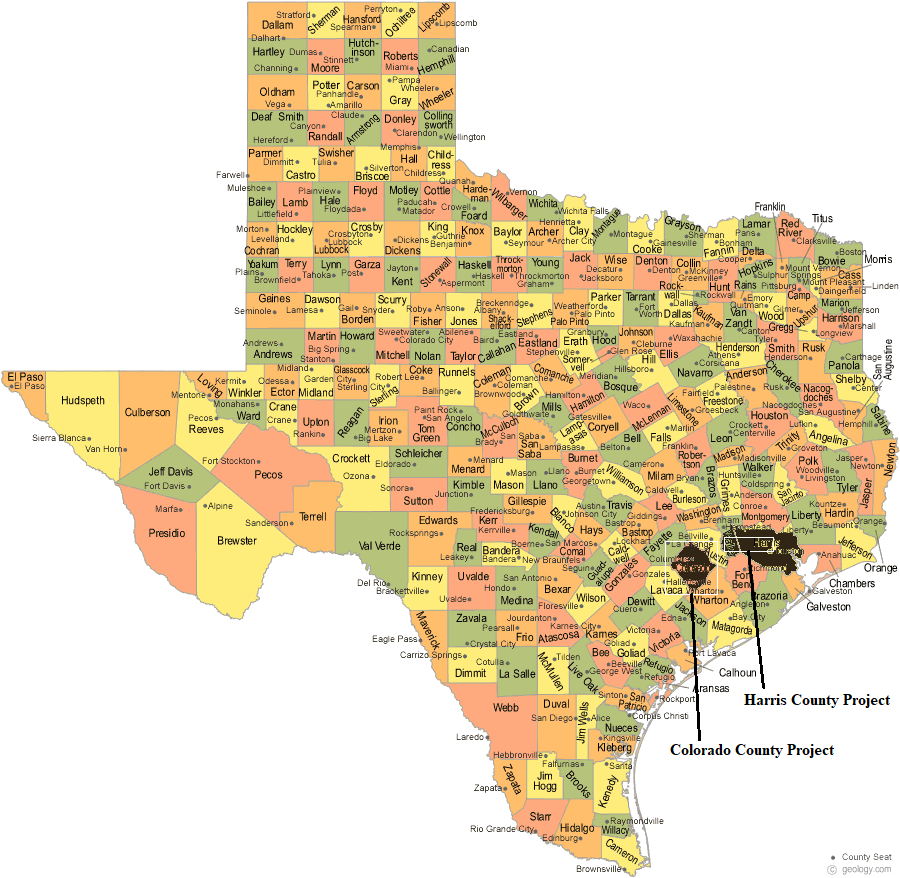
| Colorado County Houston County Locations | Summary of Geopressure Opportunity |
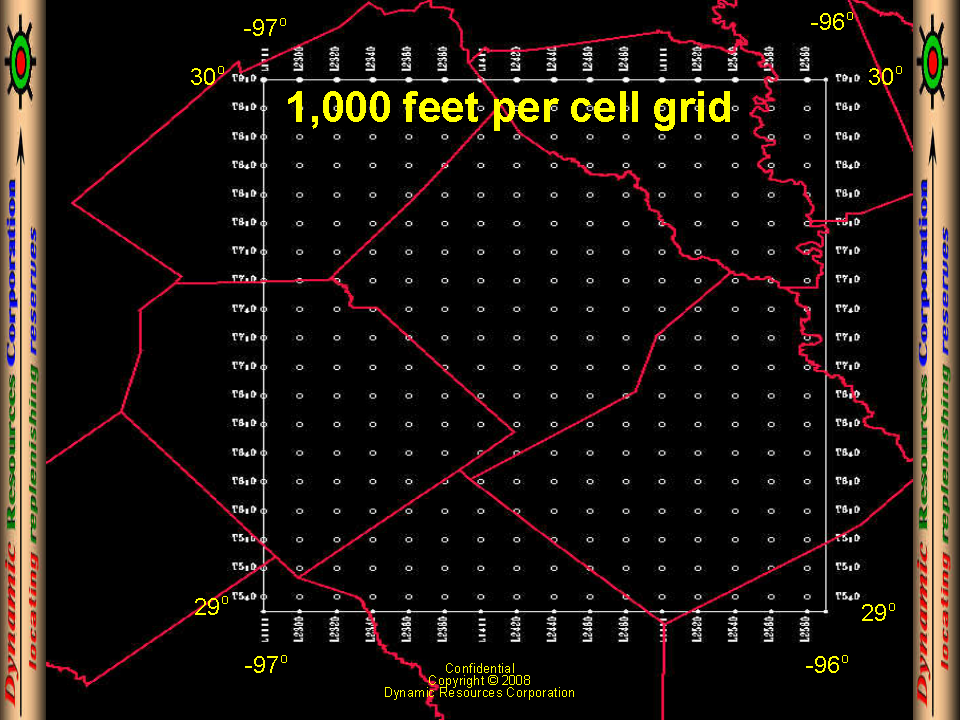
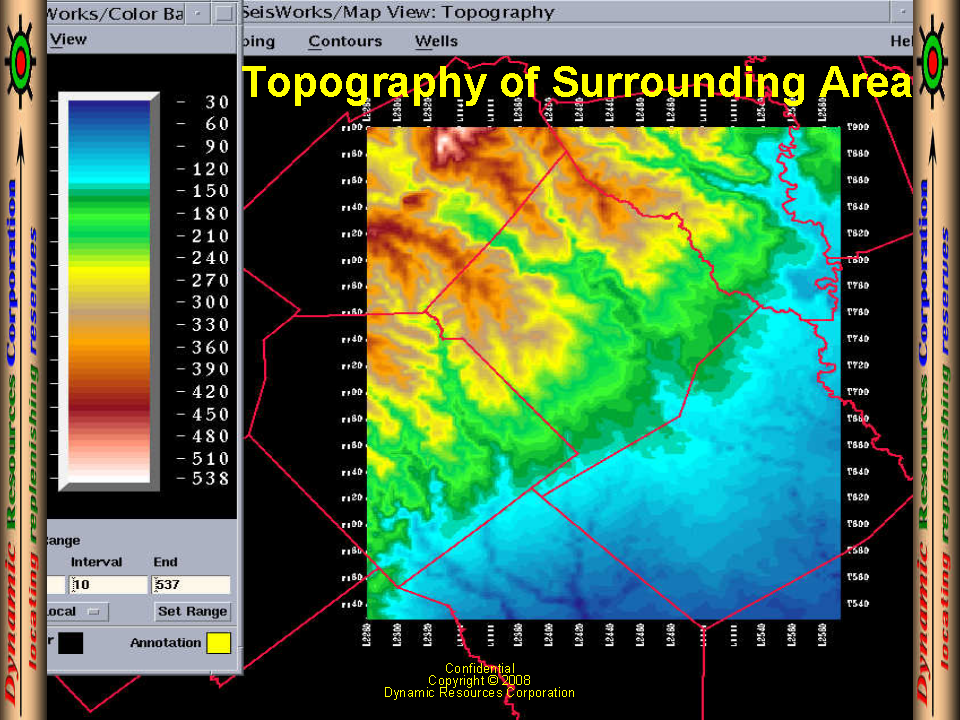
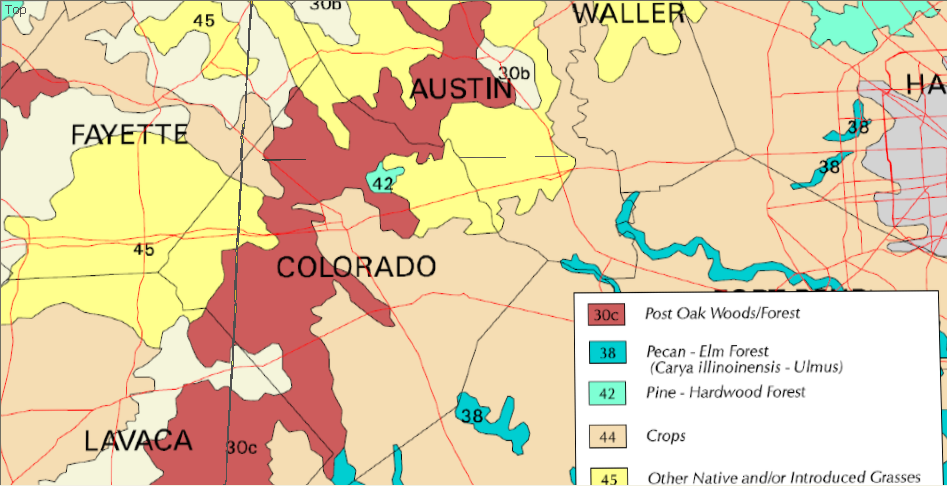
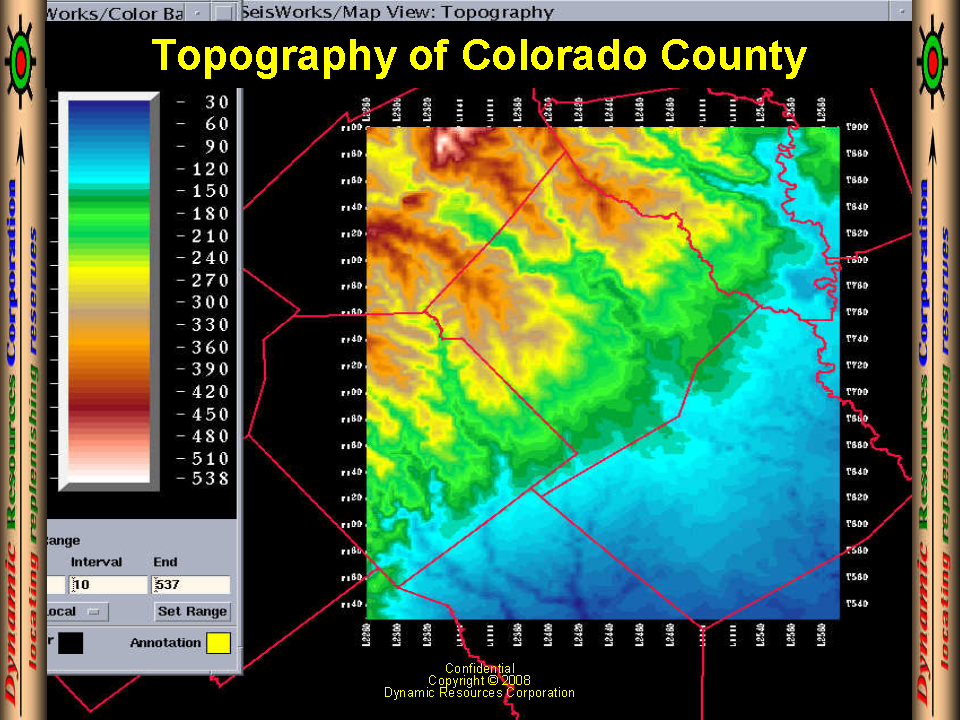
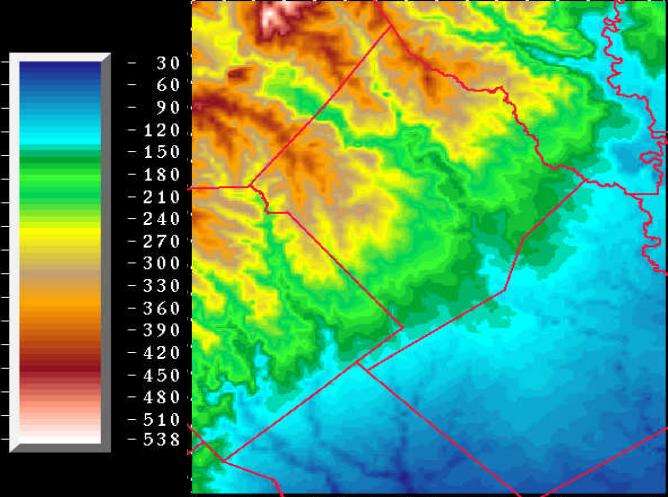
1,000 feet per grid cell across Colorado County | Topography of Area Surrounding Colorado County |
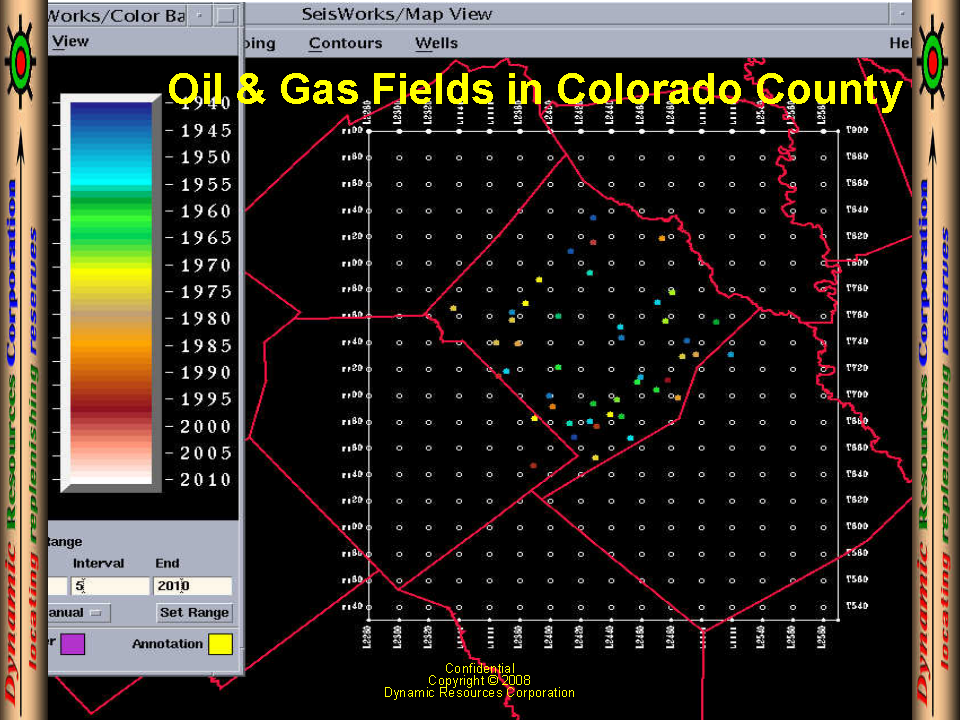
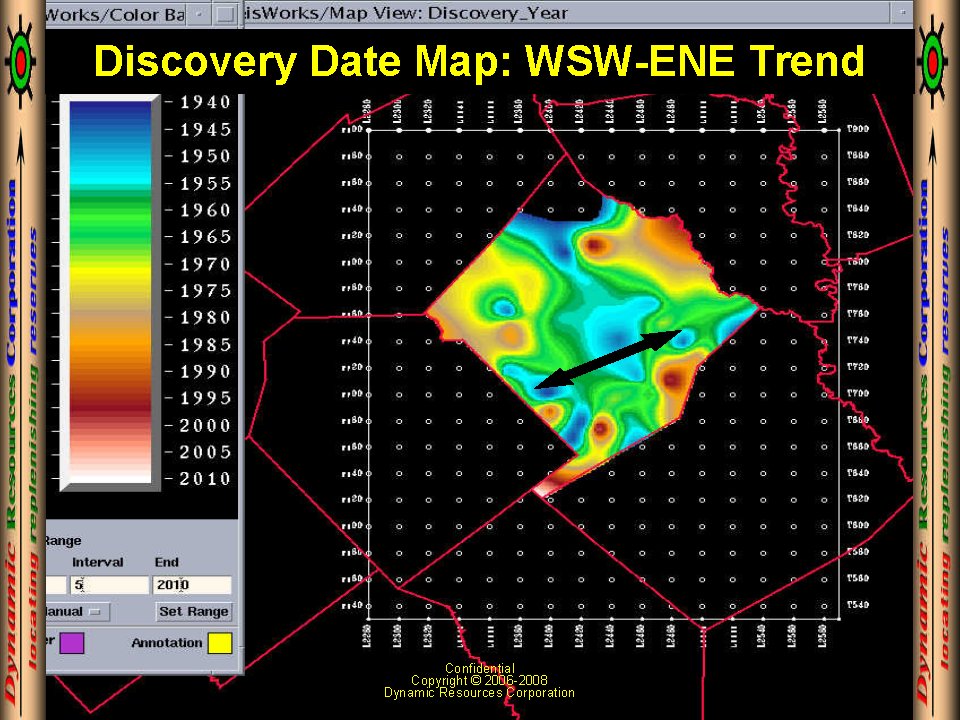
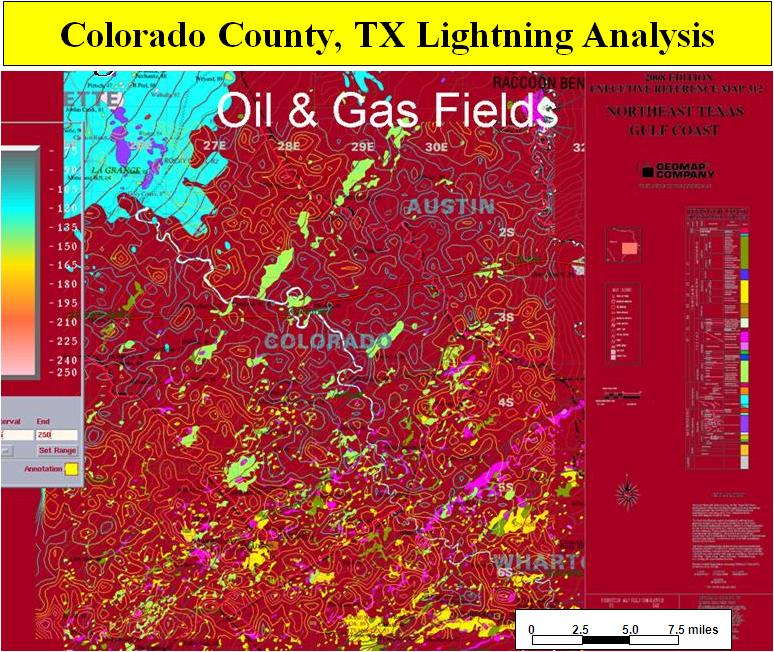
Oil & Gas Fields in Colorado County | Discovery Date Map with TRend WSW-ENE |
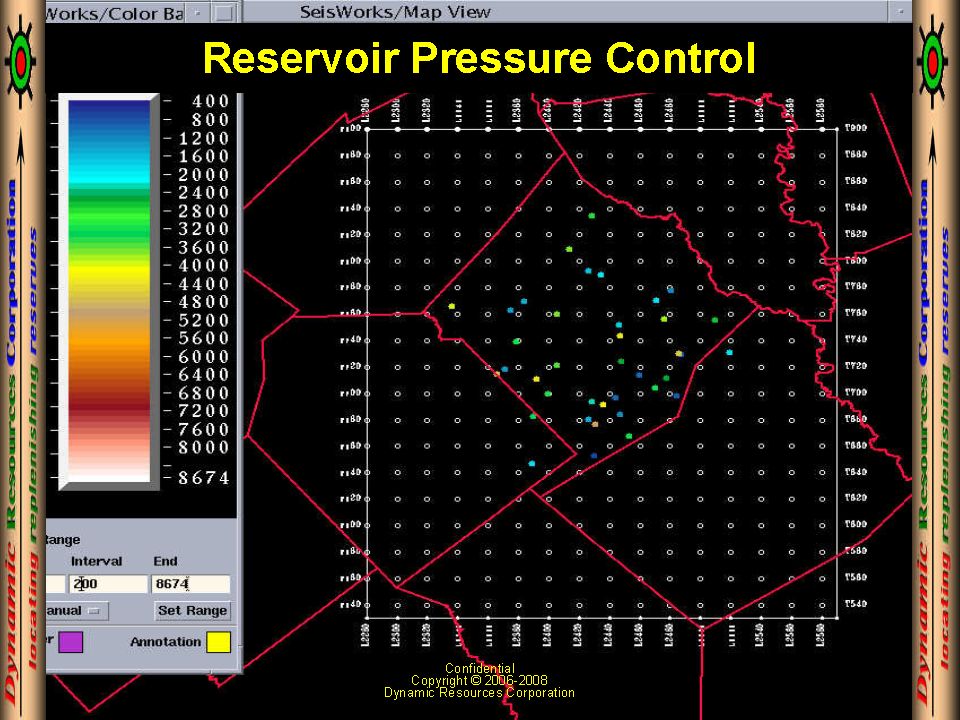
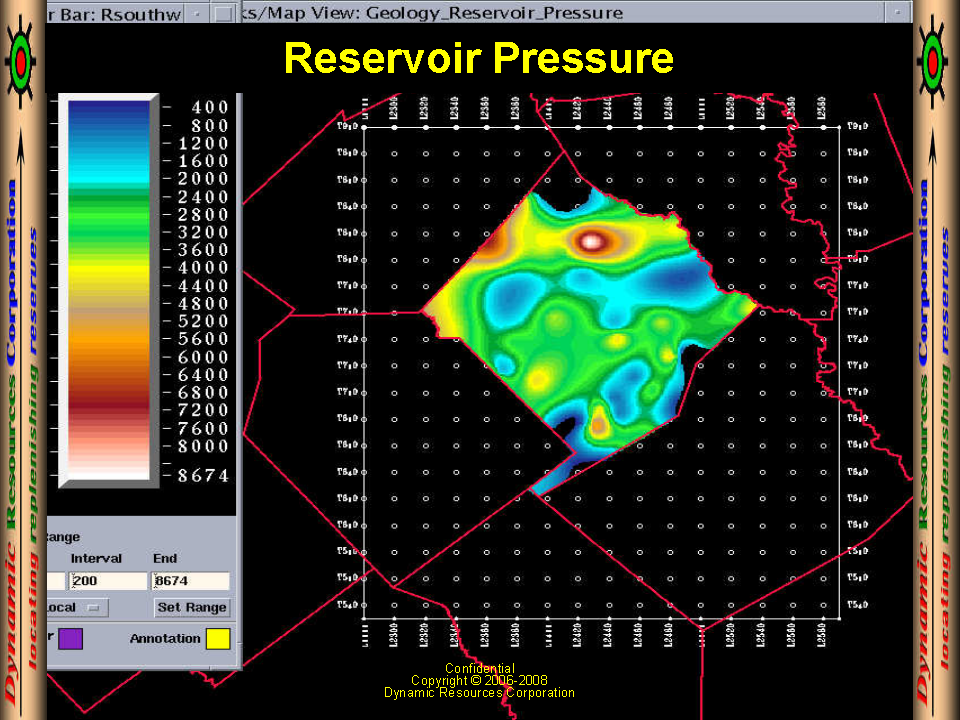
Reservoir Pressure in Colorado County | Reservoir Pressure Map Colorado County |
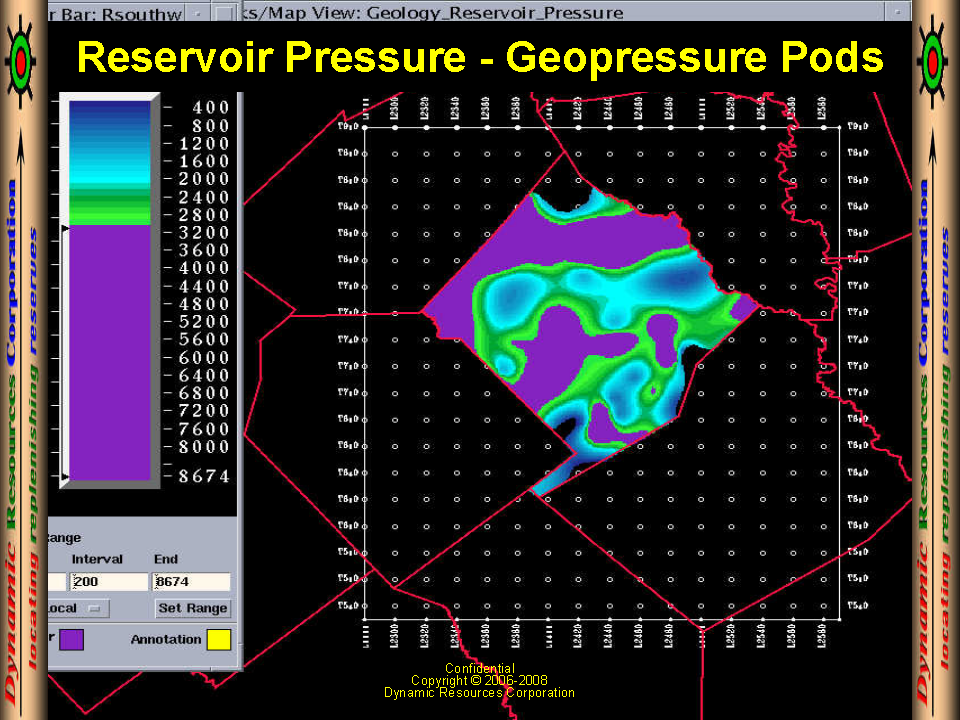
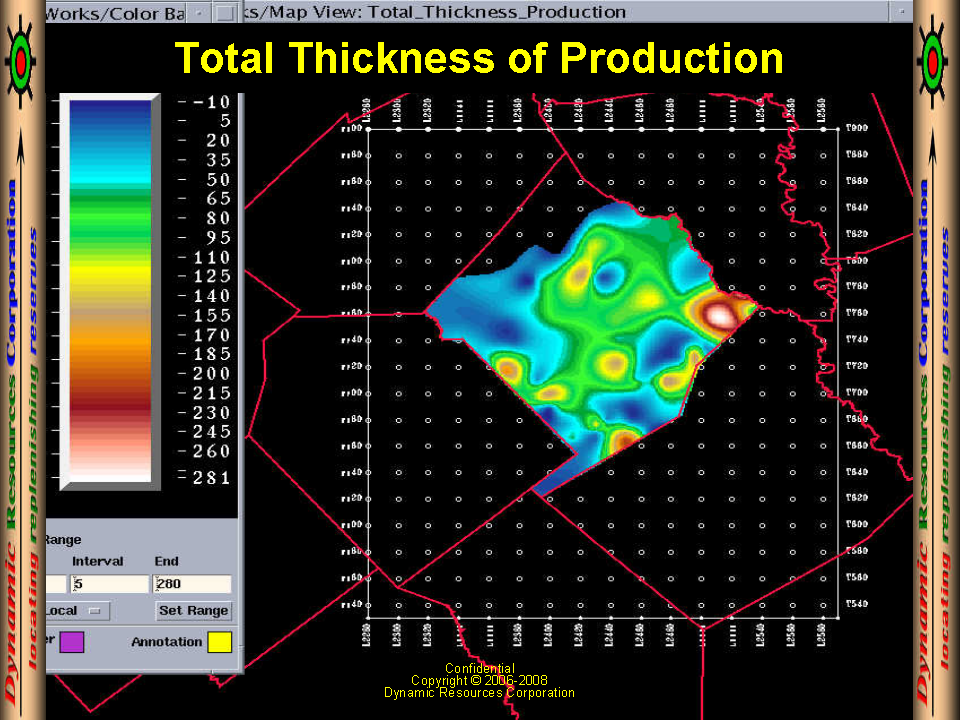
Geopressure Pods from Reservoir Pressure | Total Thickness of Production in County |
 |  |
 |  |
 |  |
 |  |
 |  |
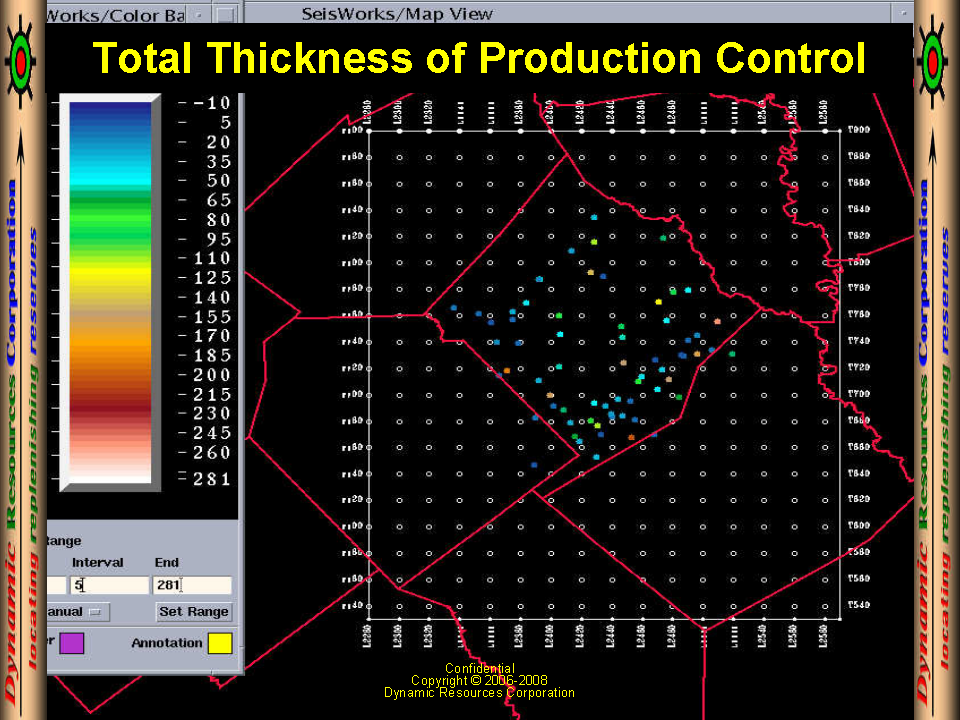
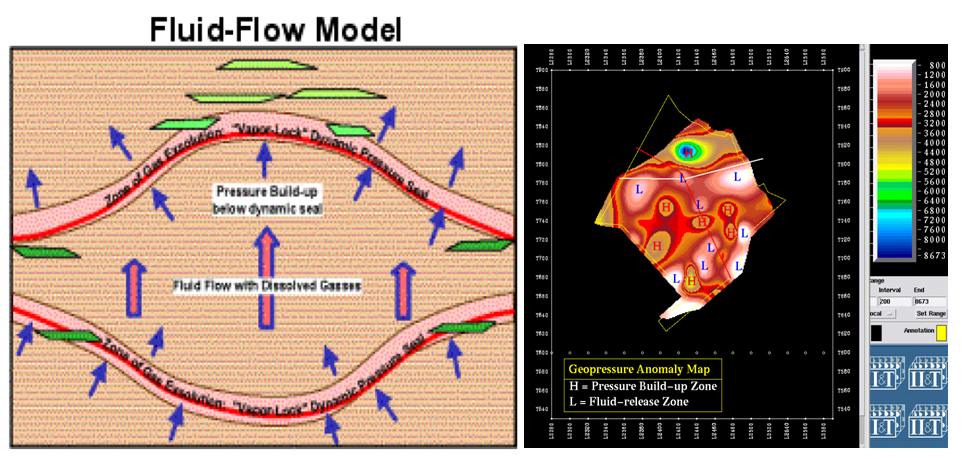
| Total Thickness of Production Gridded | Geopressure Anomaly Map Colorado County |
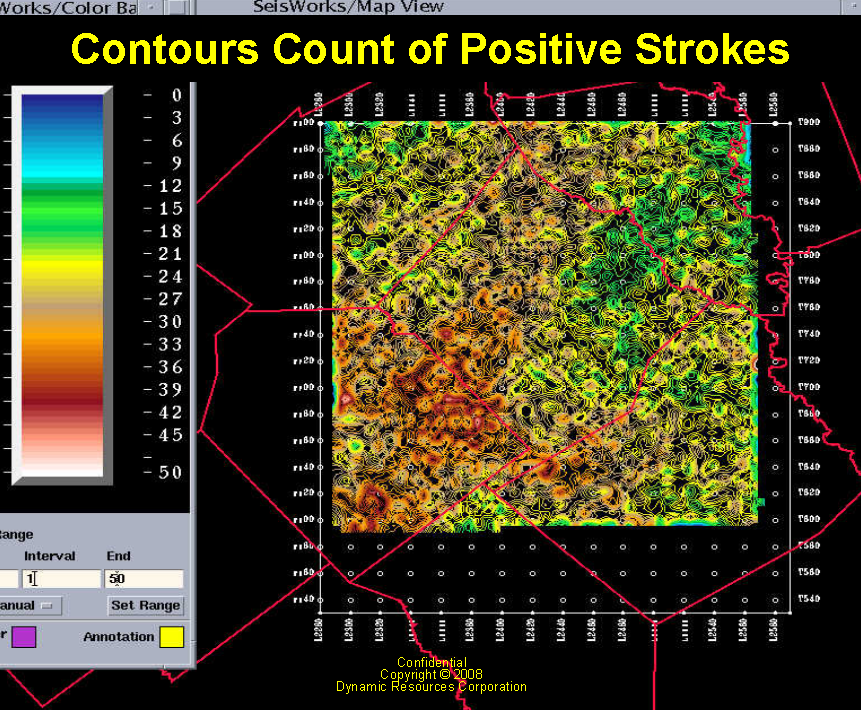
Fluid Flow Model behind Geopressure Pods | Contoured Number of Positive Strokes |
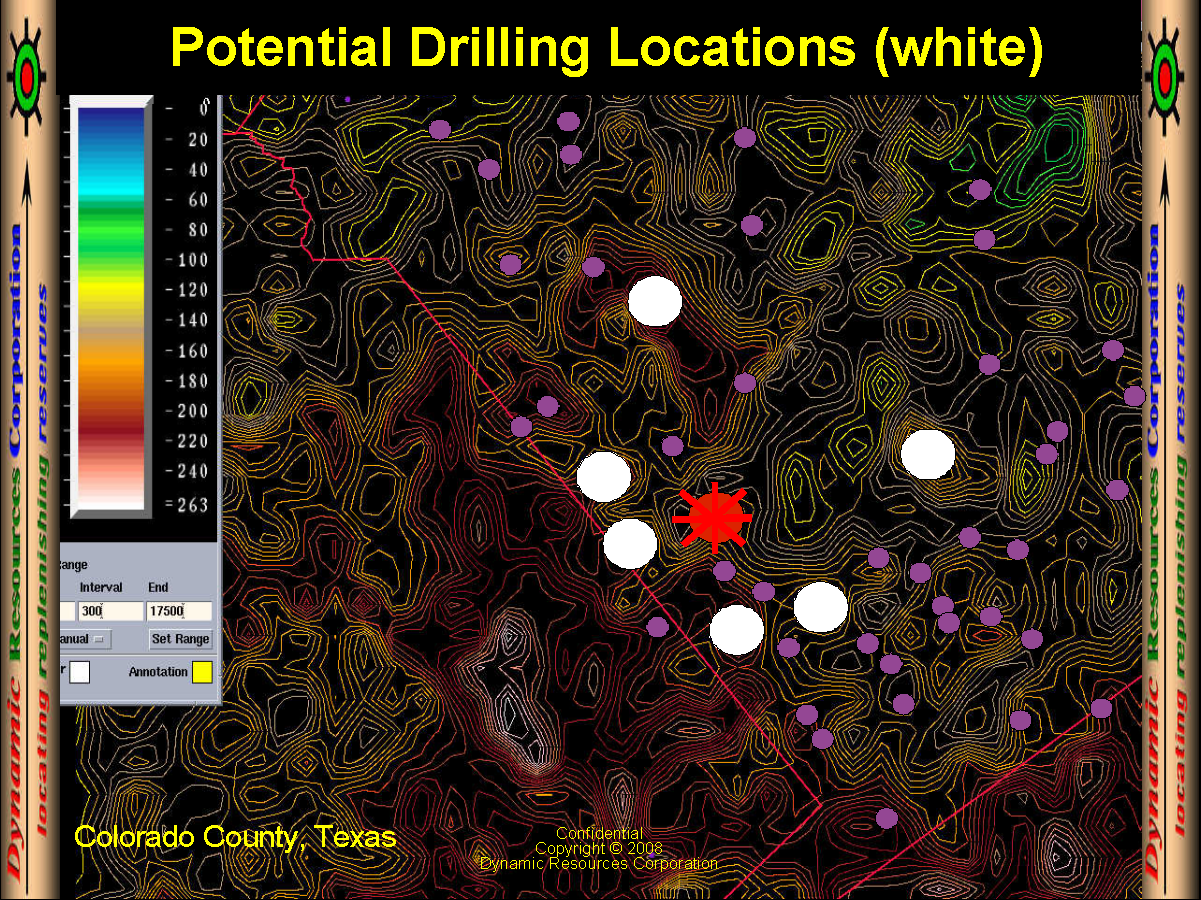
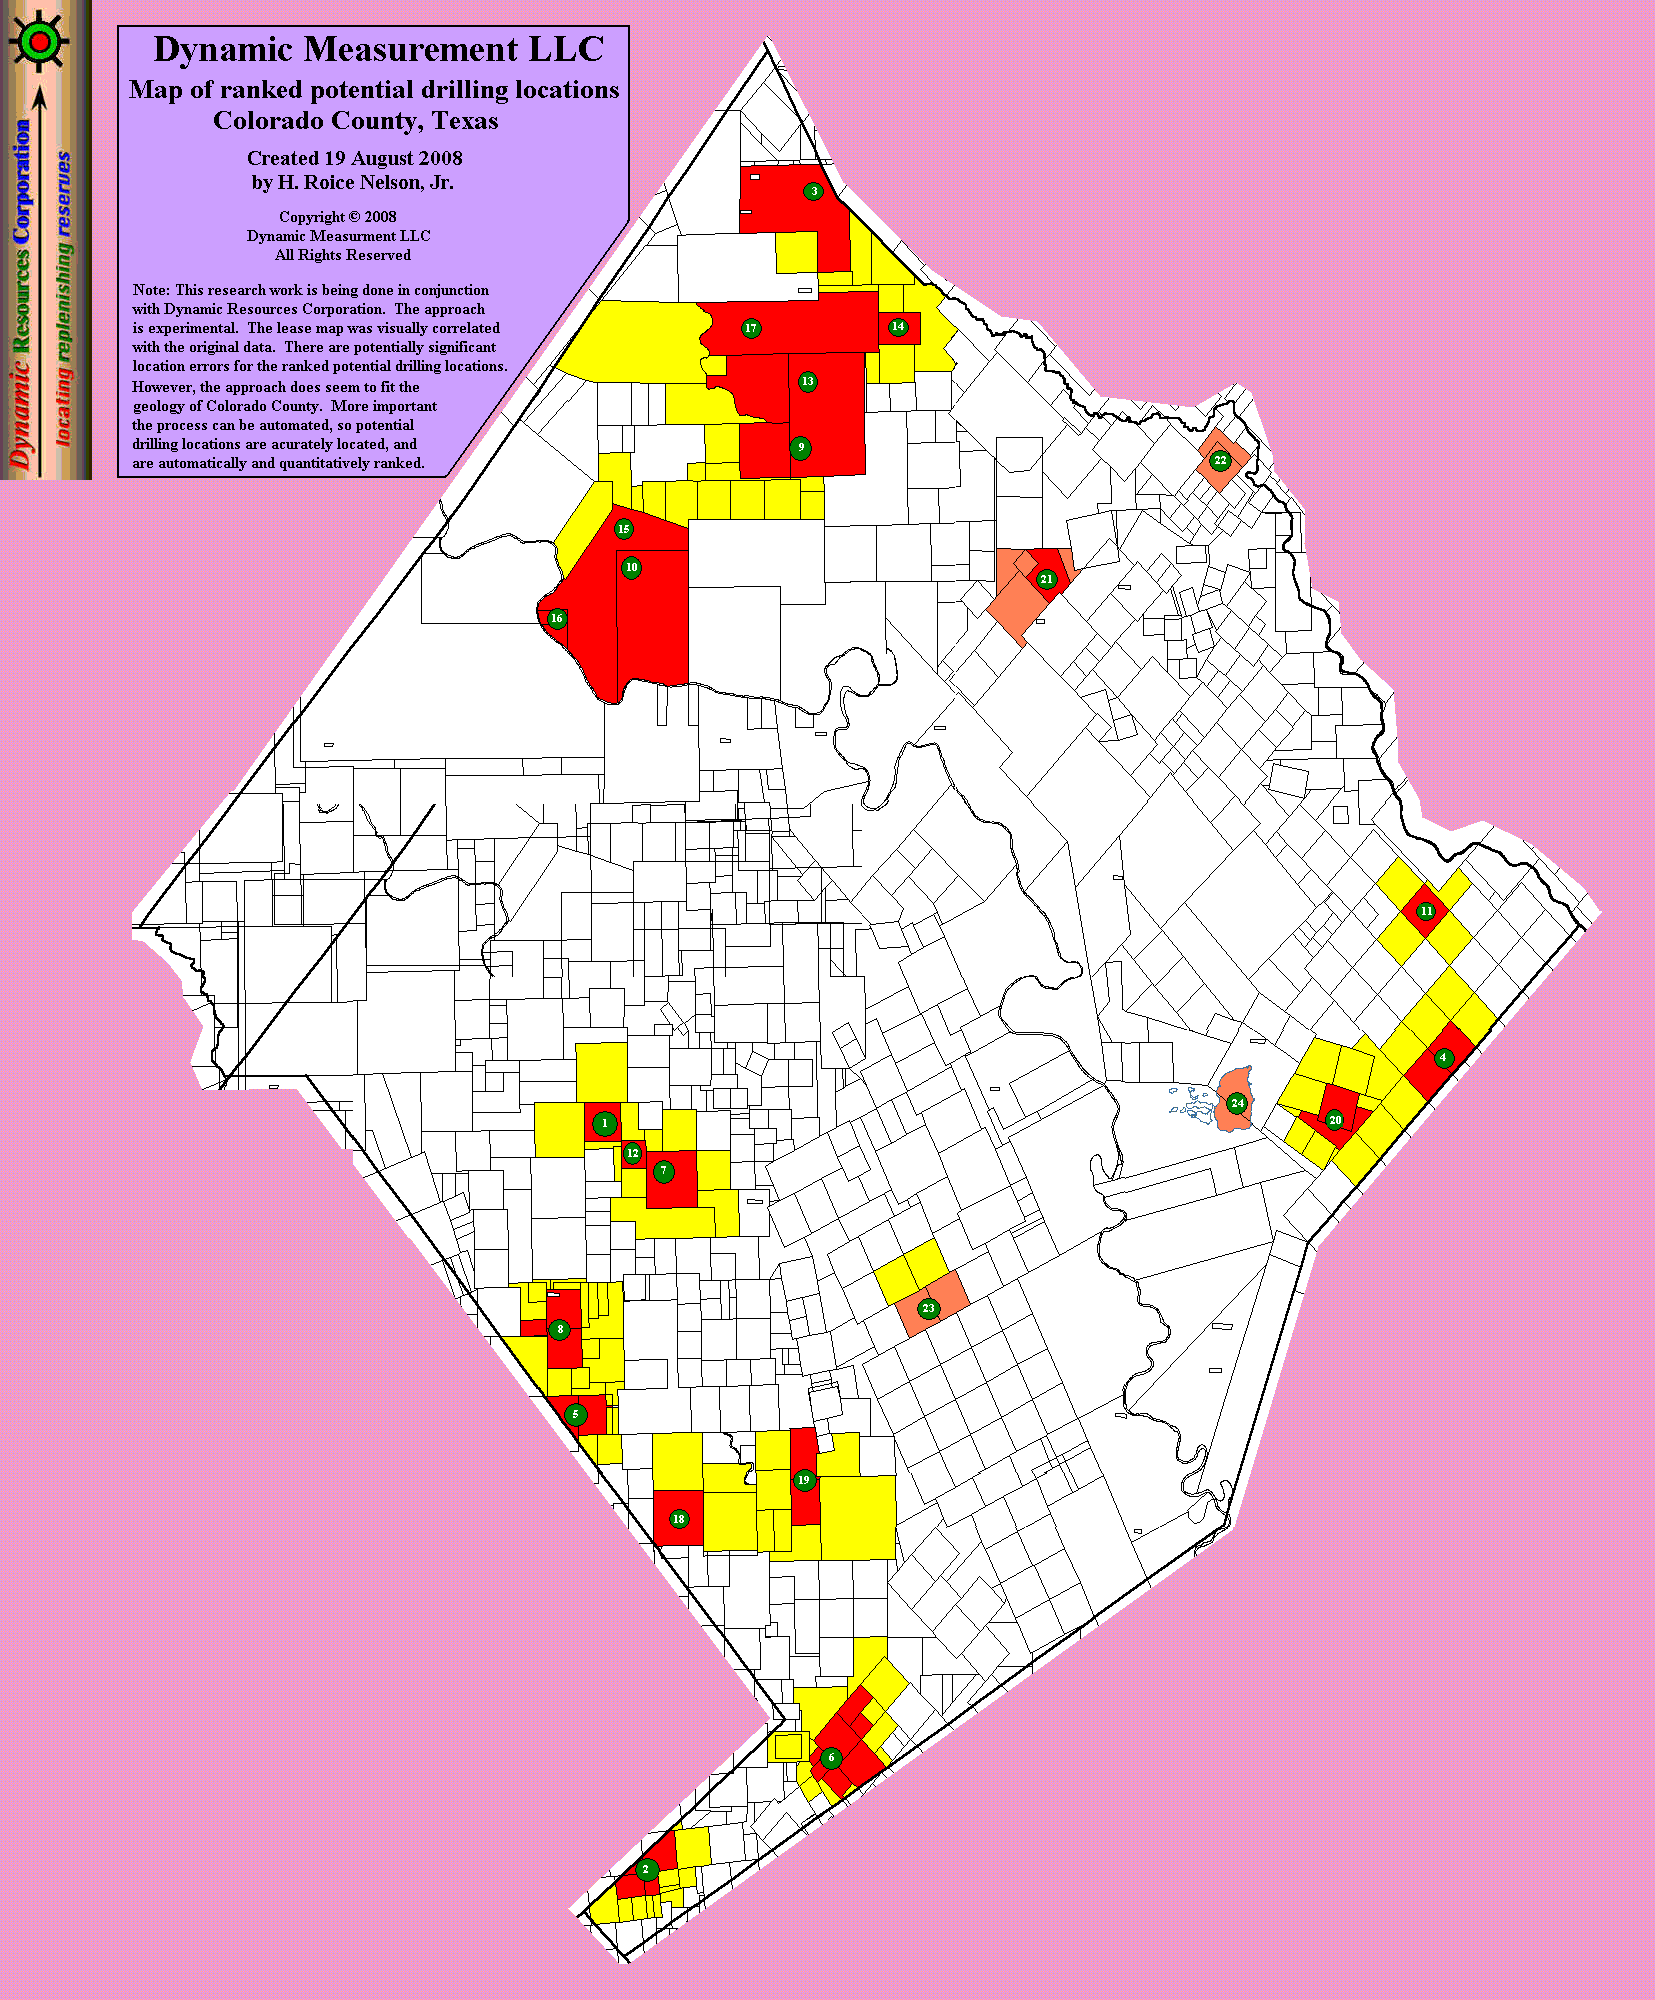
Potential Drilling Locations from Positive Strokes | Positive Stroke Contours over Oil & Gas Fields |
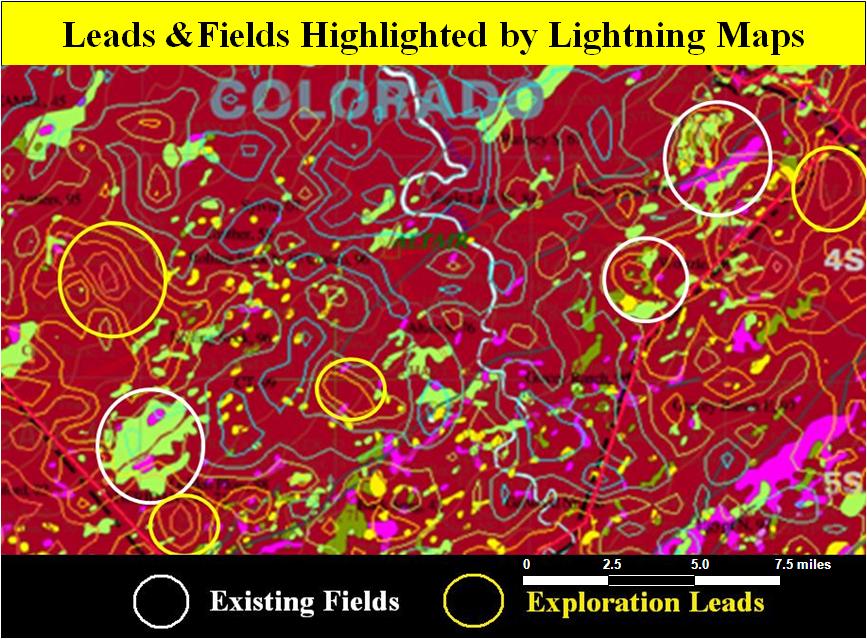
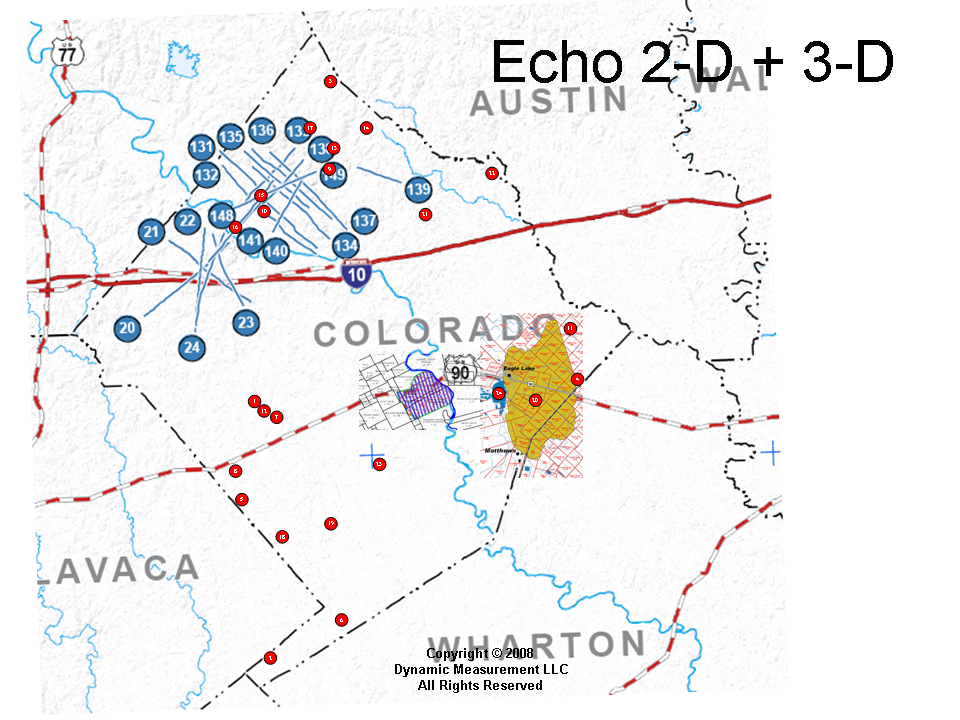
Exploration Leads Highlighted by Lightning Maps | Echo 2D & 3D Spec Seismic 2008 |
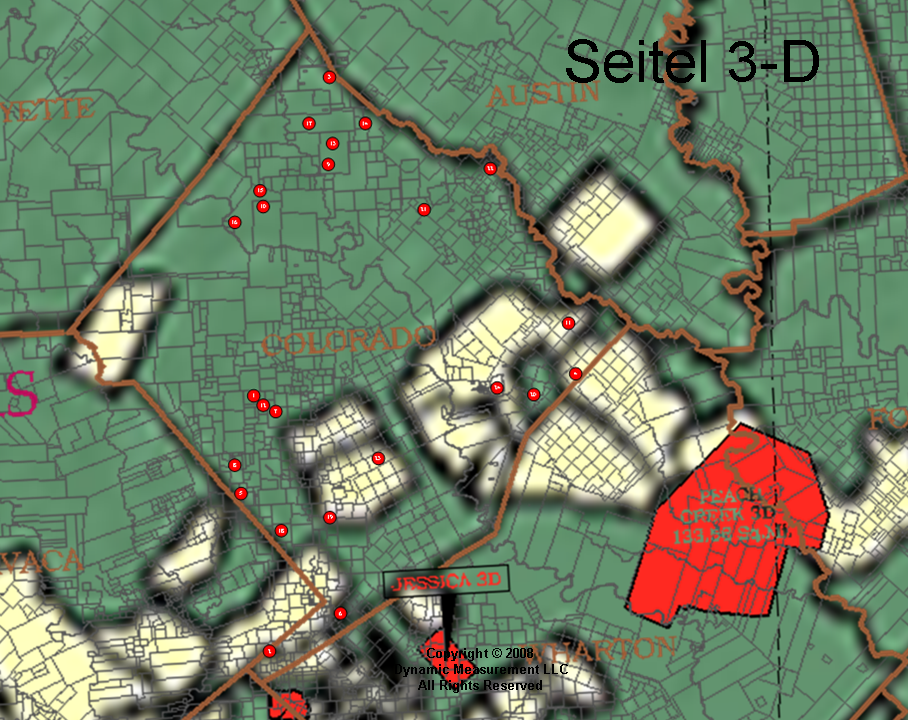
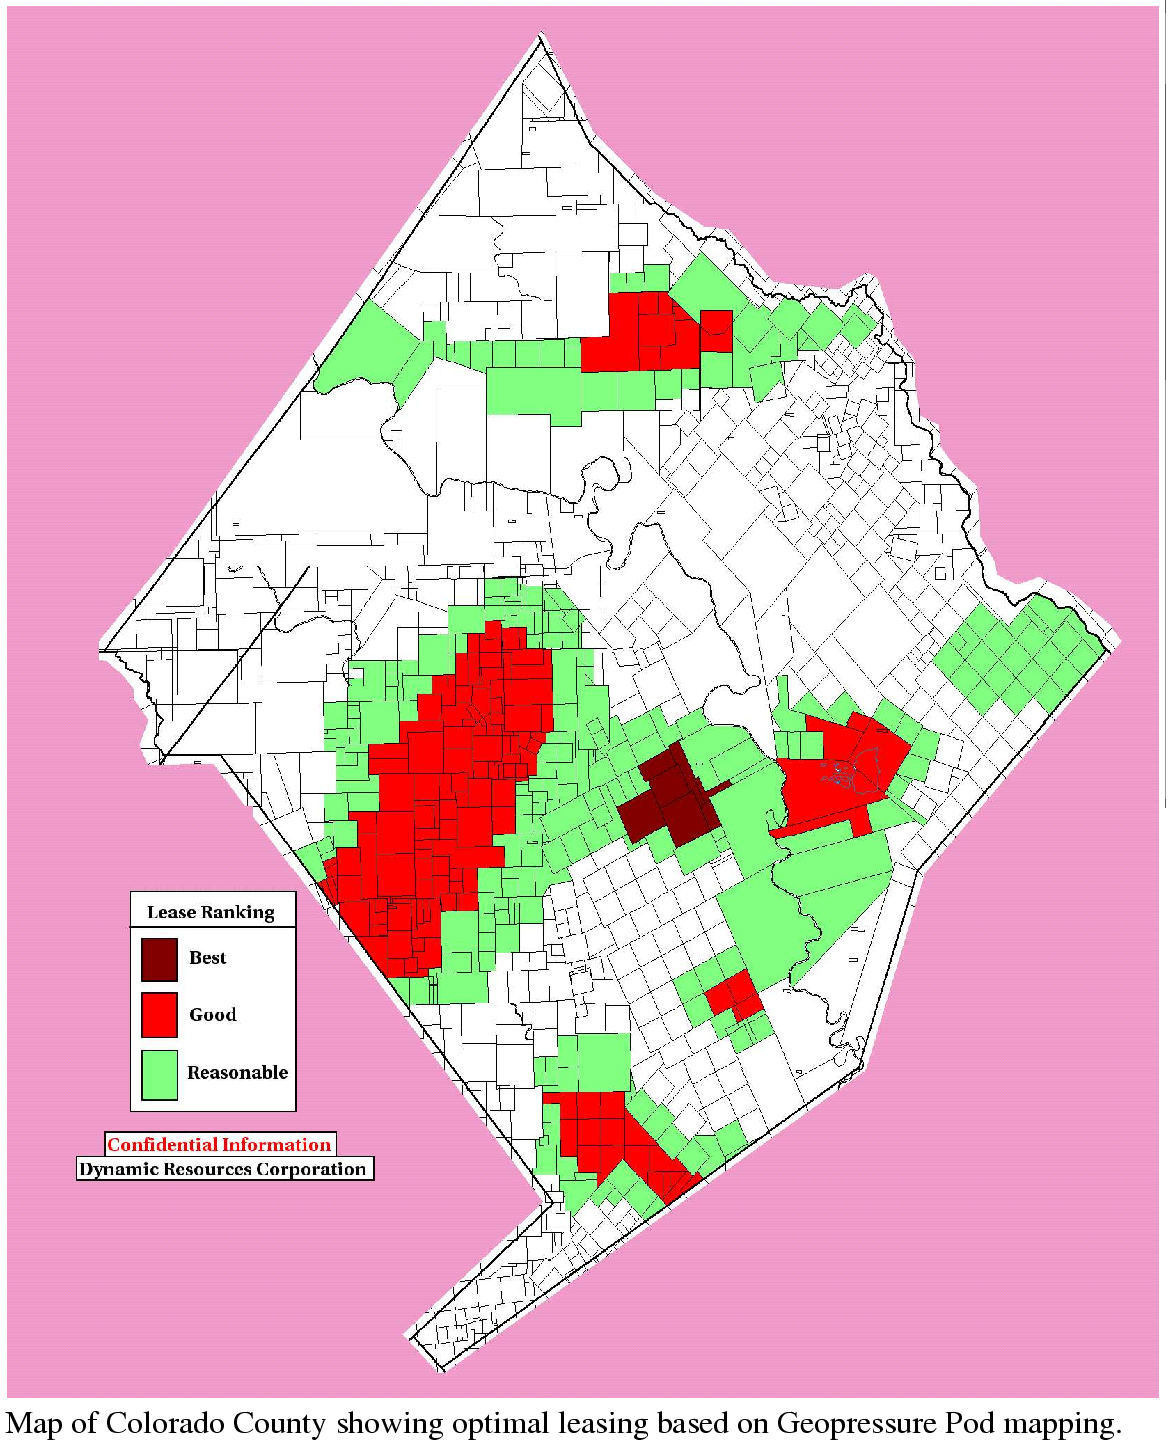
Seitel 3D in Colorado County 2008 | Best Leases to Obtain Based on Geopressure Pods |
 |  |
 |  |
 |  |
 |  |
 |  |
| Ranked Potential Drilling Sites in Colorado County | Oak Tree Trend Across Colorado County |
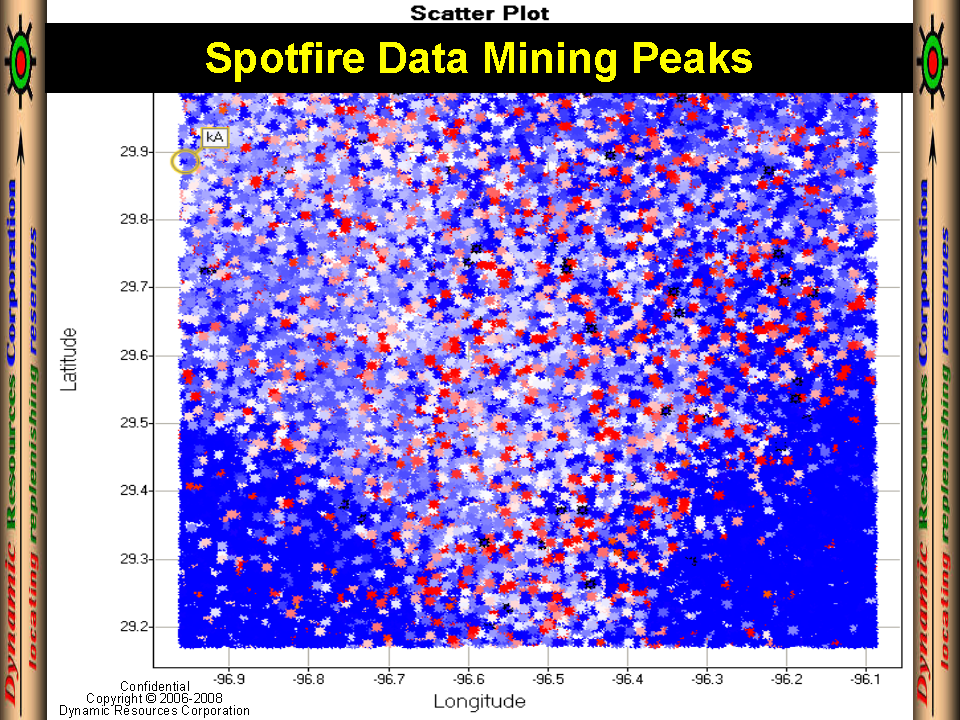
Positive Strokes / Oak Trees Animation | Spotfire Peak Current Map Colorado County |
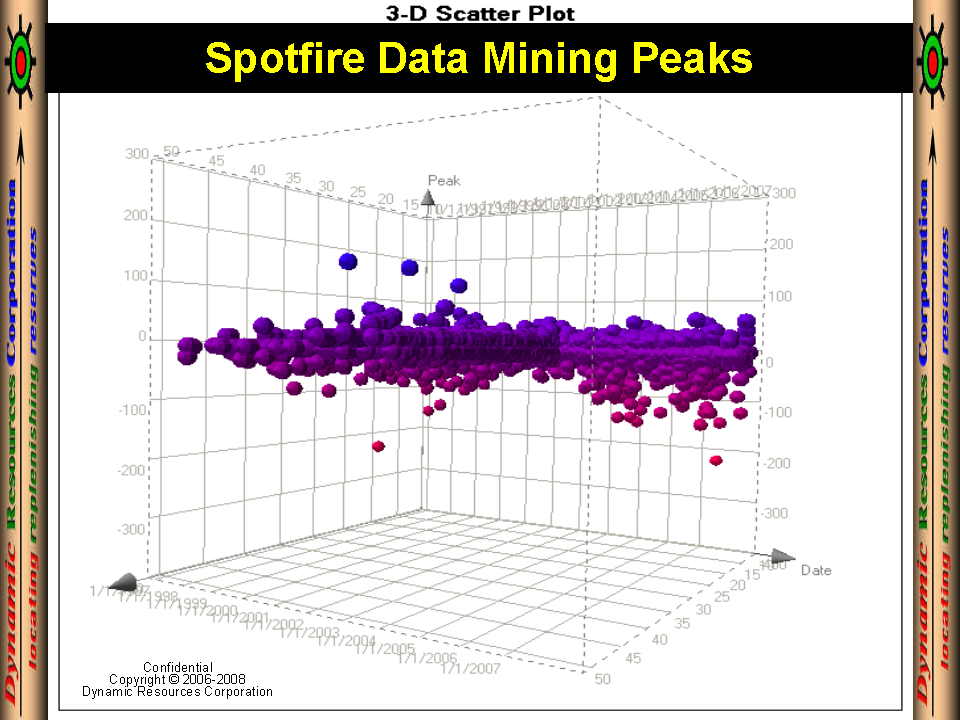
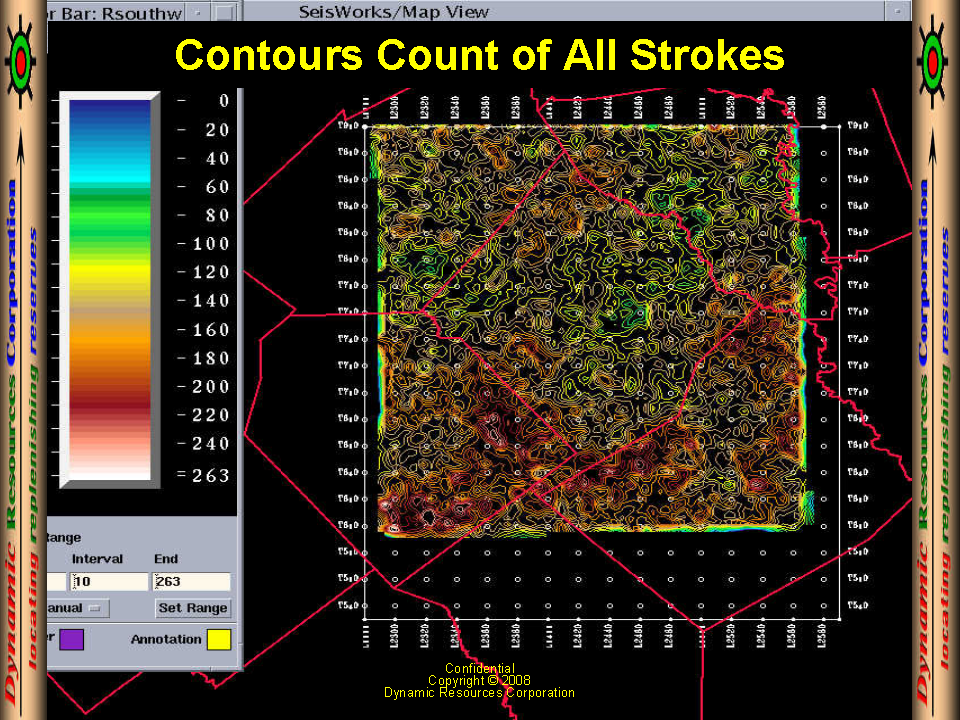
Spotfire Peak Current vs Number vs Date | Contours of All Strokes |
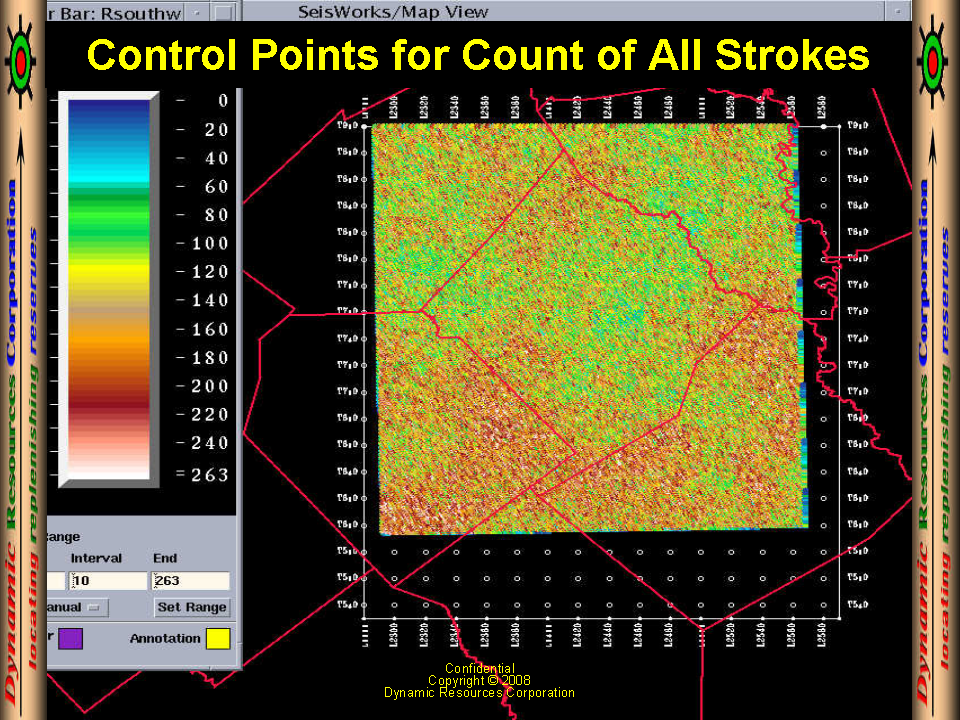
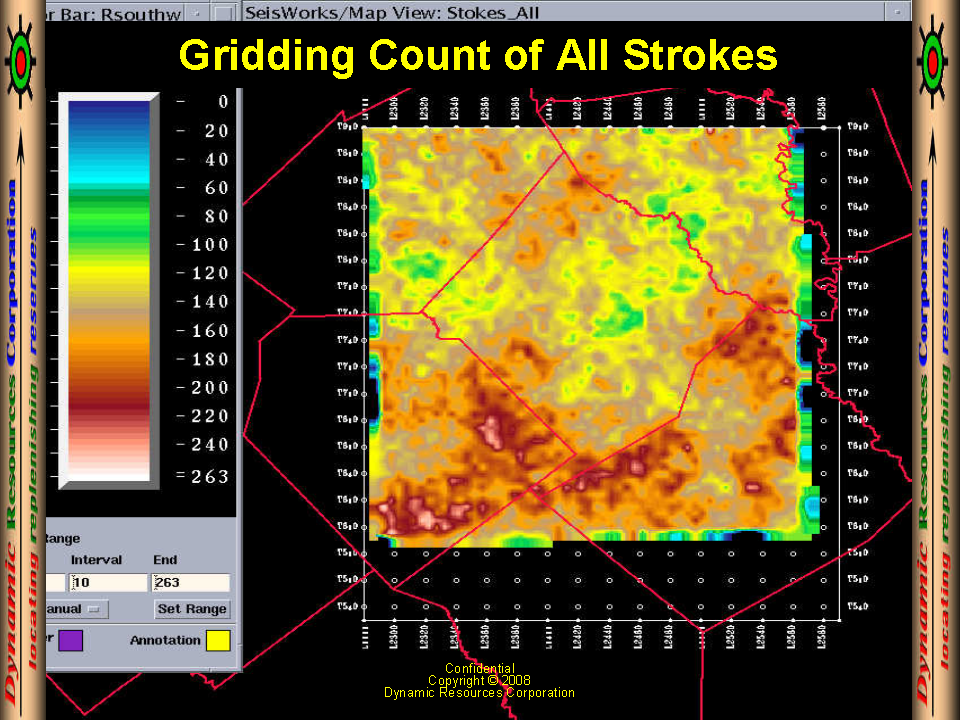
Control Points of All Strokes | Gridding of All Strokes |
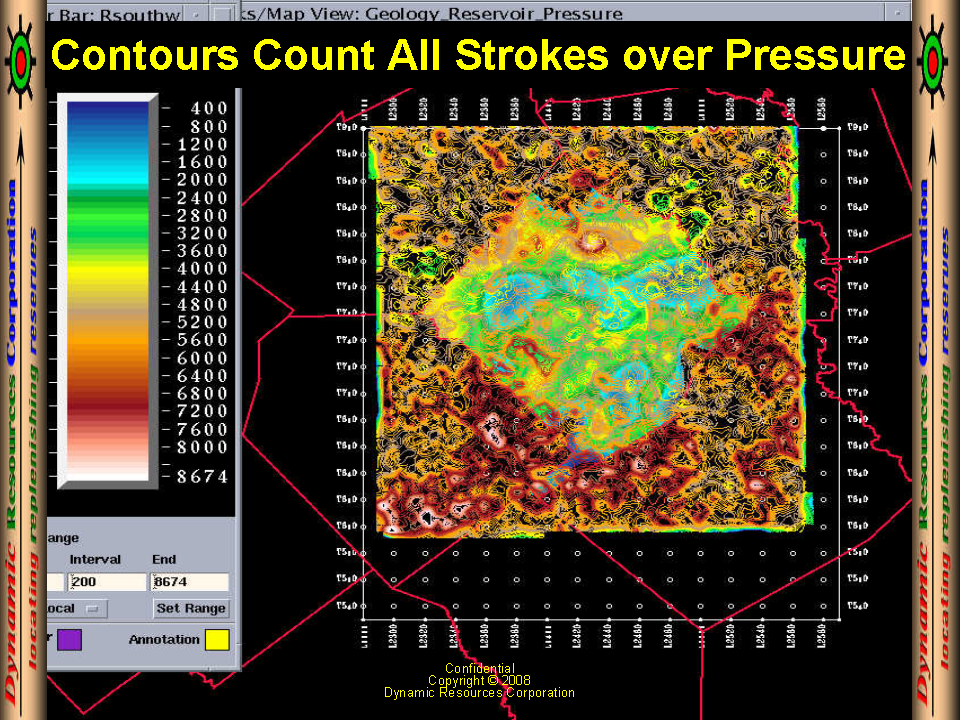
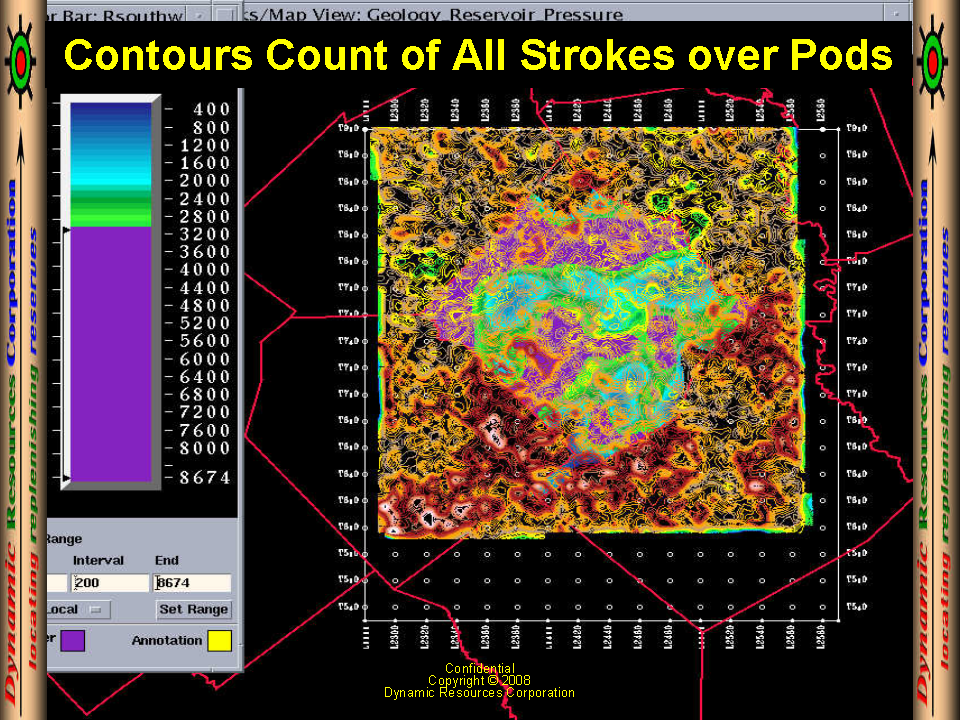
All Strokes Over Pressure | All Strokes Over Pods |
 |  |
 |  |
 |  |
 |  |
 |  |
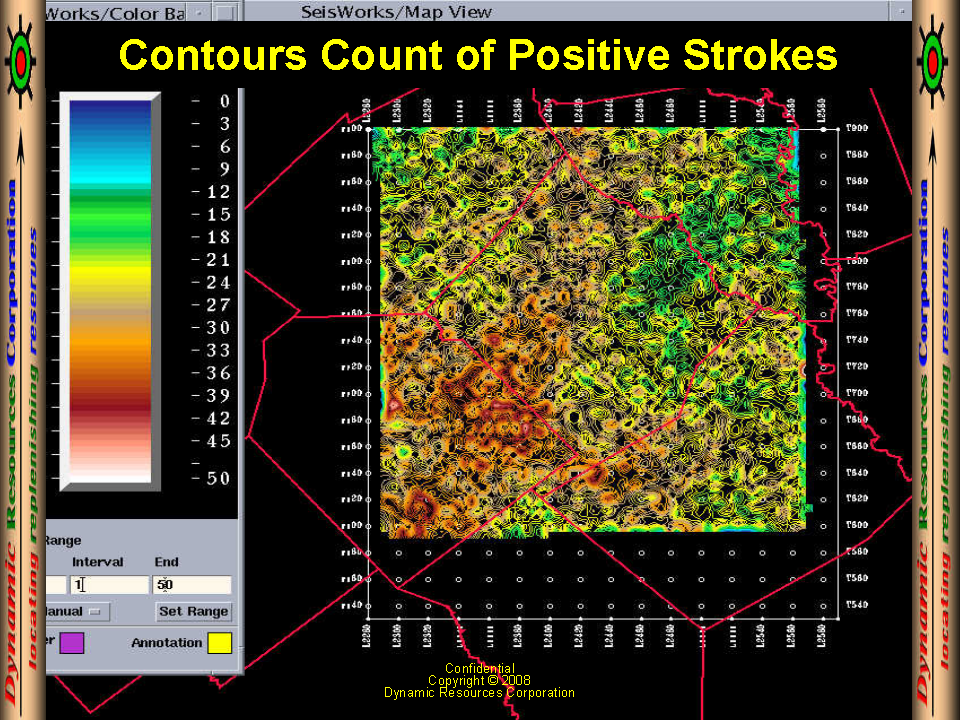
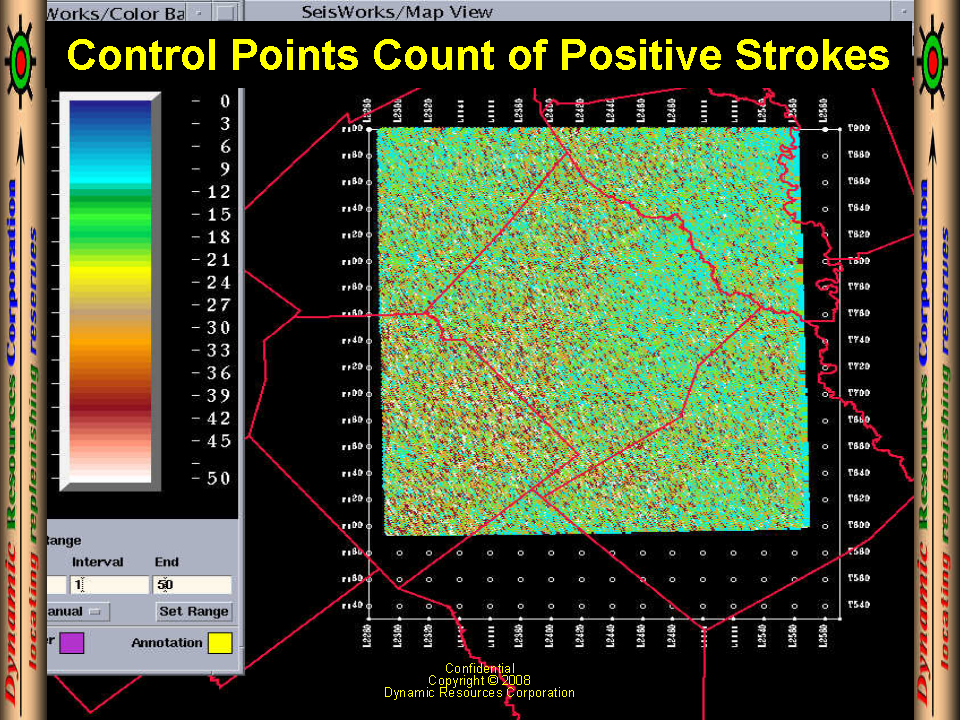
| Contours of Positive Strokes | Control Points of Positive Strokes |
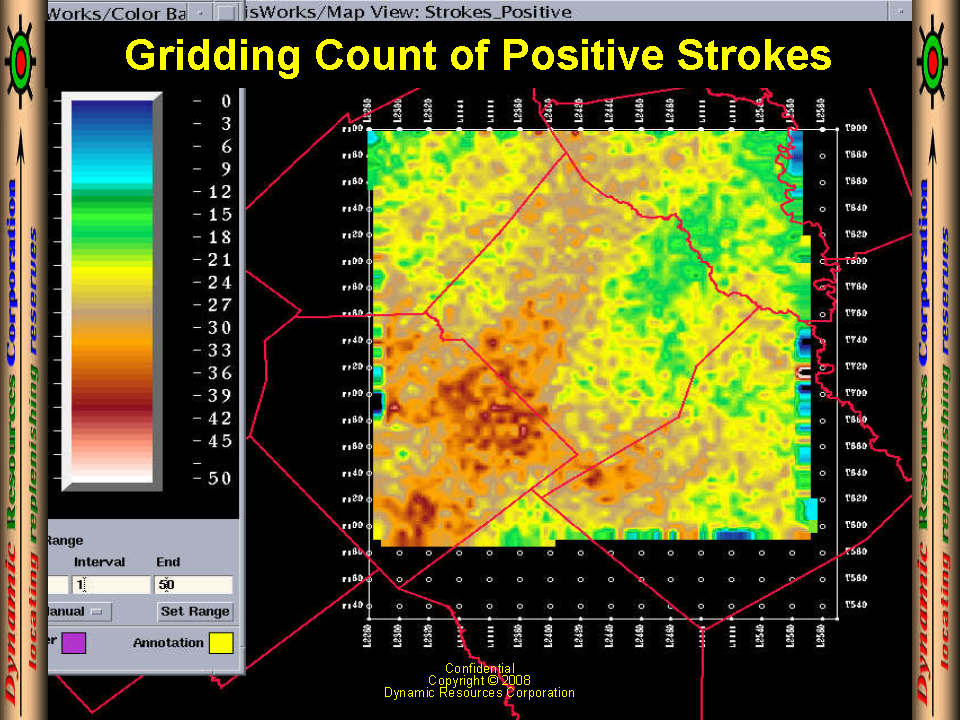
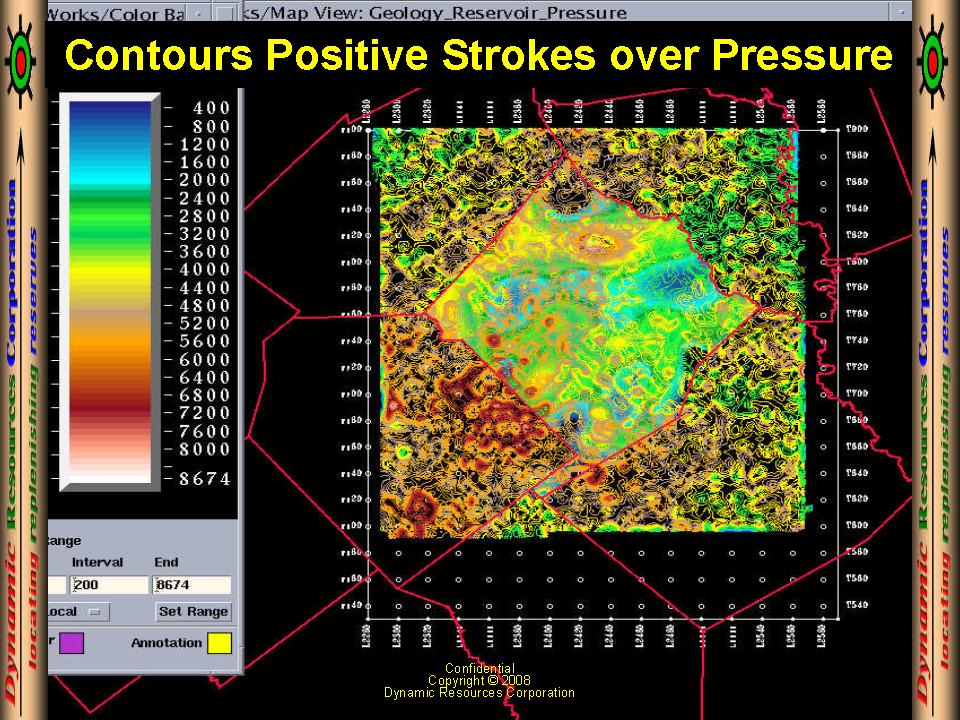
Gridding of Positive Strokes | Positive Strokes Over Pressure |
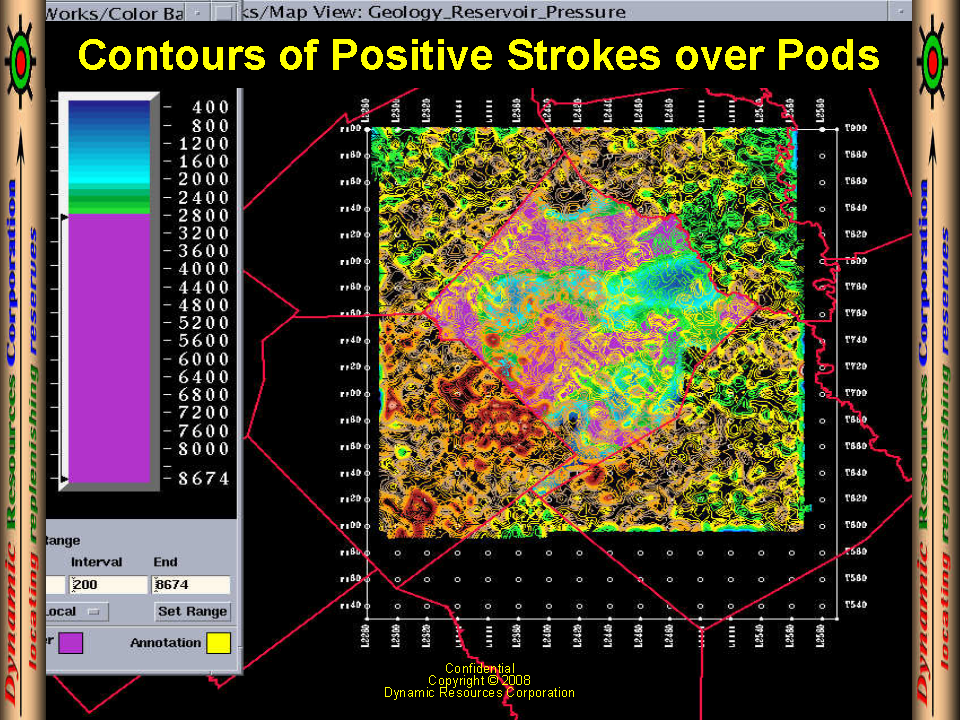
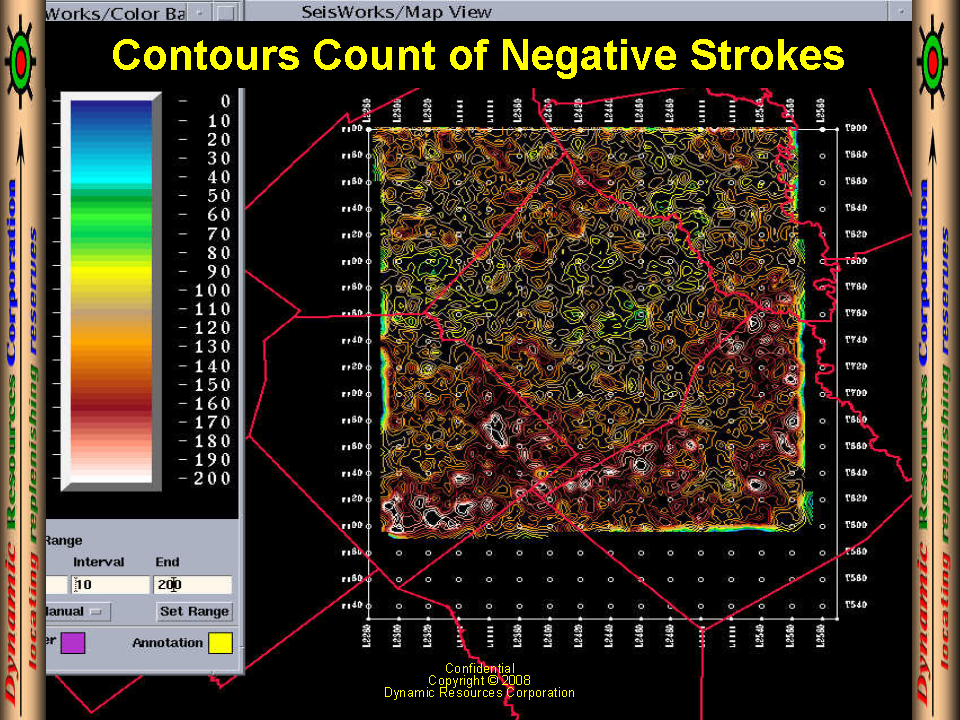
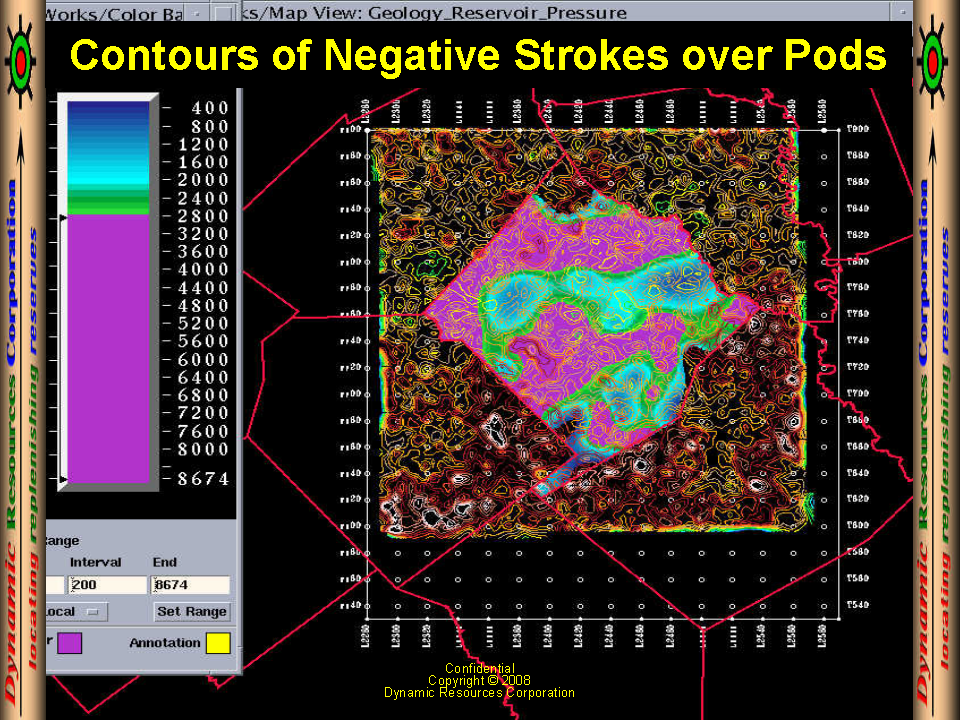
Positive Strokes Over Pods | Contours of Negative Strokes |
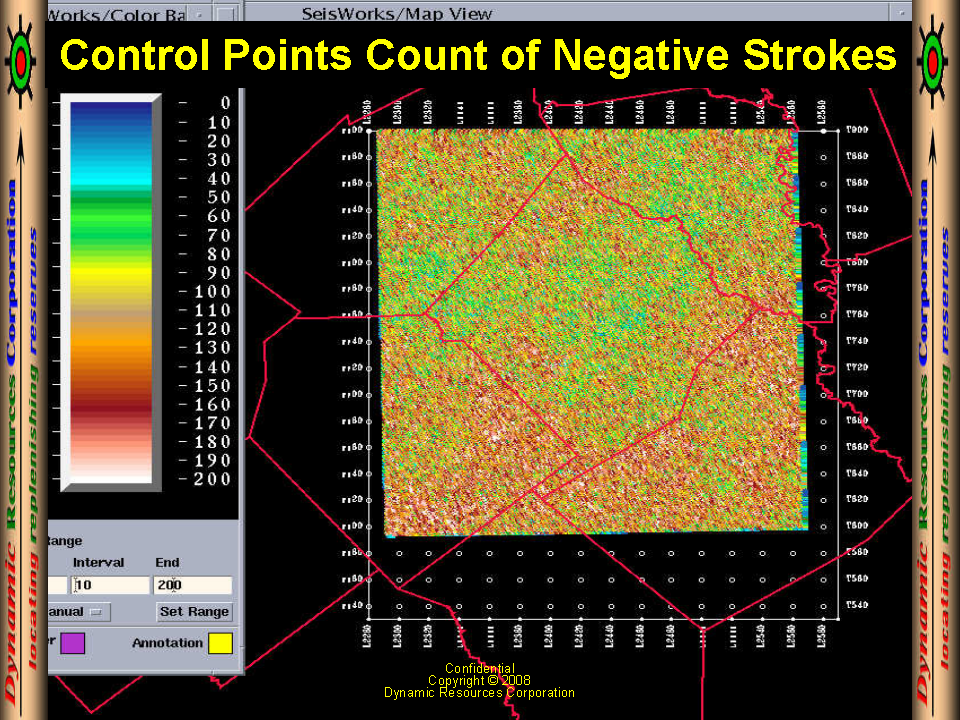
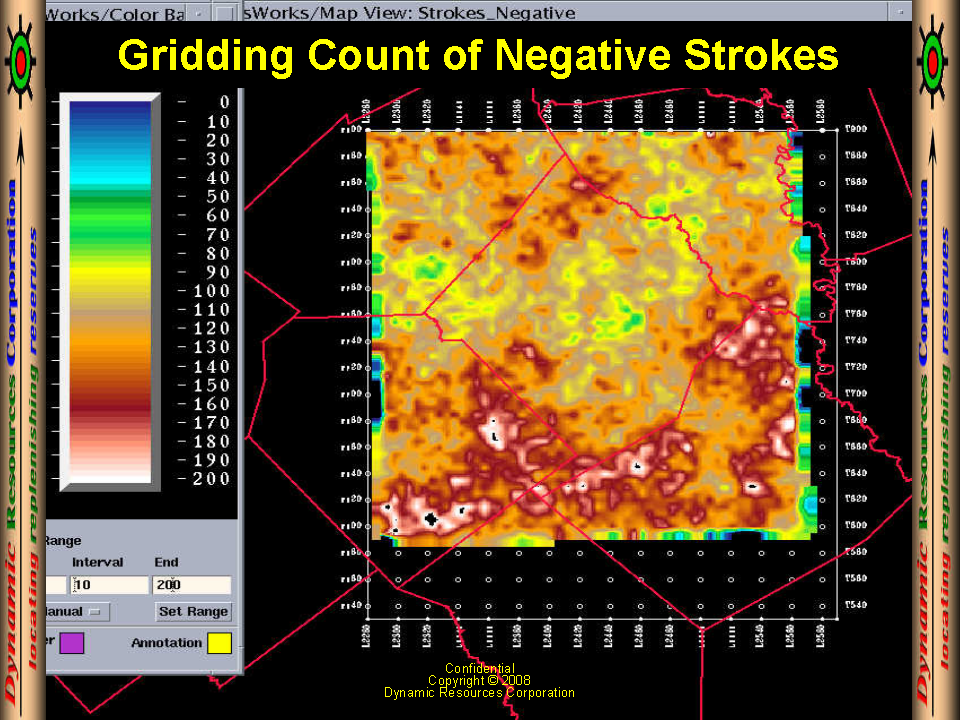
Control Points of Negative Strokes | Gridding of Negative Strokes |
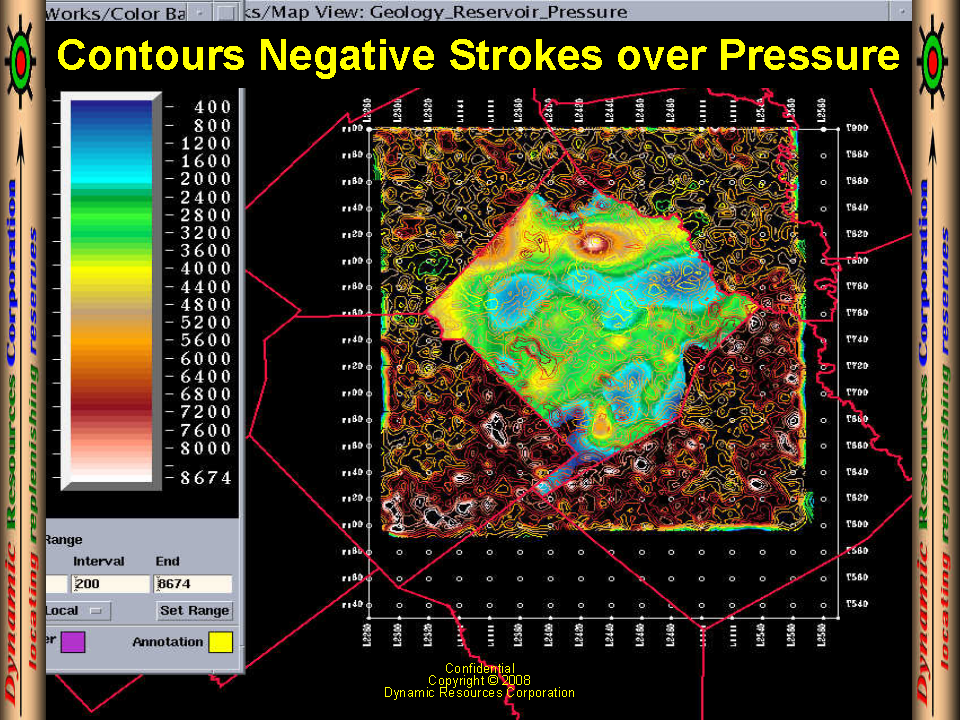
Negative Strokes Over Pressure | Negative Strokes Over Pods |
 |  |
 |  |
 |  |
 |  |
 |  |
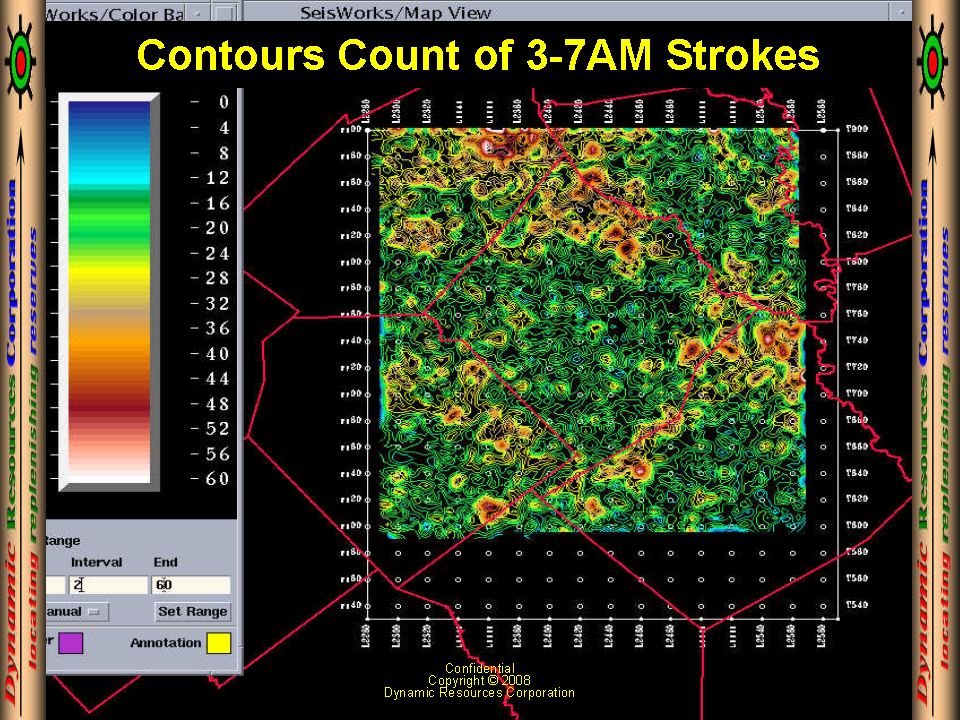
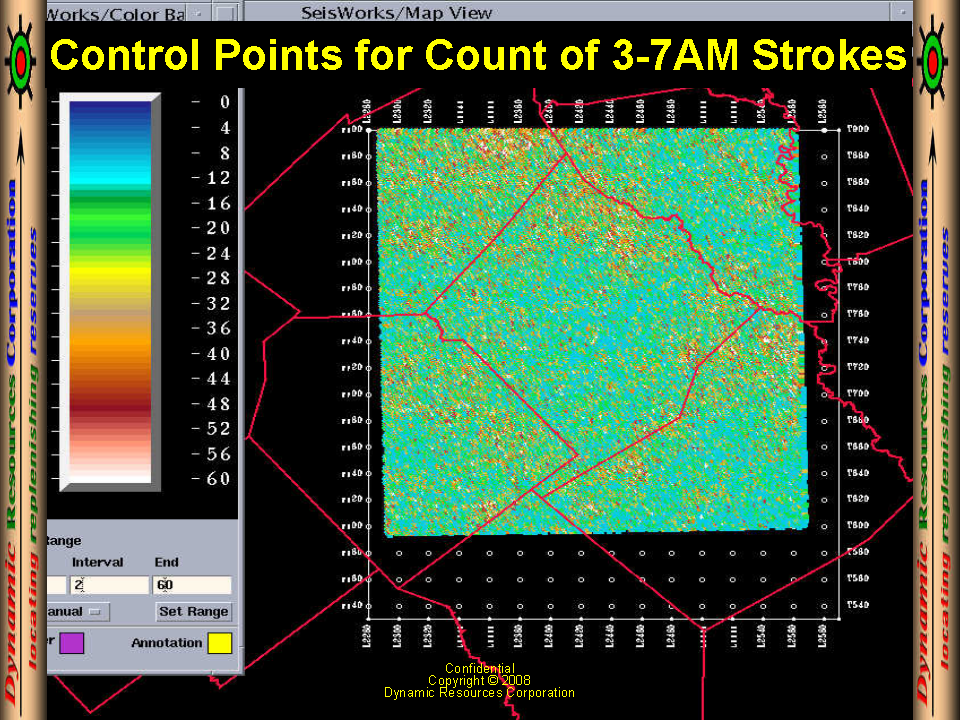
| Contours of 3:00-7:00 AM Strokes | Control Points of 3:00-7:00 AM |
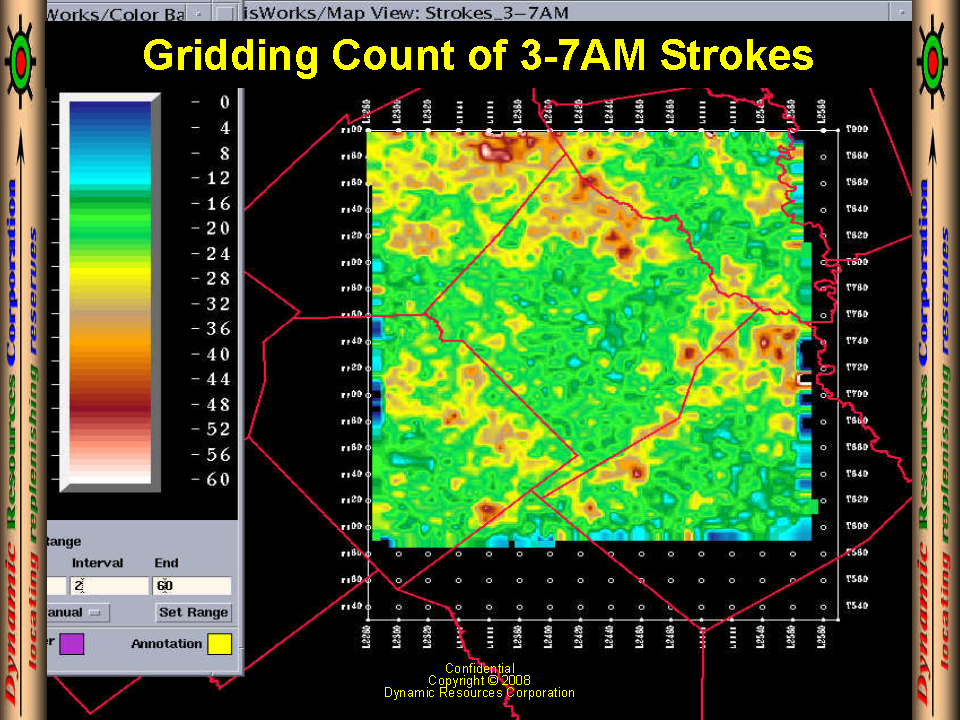
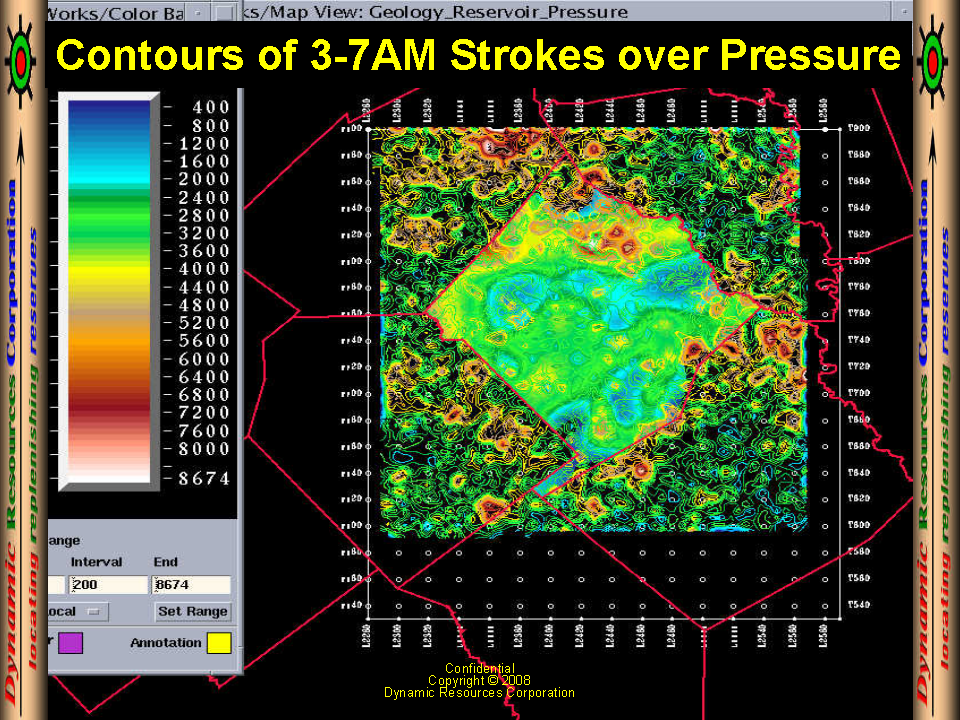
Gridding of 3:00-7:00 AM Strokes | 3:00-7:00 AM Over Pressure |
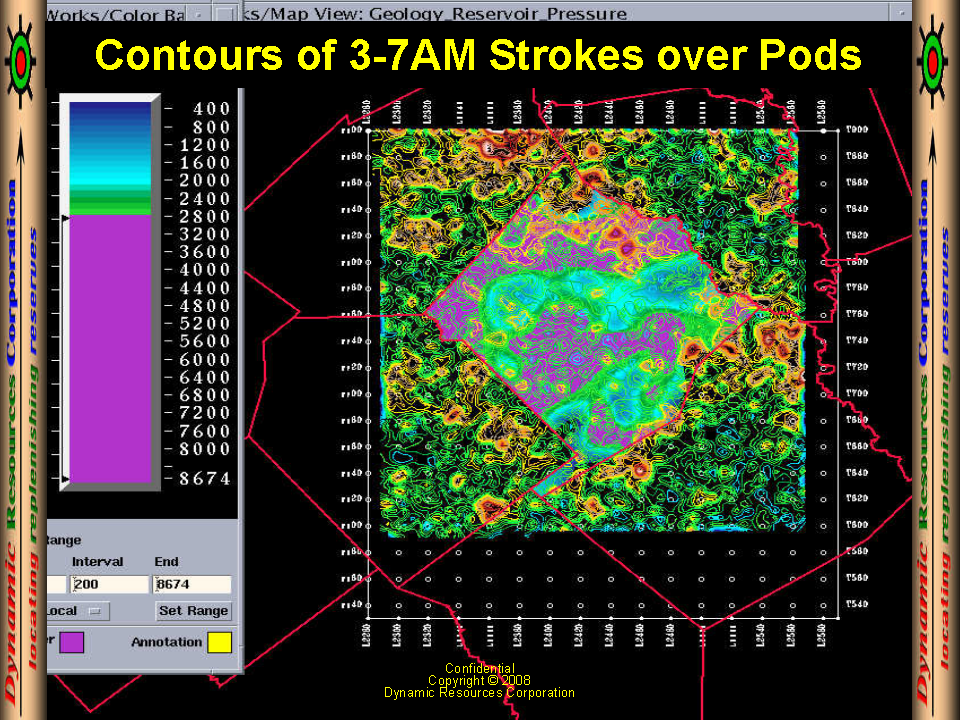
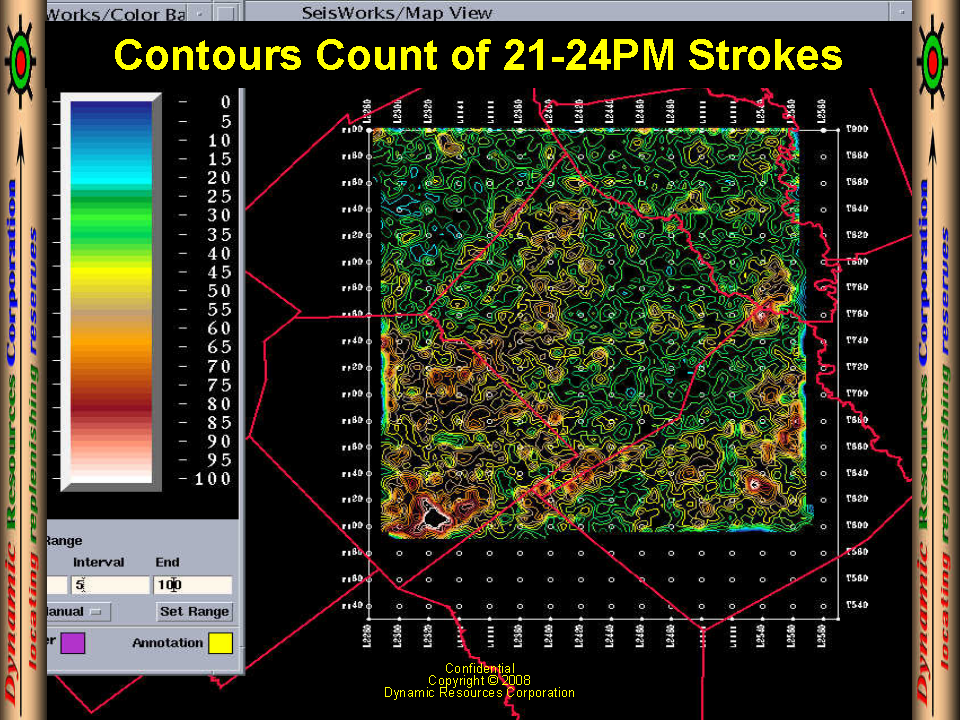
3:00-7:00 AM Strokes Over Pods | Contours of 21:00-24:00 PM |
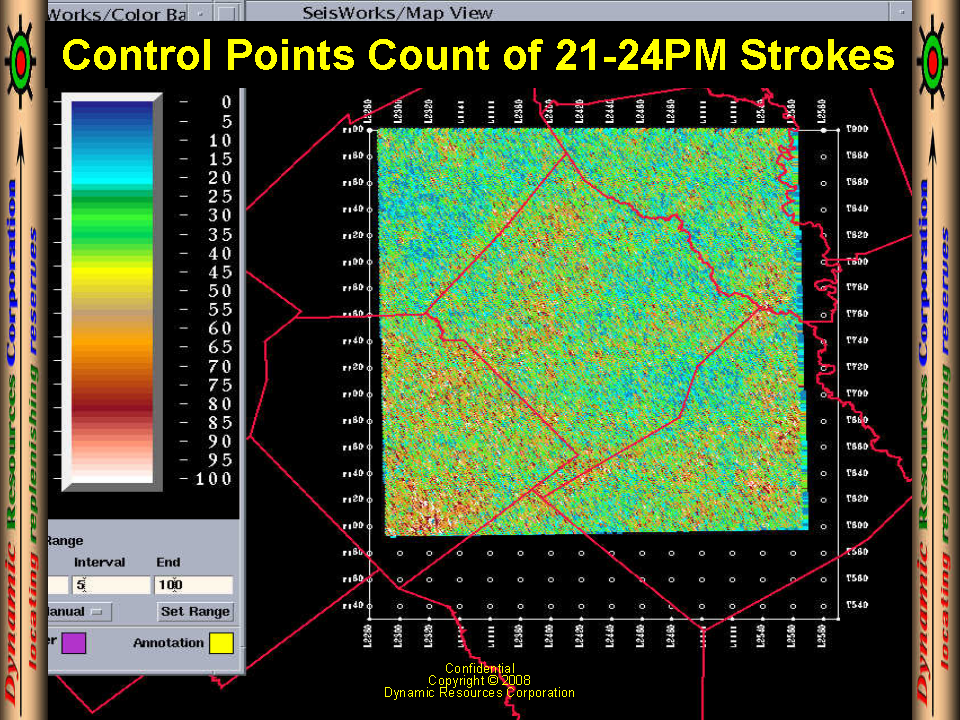
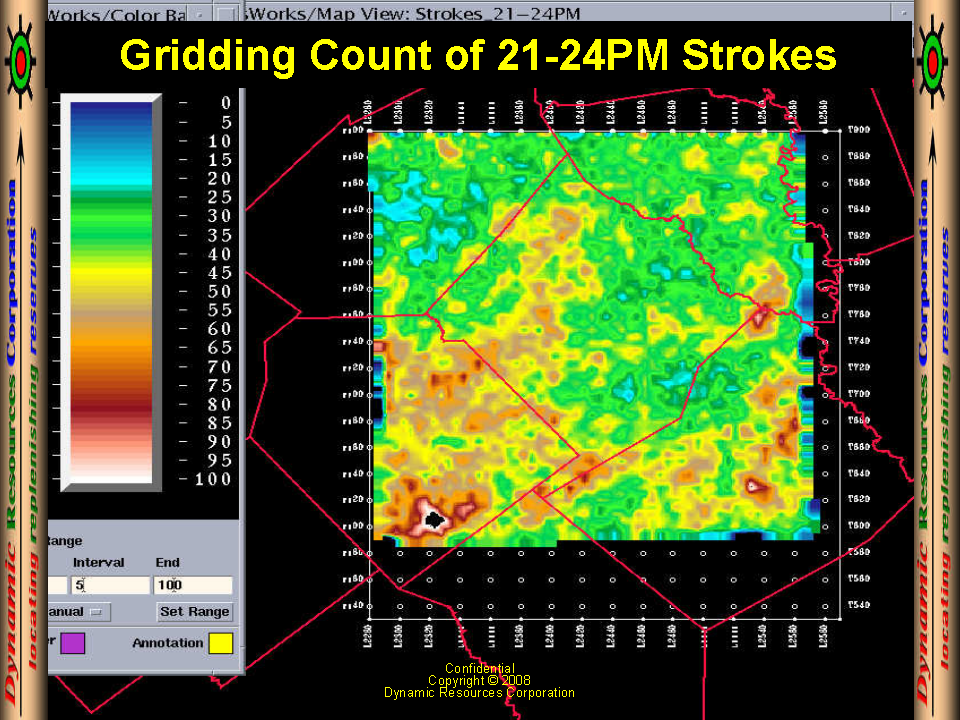
Control Points of 21:00-24:00 PM | Gridding of 21:00-24:00 PM |
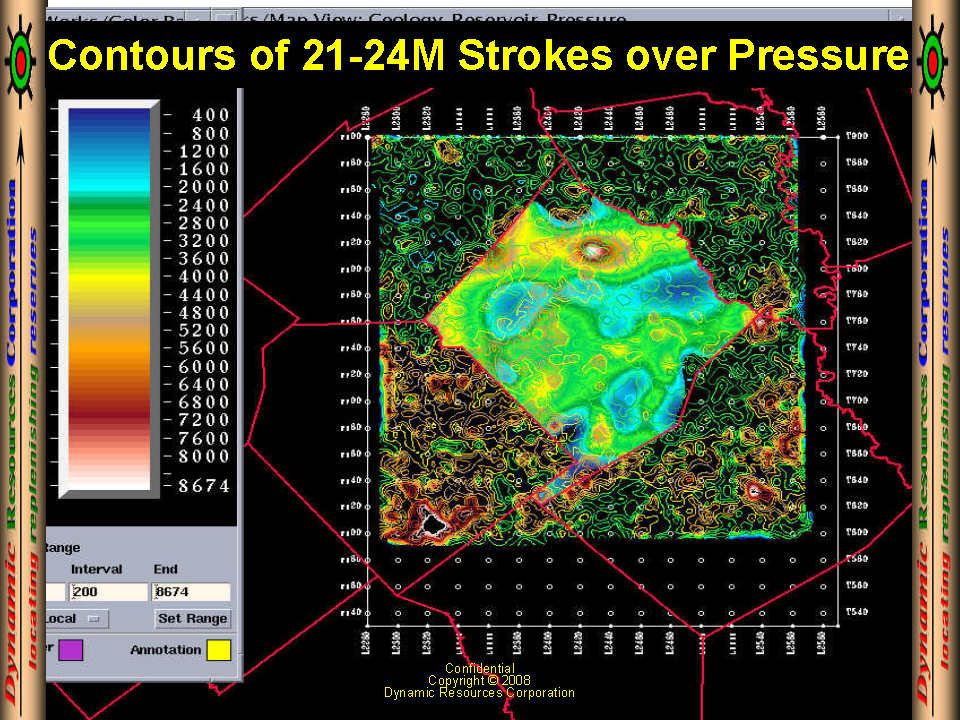
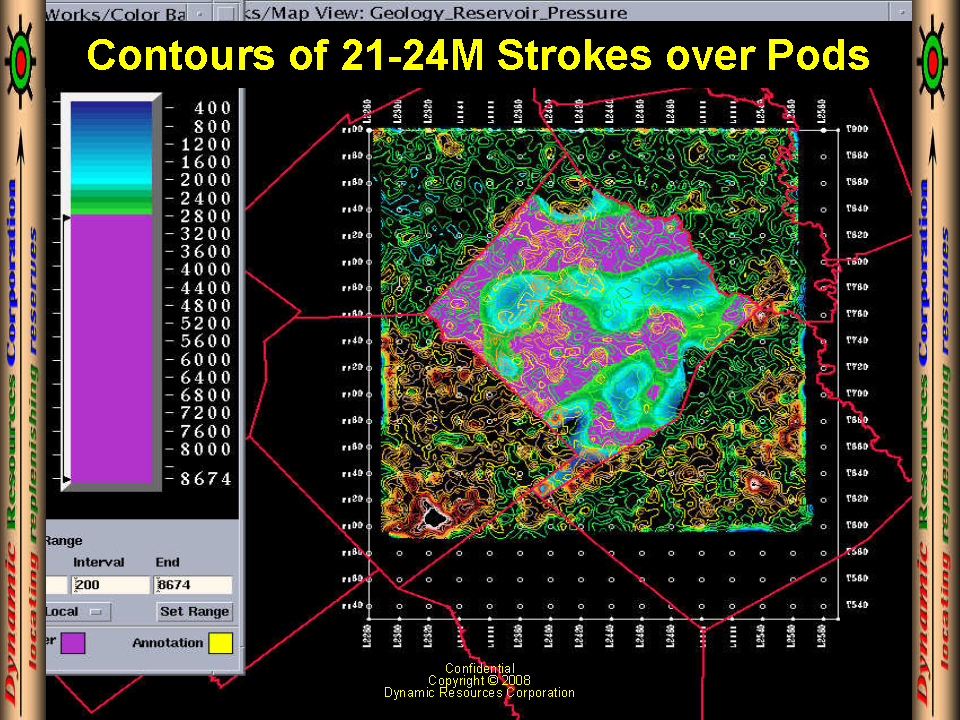
21:00-24:00 PM Over Pressure | 21:00-24:00 PM Strokes Over Pods |
 |  |
 |  |
 |  |
 |  |
 |  |
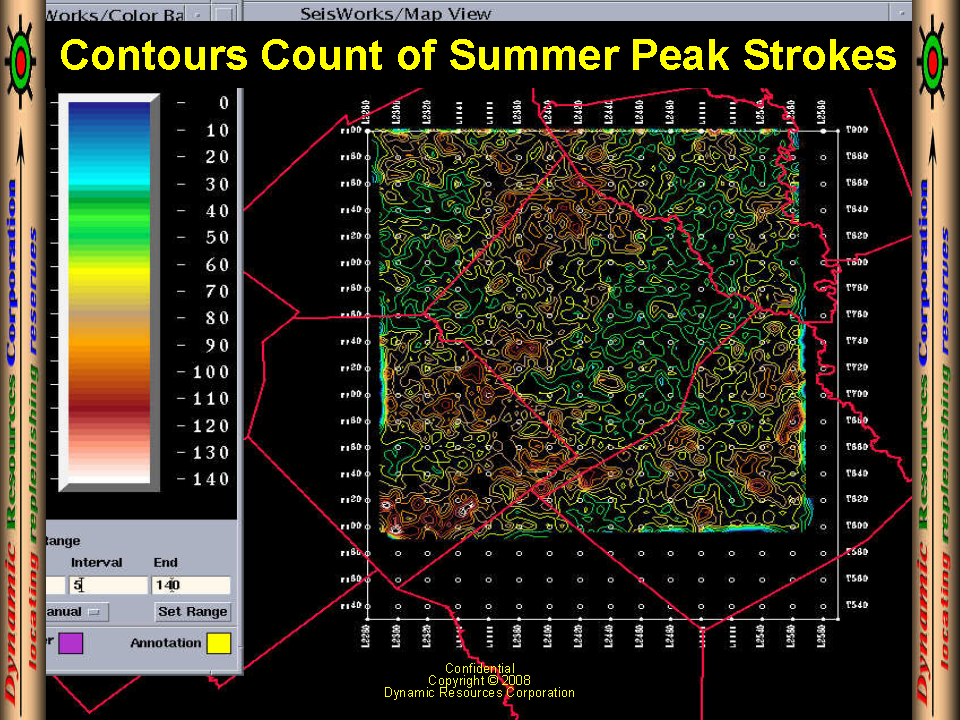
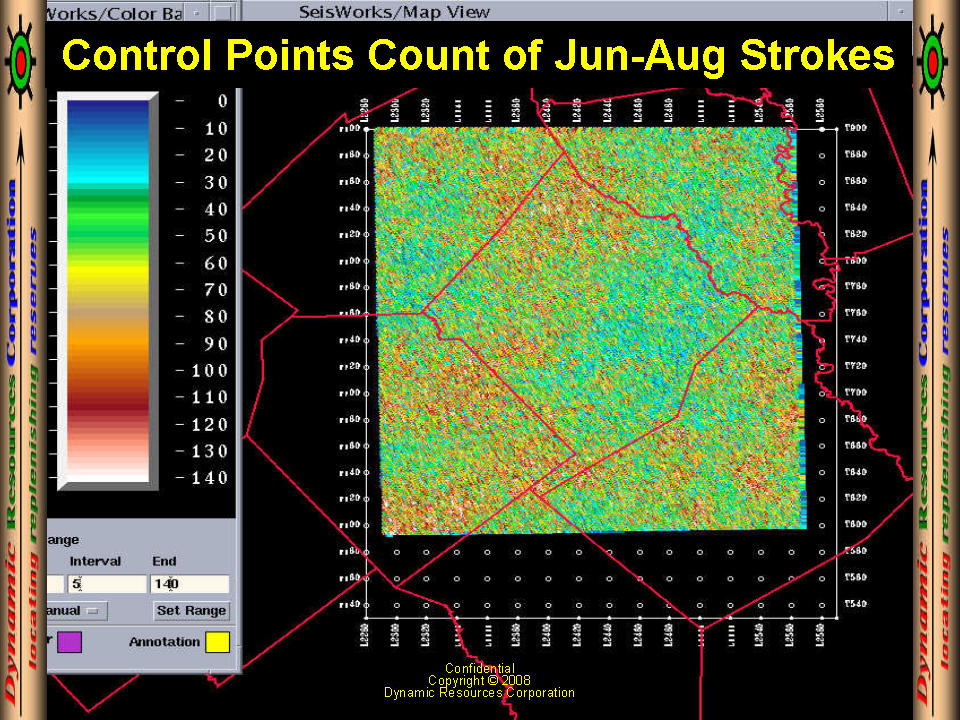
| Contours of Summar Peak | Control Points of Summar Peak |
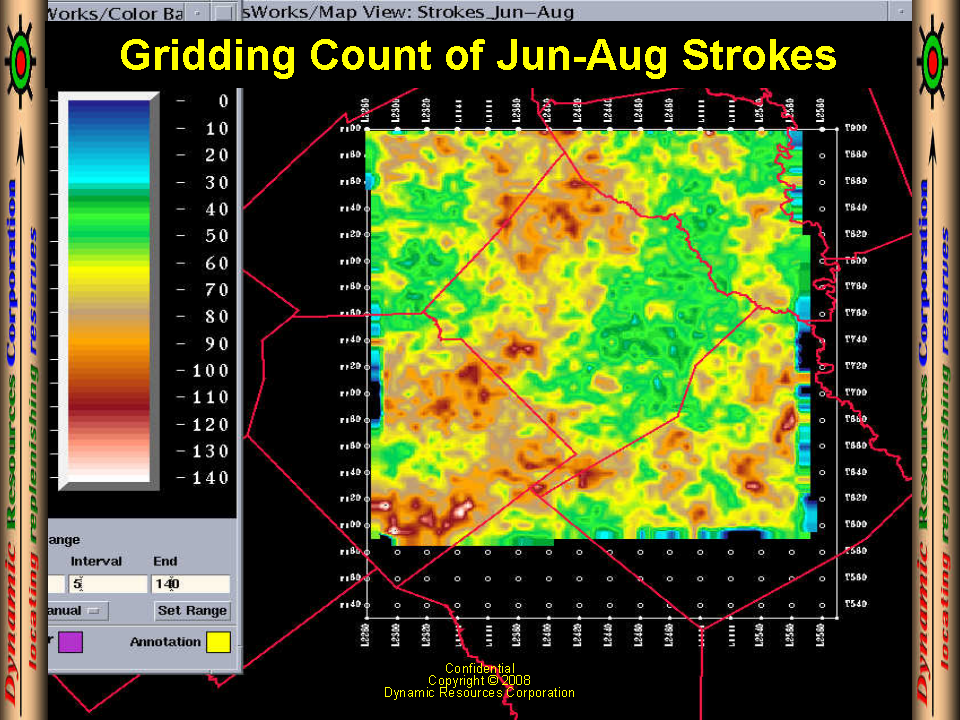
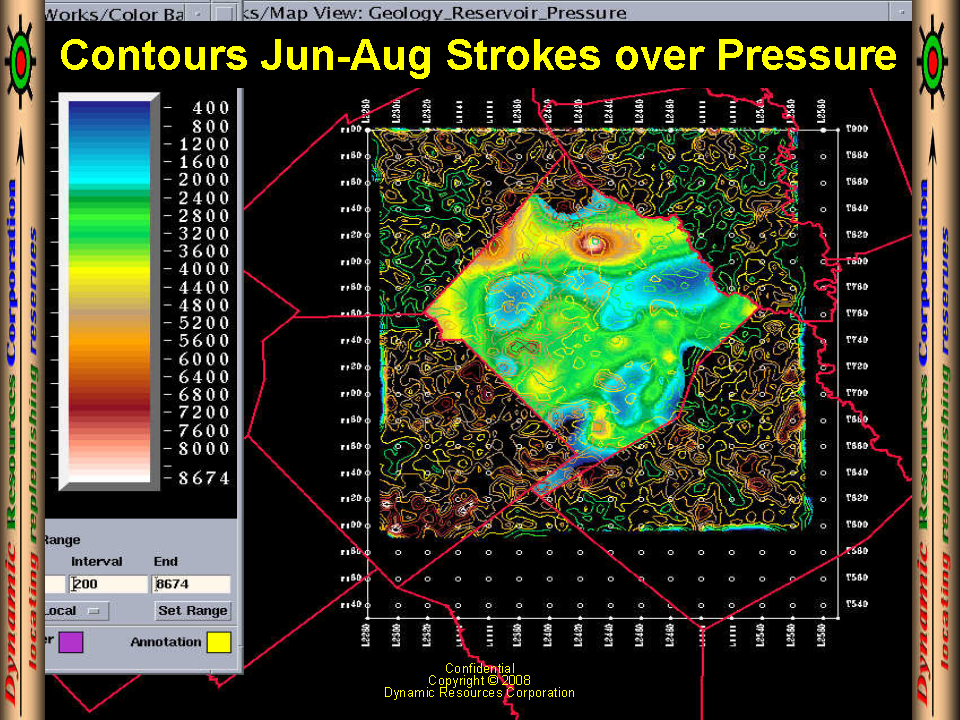
Gridding of June-August Strokes | June-August Over Pressure |
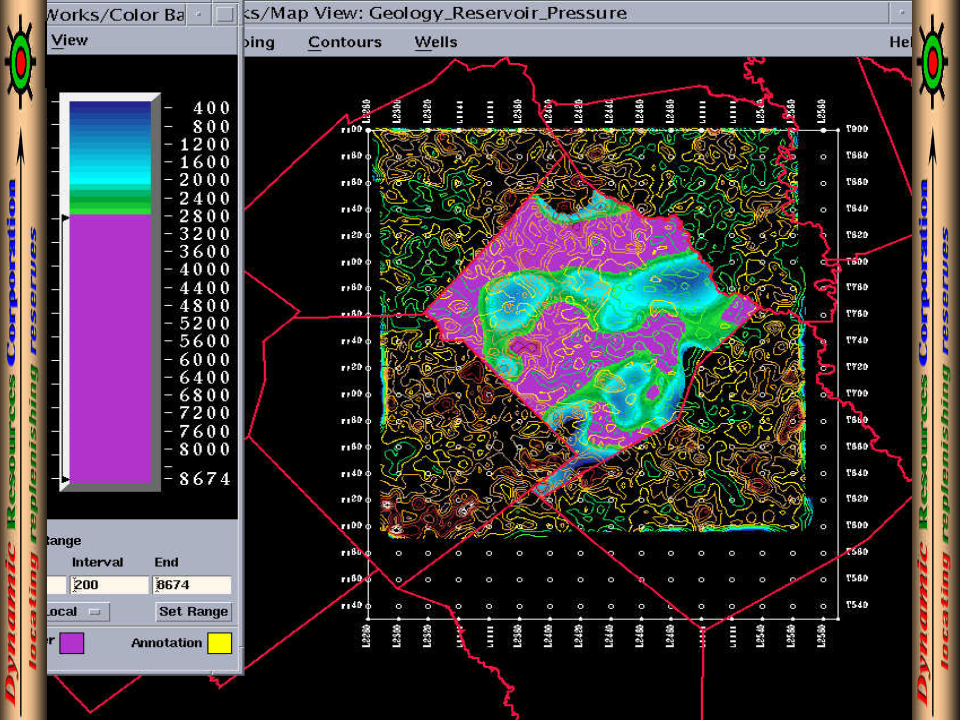
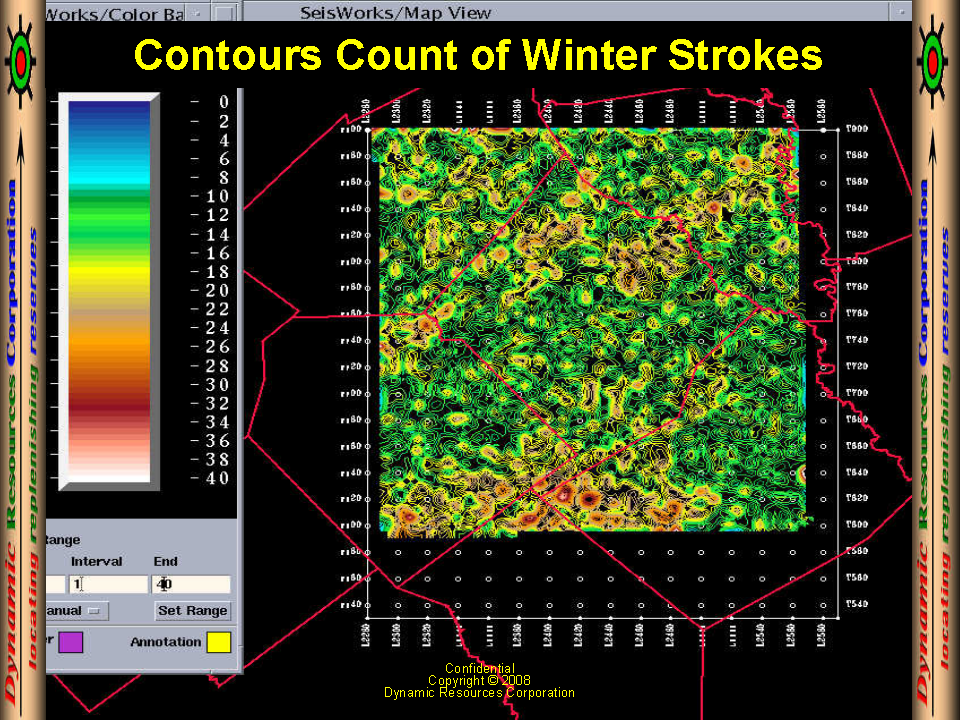
June-August Strokes Over Pods | Contours of Winter Strokes |
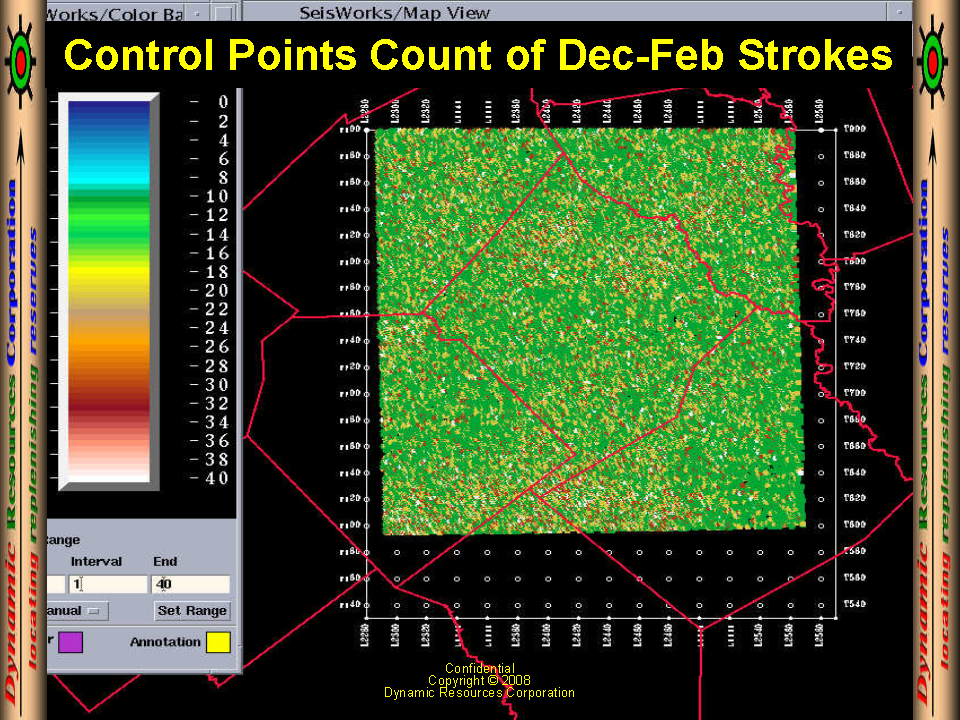
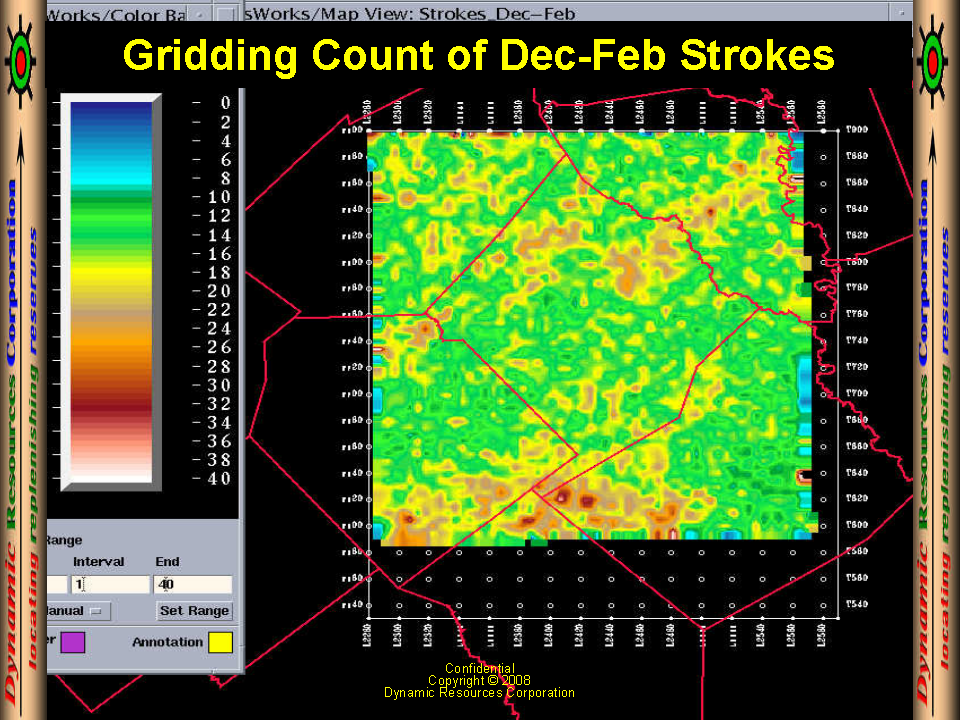
Control Points of Dec-Feb Strokes | Gridding of Dec-Feb Strokes |
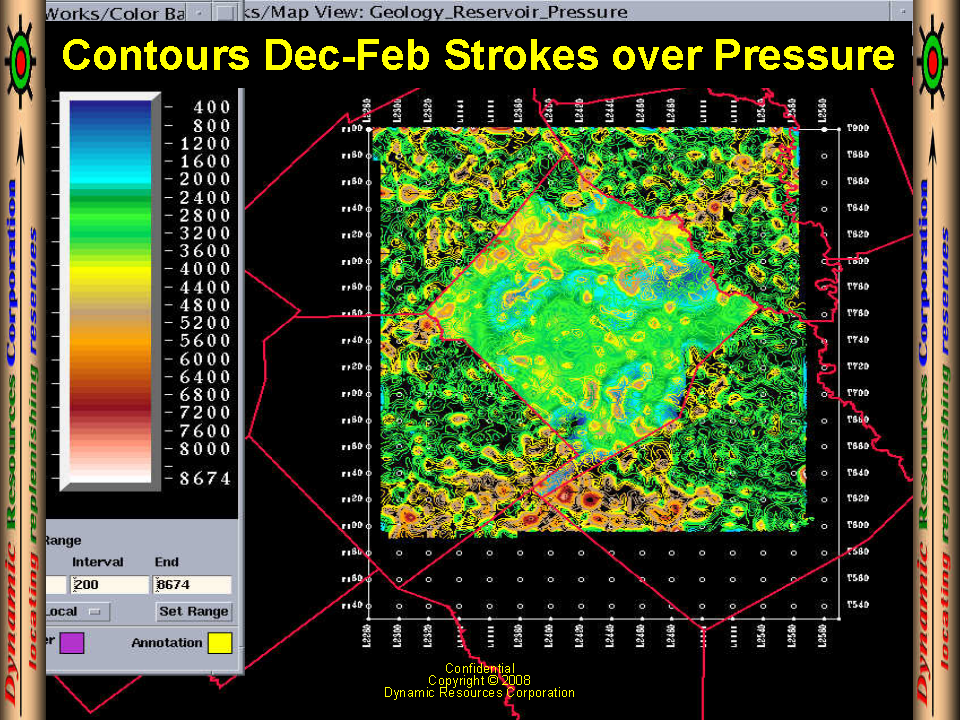
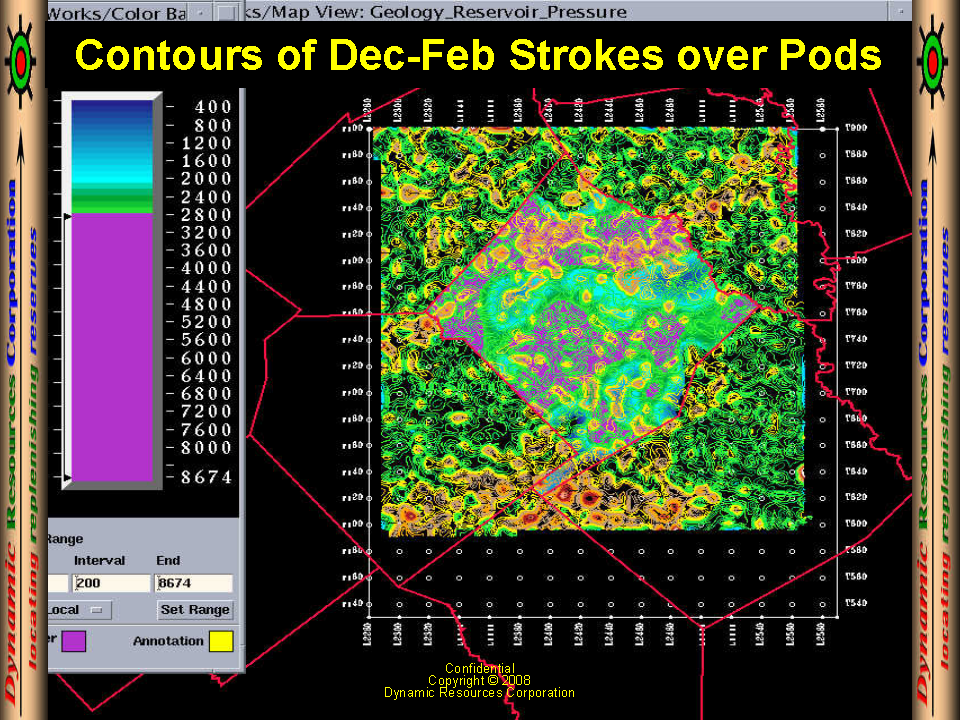
Dec-Feb Strokes Over Pressure | Dec-Feb Strokes Over Pods |
 |  |
 |  |
 |  |
 |  |
 |  |
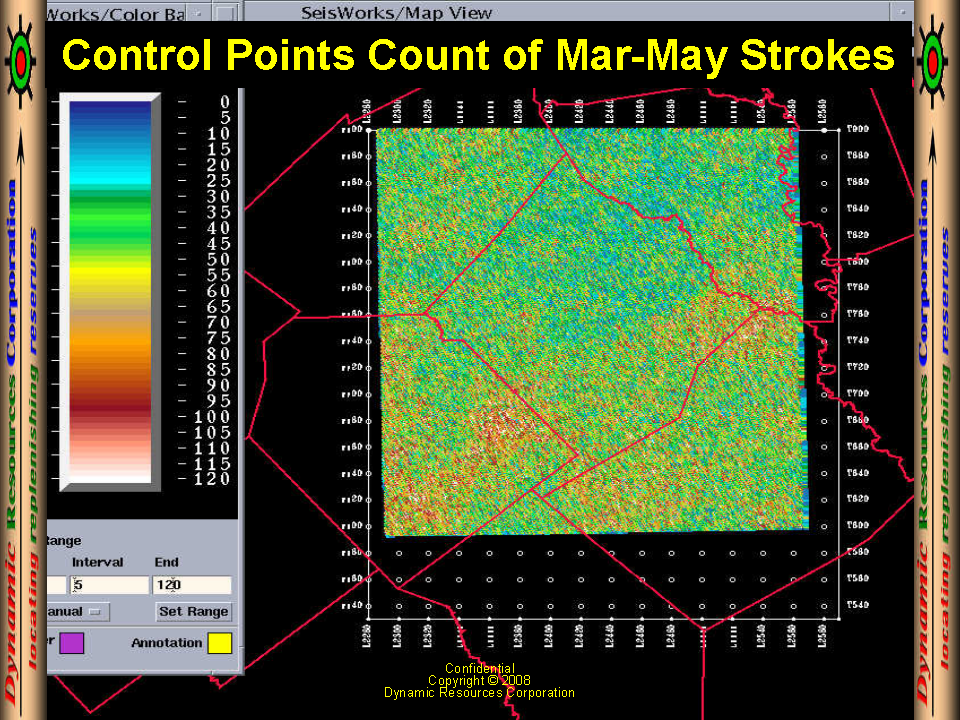
| Contours of Mar-May Strokes | Control Points of Mar-May Strokes |
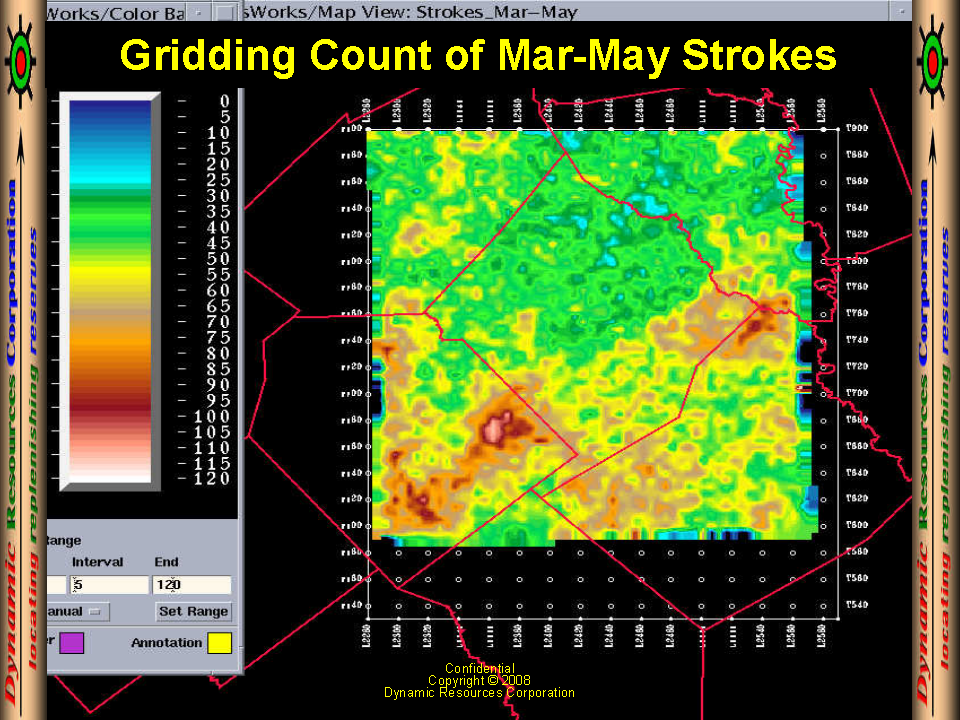
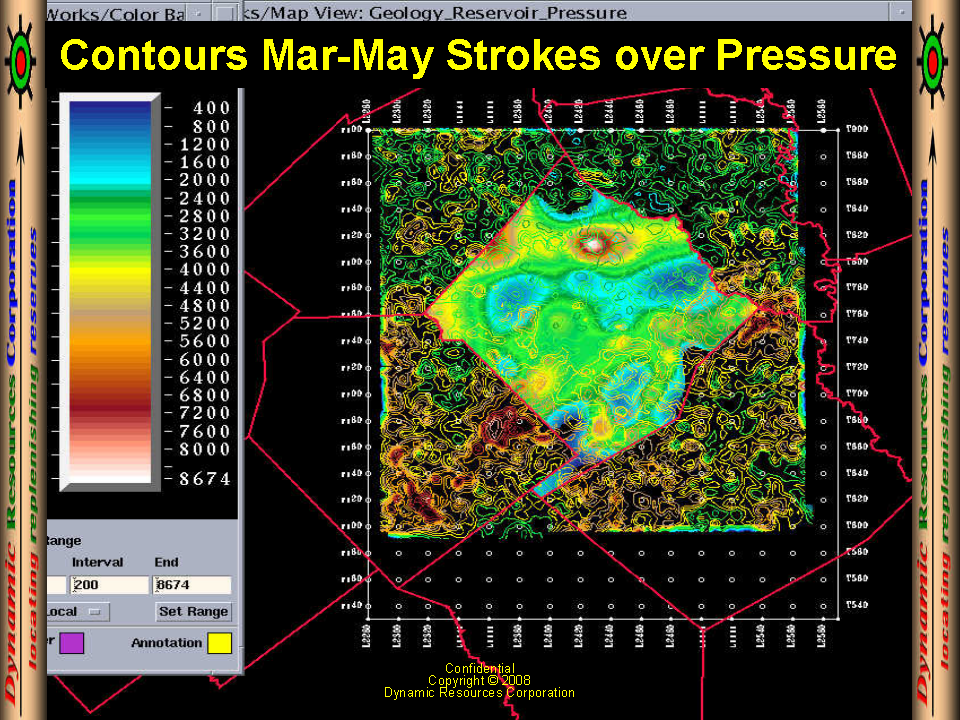
Gridding of Mar-May Strokes | Mar-May+Sep-Nov on Pressure |
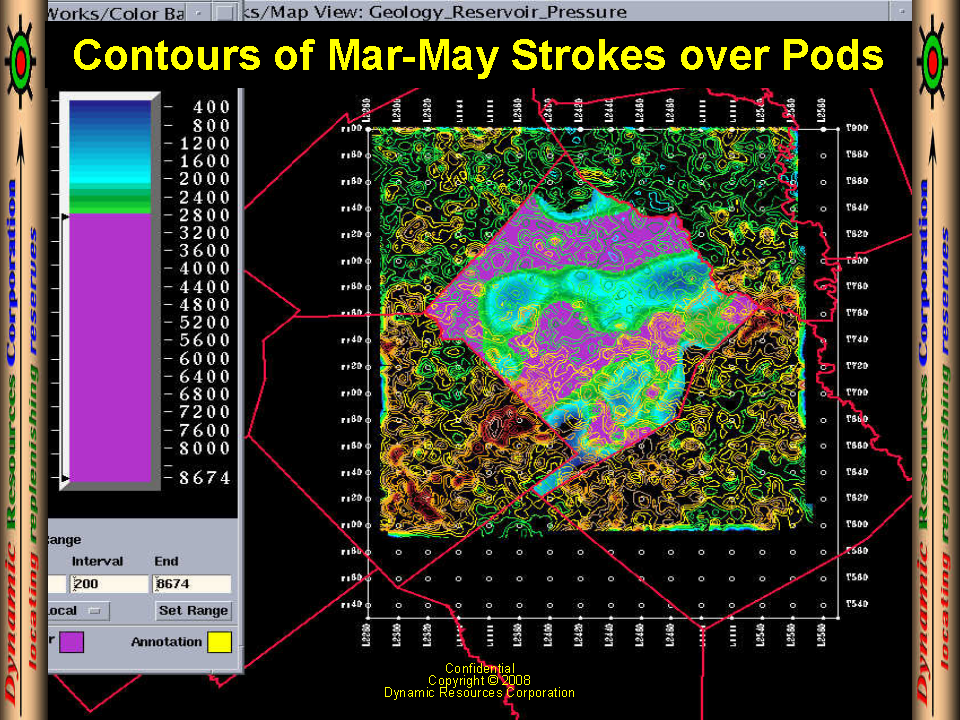
Mar-May Strokes Over Pods | Contours of Sep-Nov Strokes |
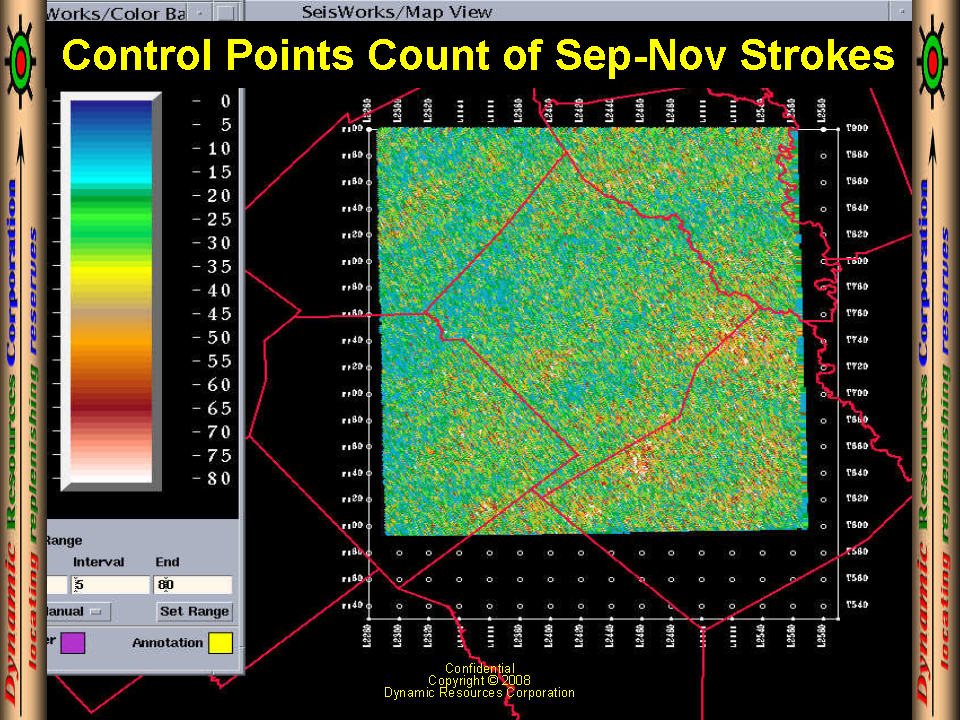
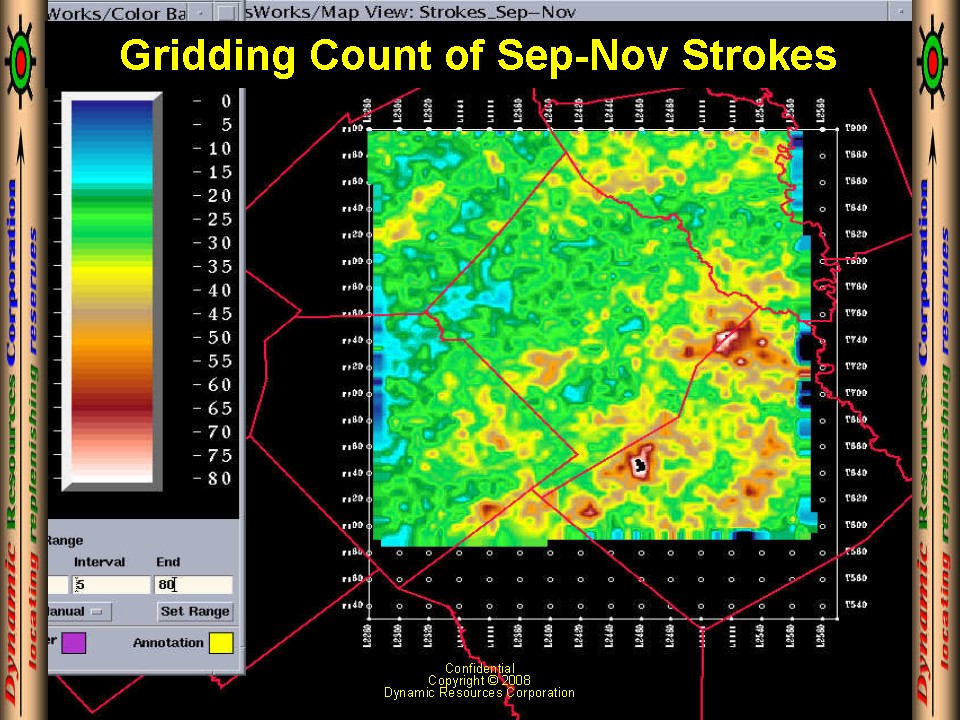
Control Points of Sep-Nov Strokes | Gridding of Sep-Nov Strokes |
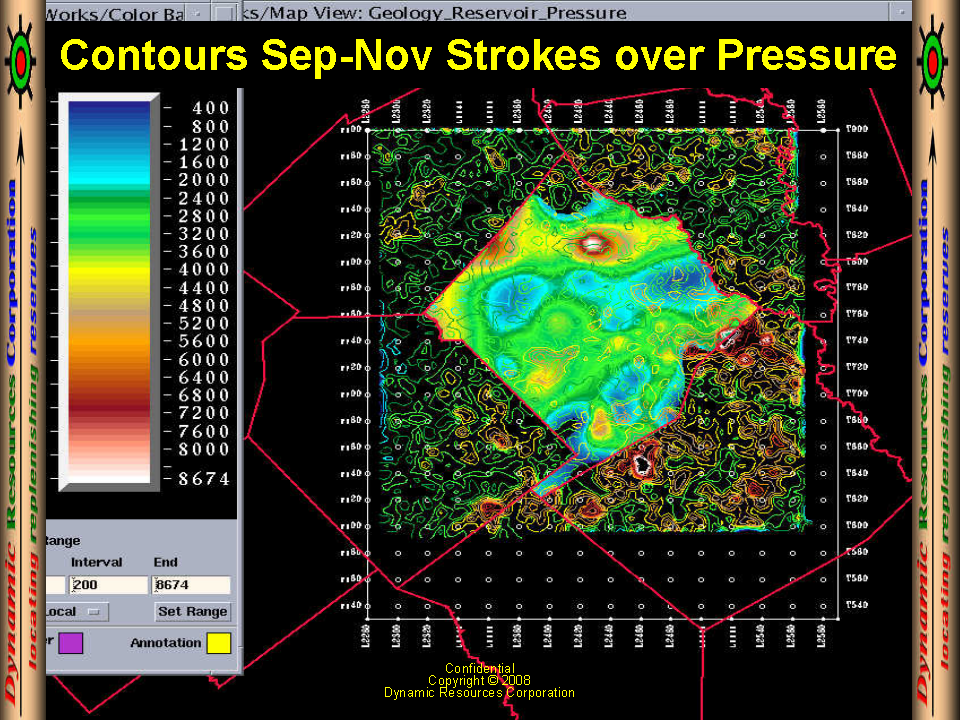
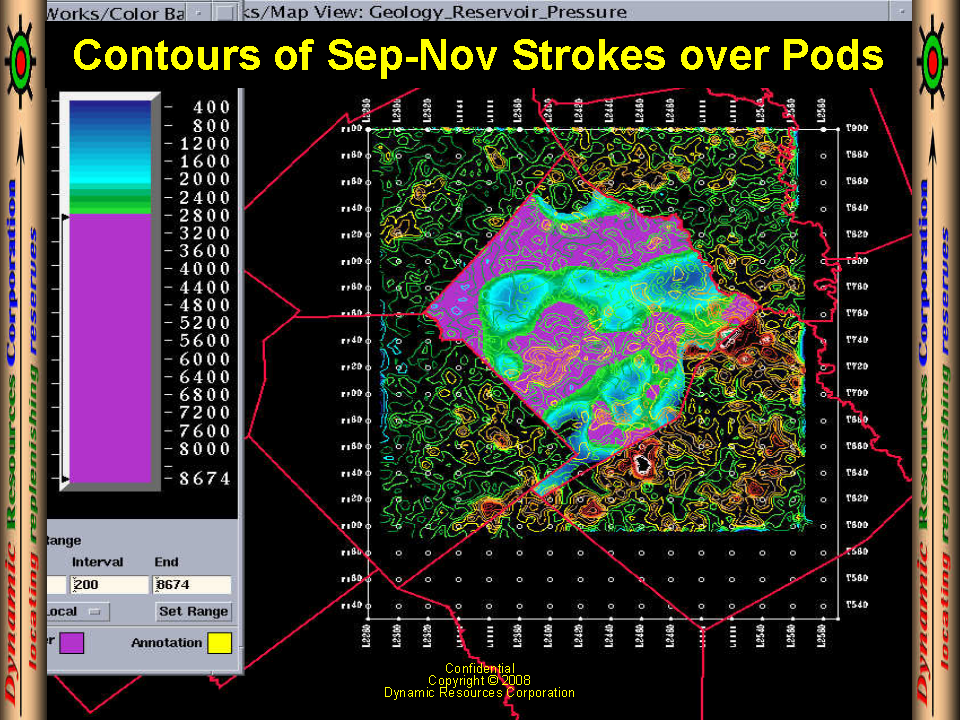
Sep-Nov Strokes Over Pressure | Sep-Nov Strokes Over Pods |
 |  |
 |  |
 |  |
 |  |
 |  |
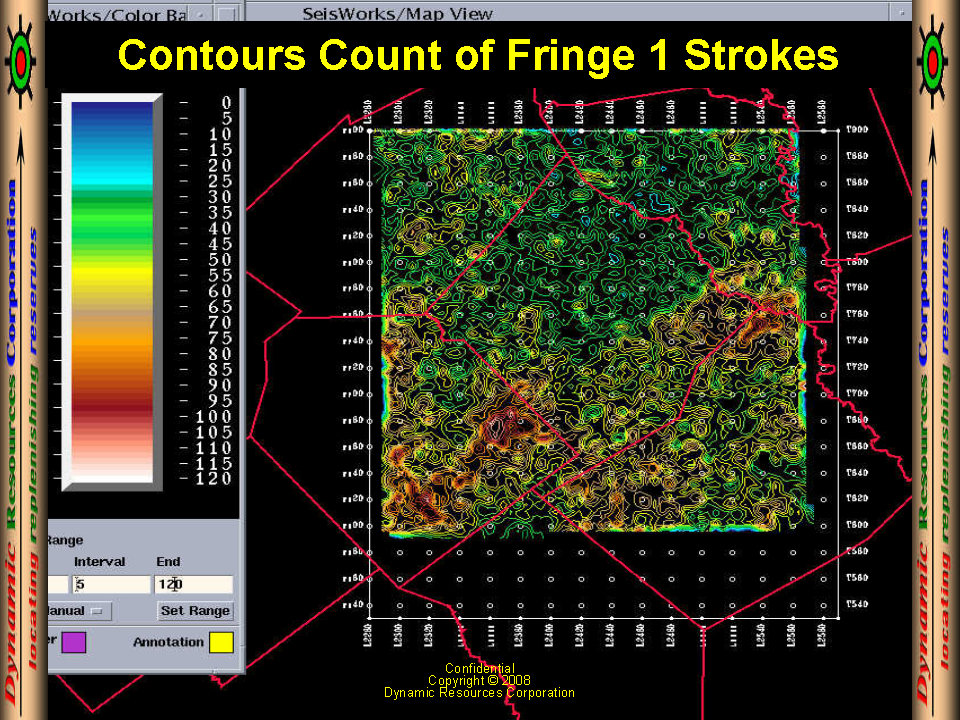
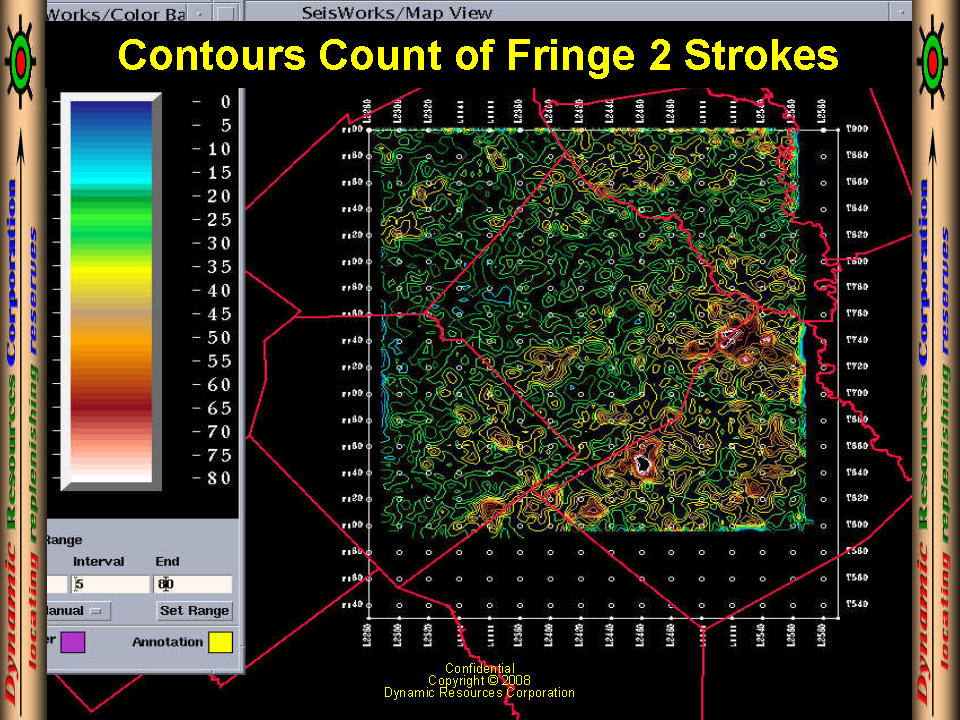
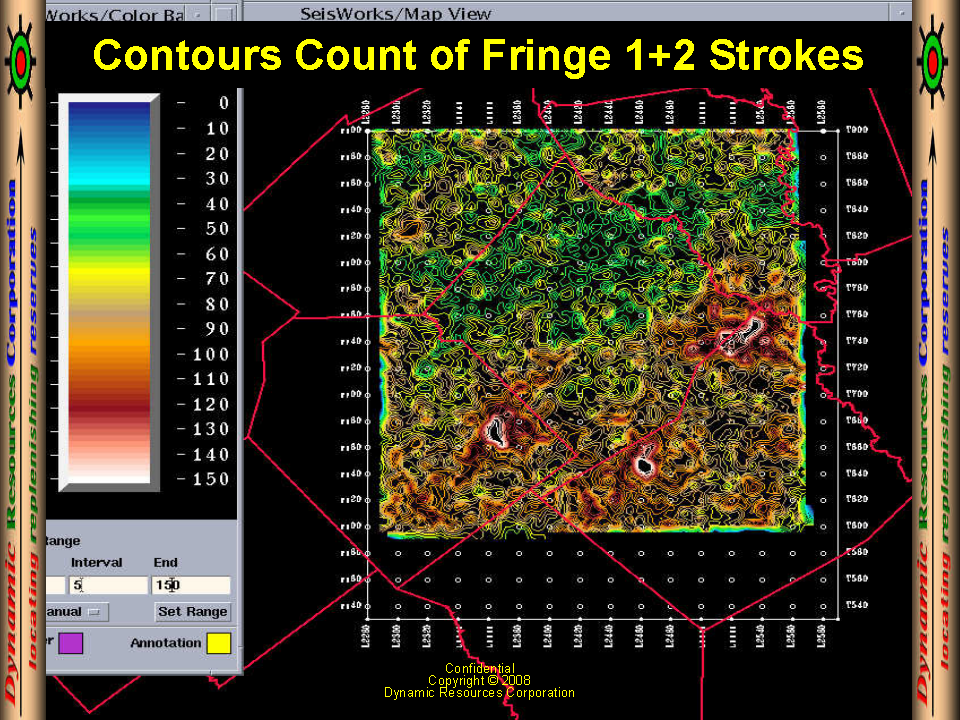
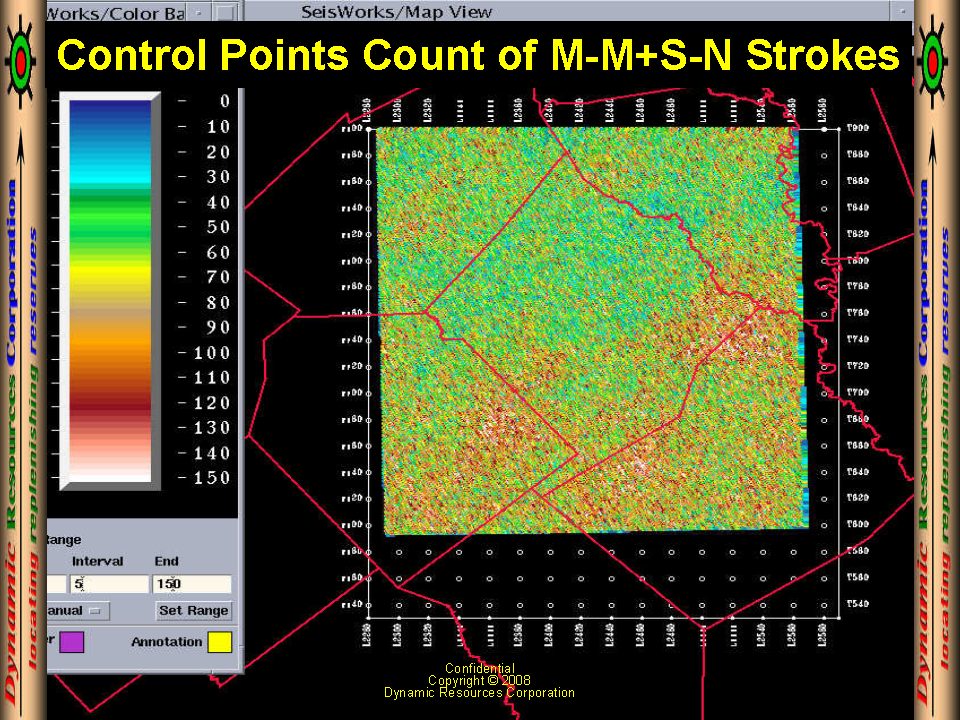
| Contours of Fringe 1+2 Strokes | Control Points of Mar-May_Sep-Nov Strokes |
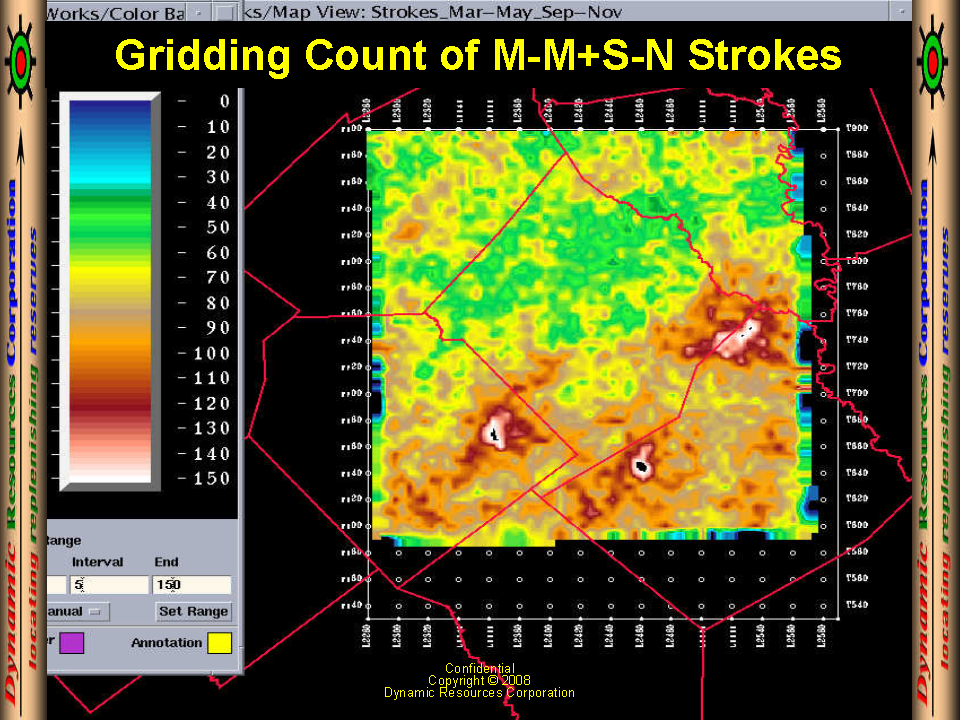
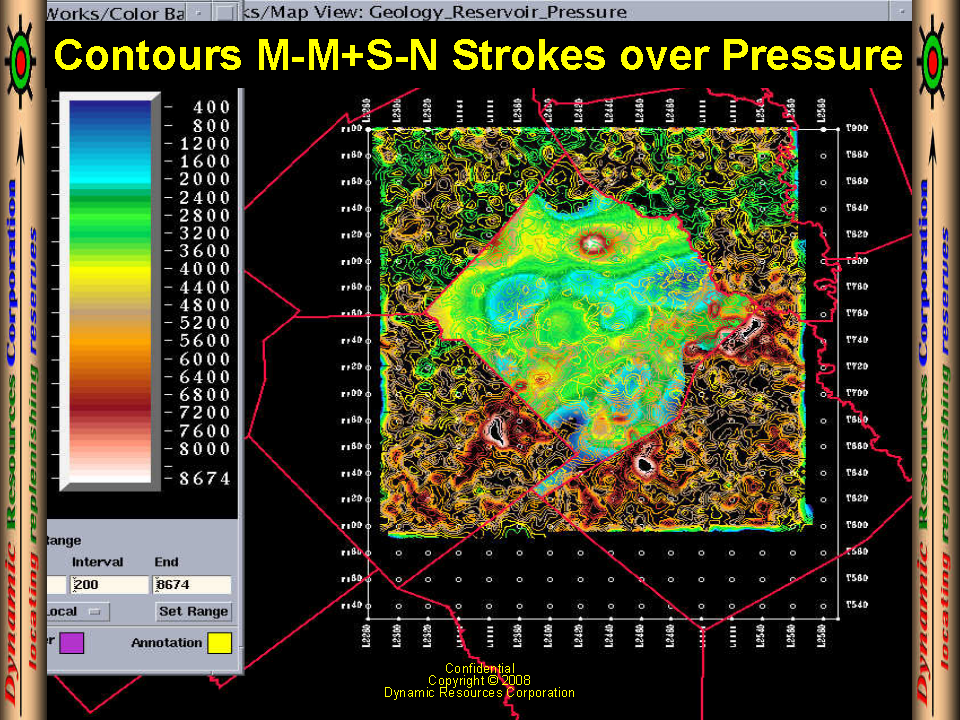
Gridding of Mar-May_Sep-Nov Strokes | Mar-May_Sep-Nov Strokes Over Pressure |
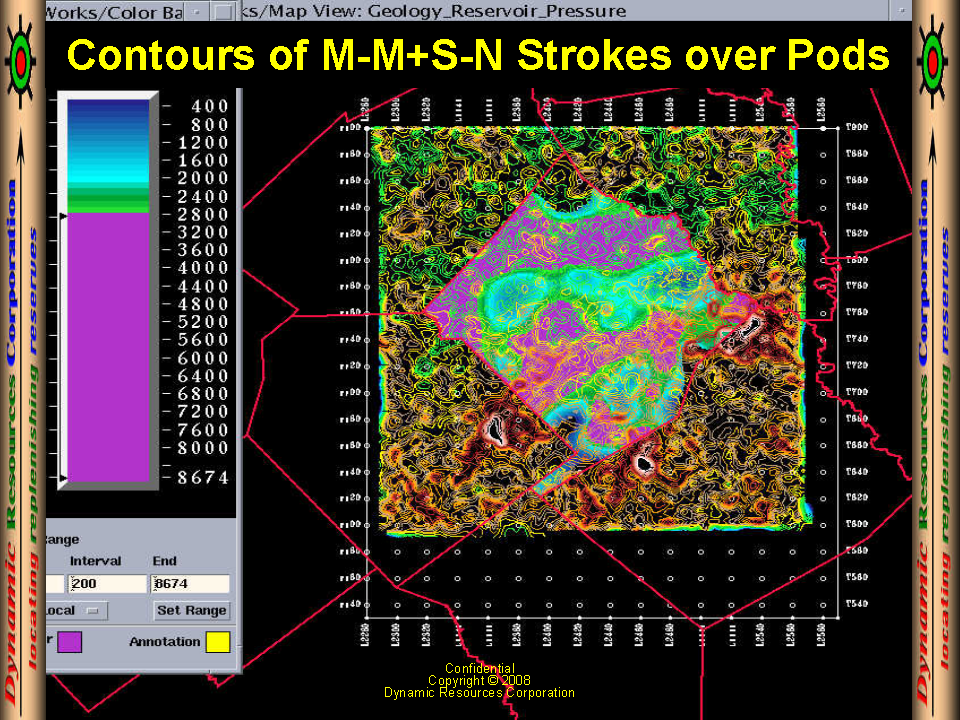
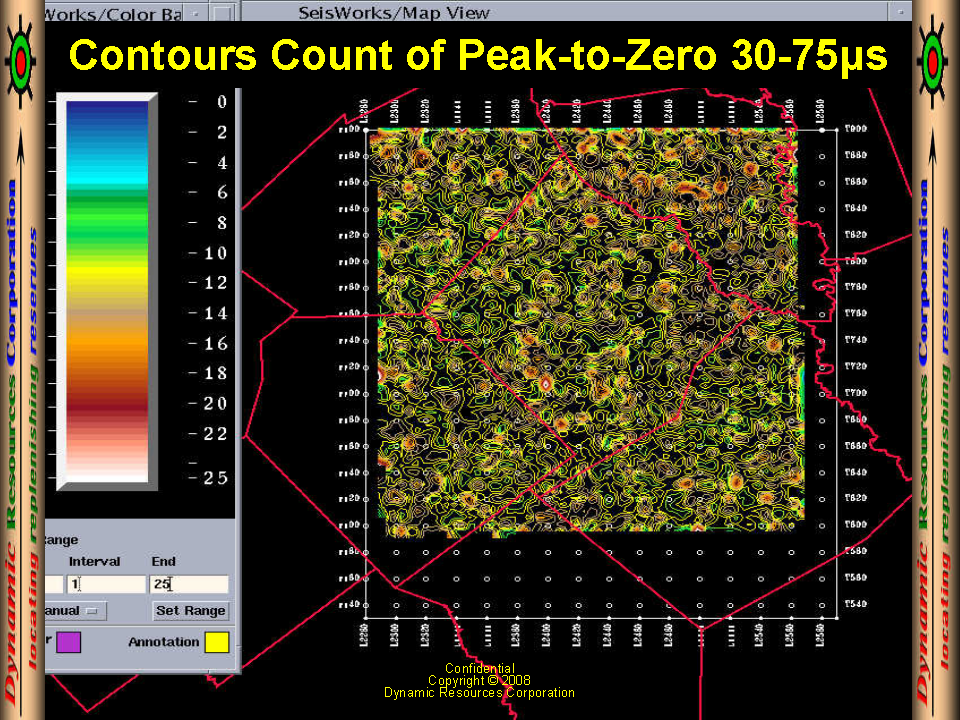
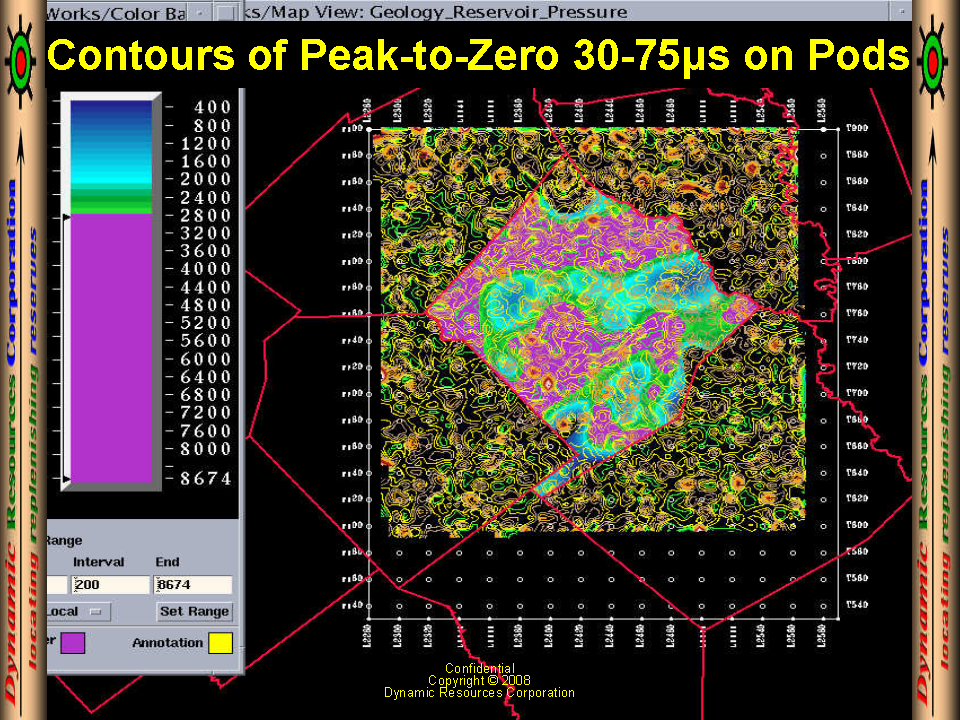
Mar-May_Sep-Nov Strokes Over Pods | Contours of Peak-to-Zero Values from 30-75µs |
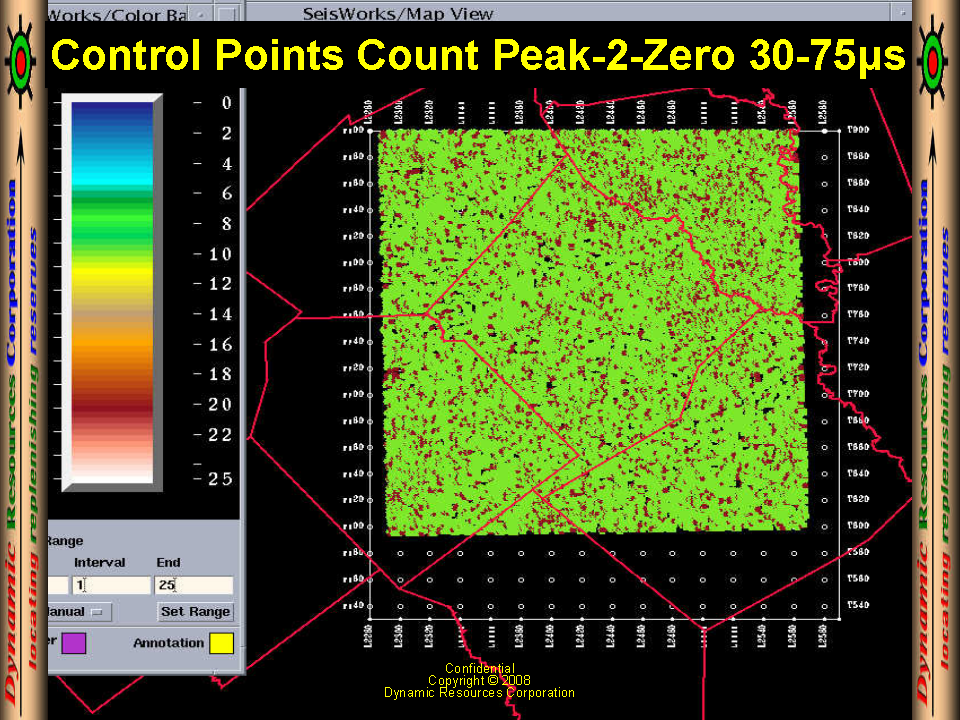
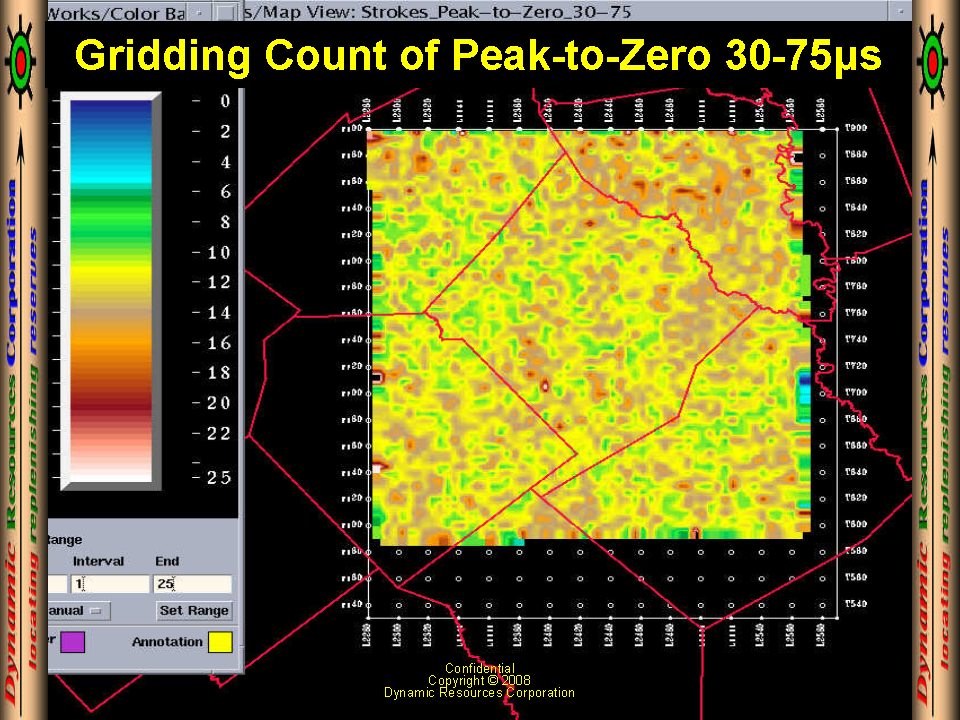
Control Points of Peak-to-Zero Values 30-75µs | Gridding of Peak-to-Zero Values from 30-75µs |
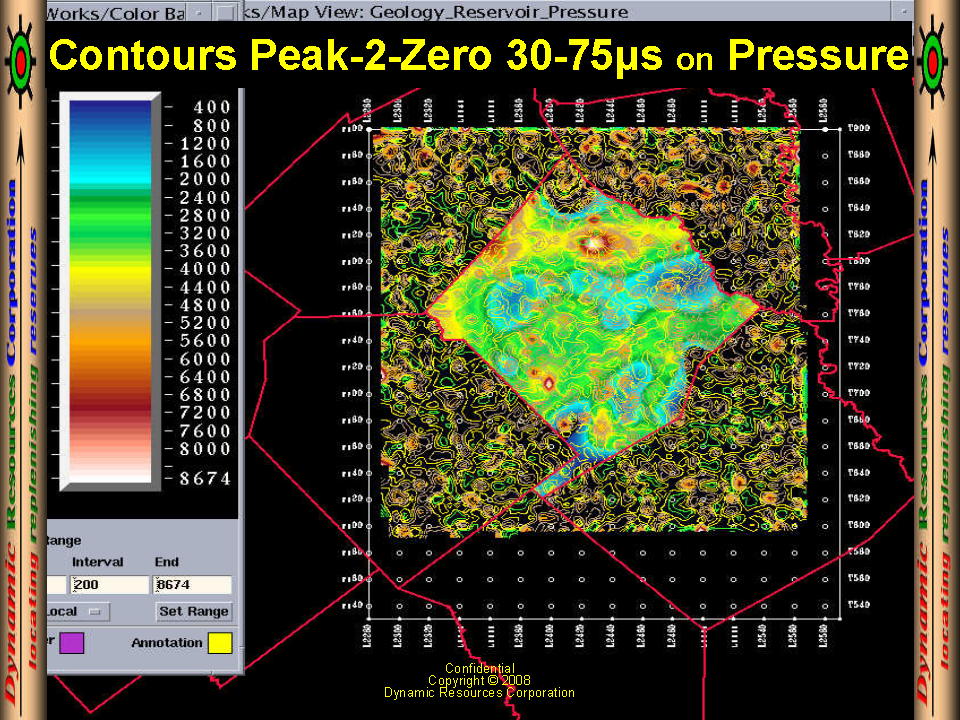
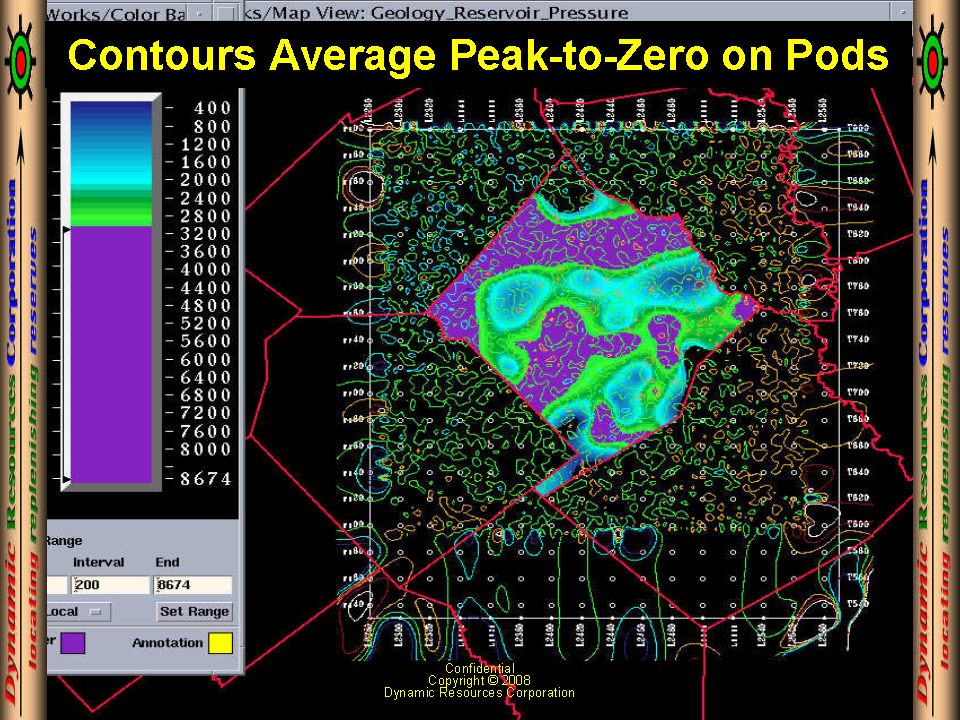
Peak-to-Zero Values 30-75µs Over Pressure | Peak-to-Zero Values from 30-75µs Over Pods |
 |  |
 |  |
 |  |
 |  |
 |  |
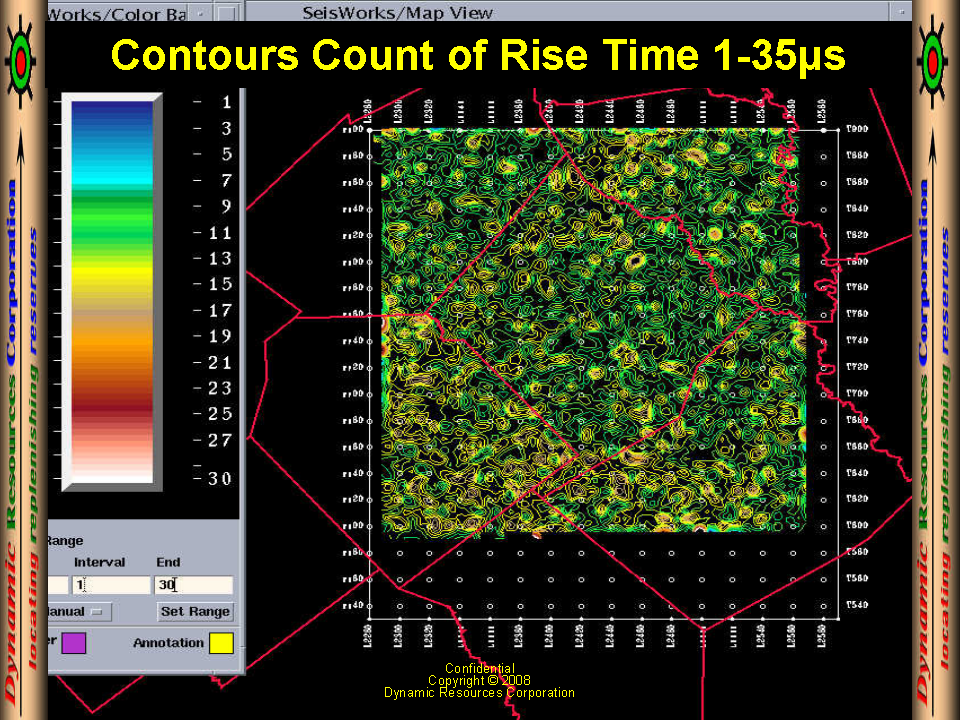
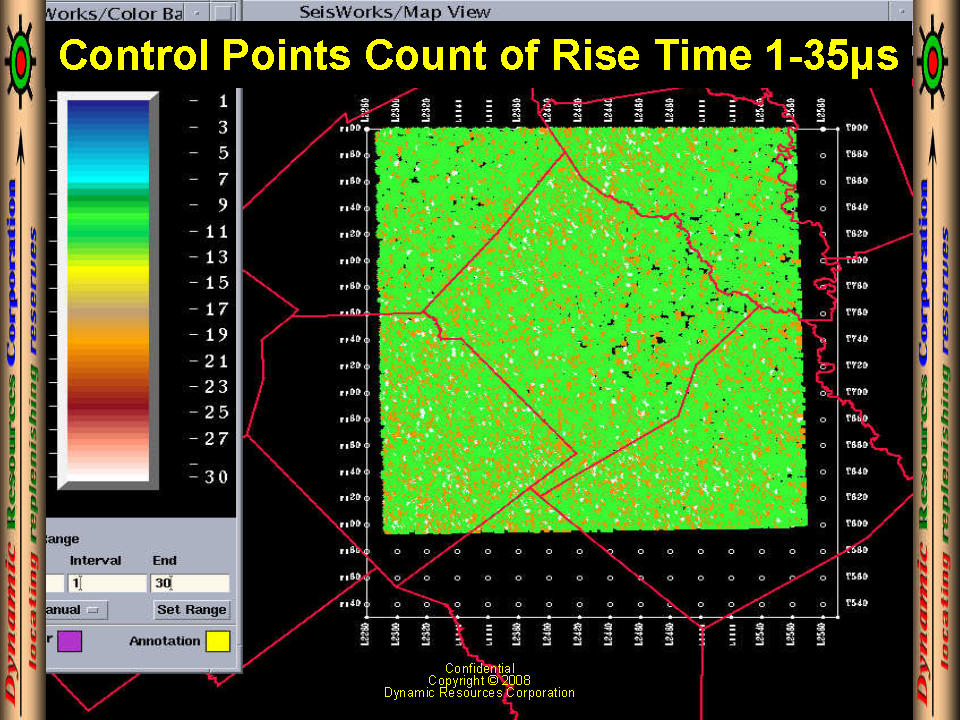
| Contours of Rise-Time Values from 1-35µs | Control Points of Rise-Time Values from 1-35µs |
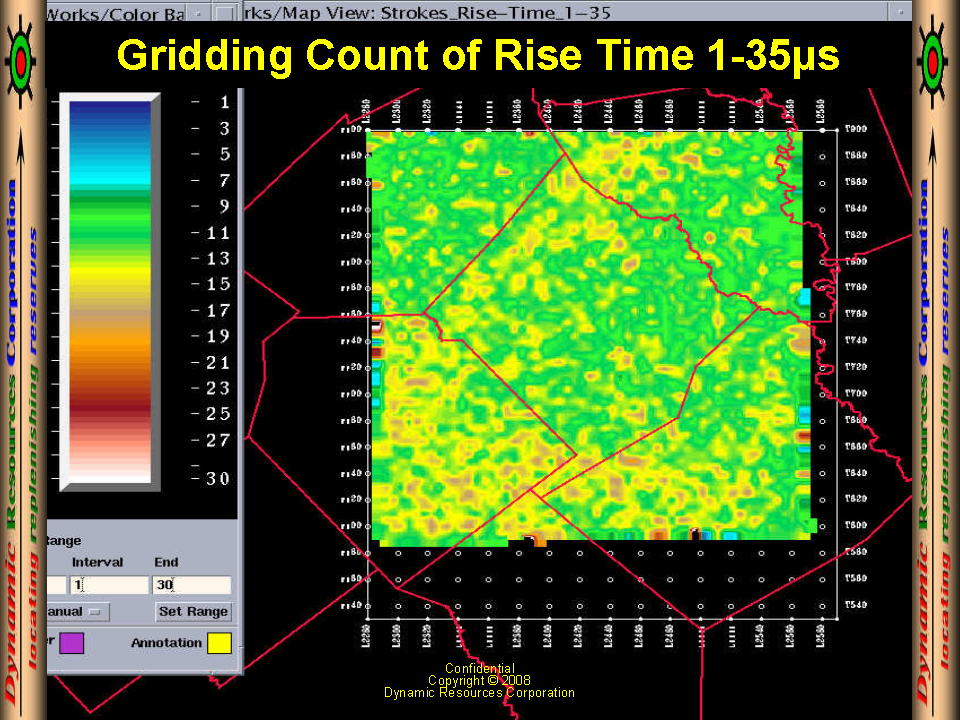
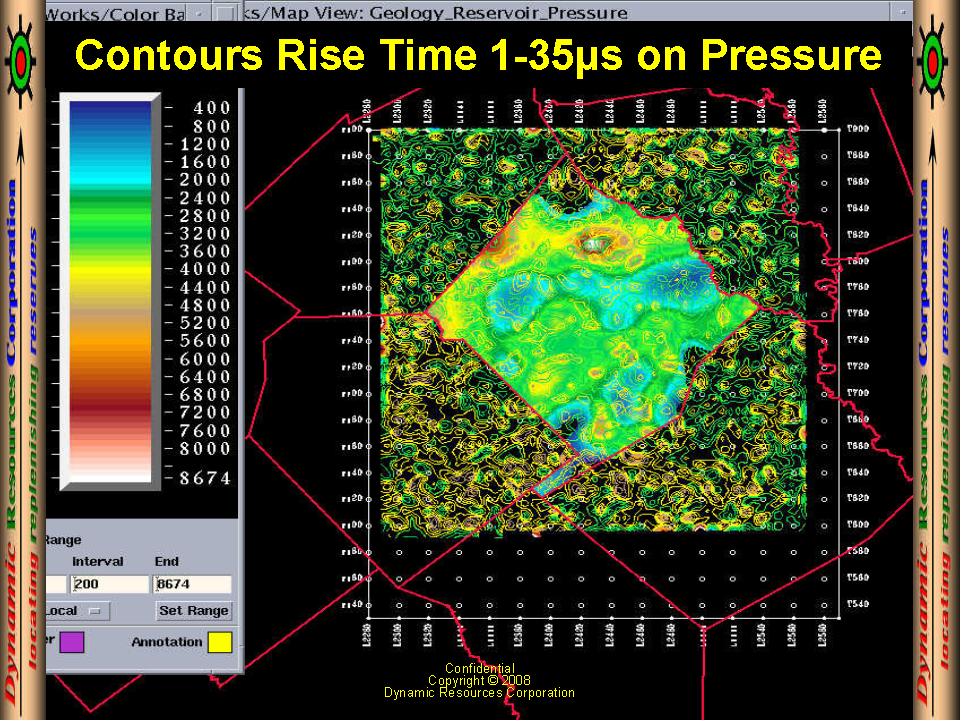
Gridding of Rise-Time Values from 1-35µs | Rise-Time Values from 1-35µs Over Pressure |
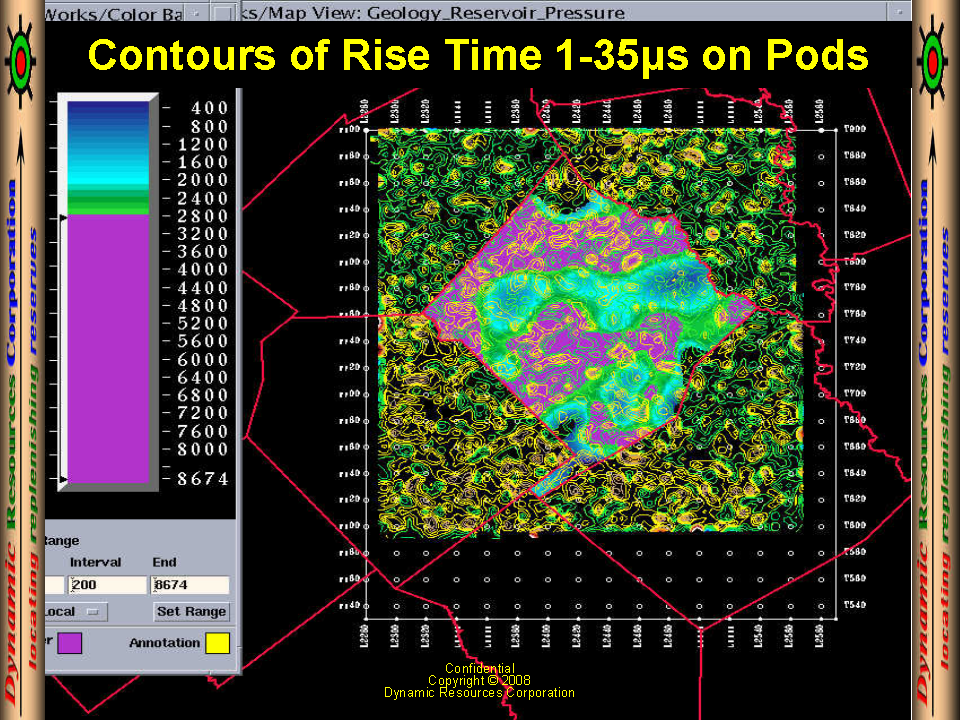
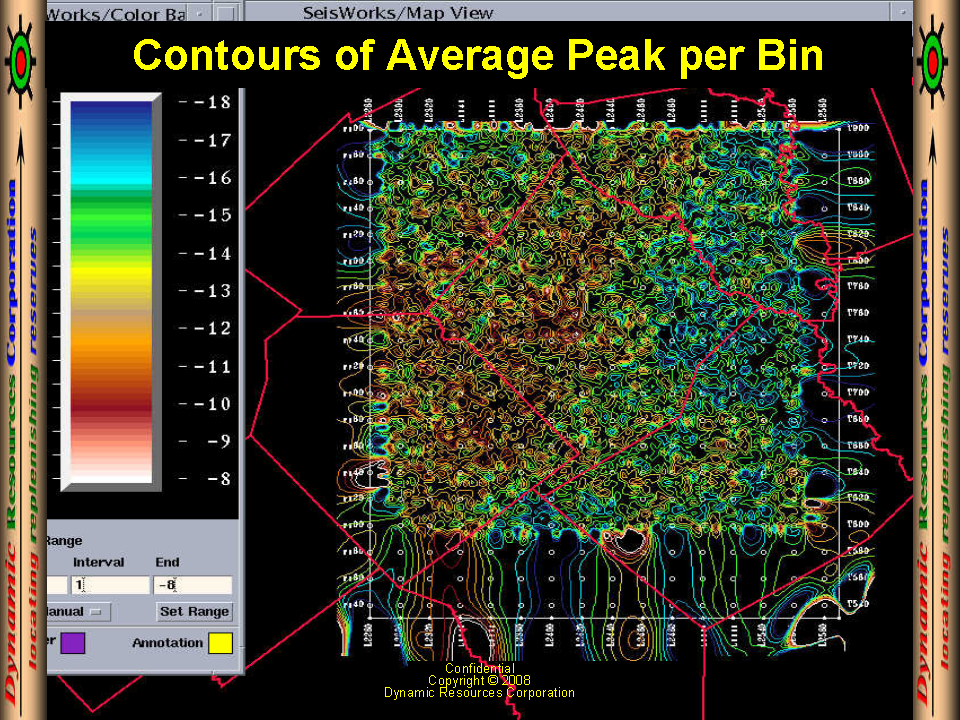
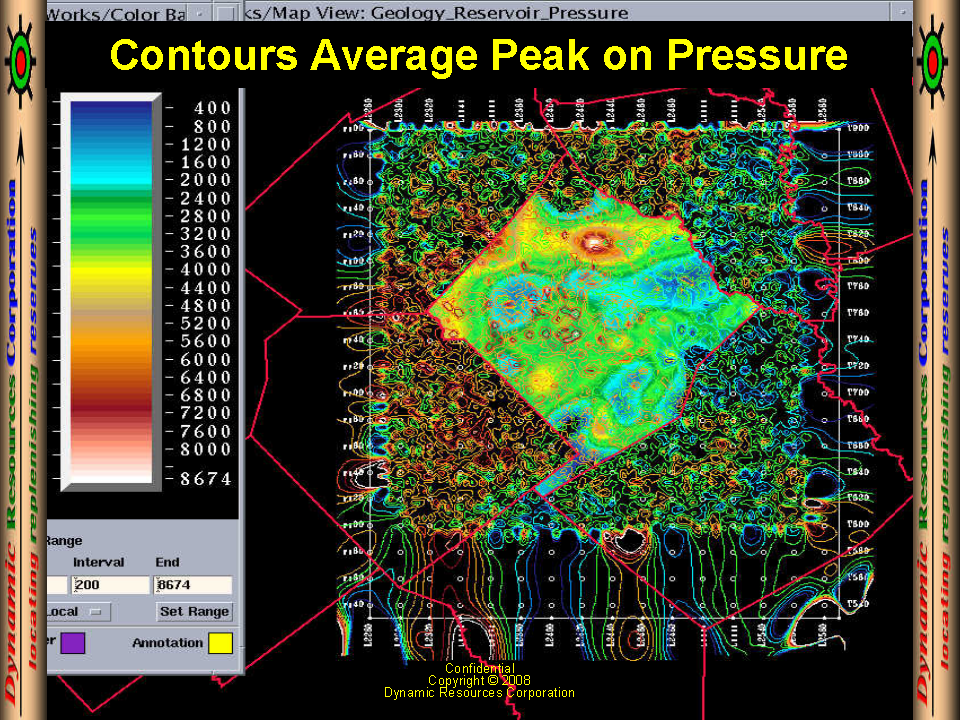
Rise-Time Values from 1-35µs Over Pods | Contours of Average Peak Per Bin |
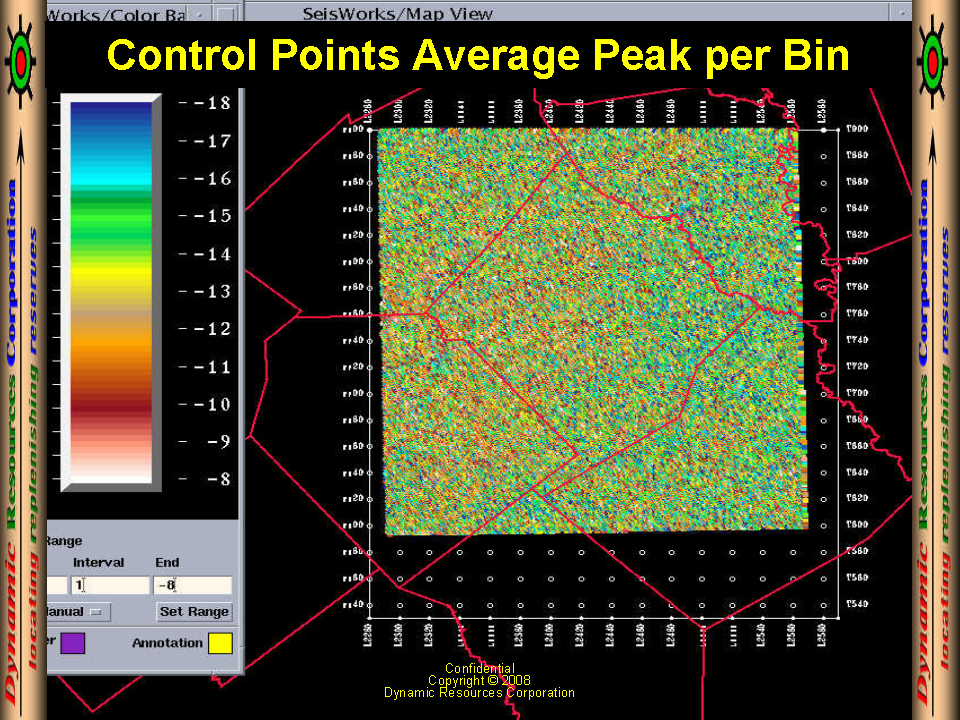
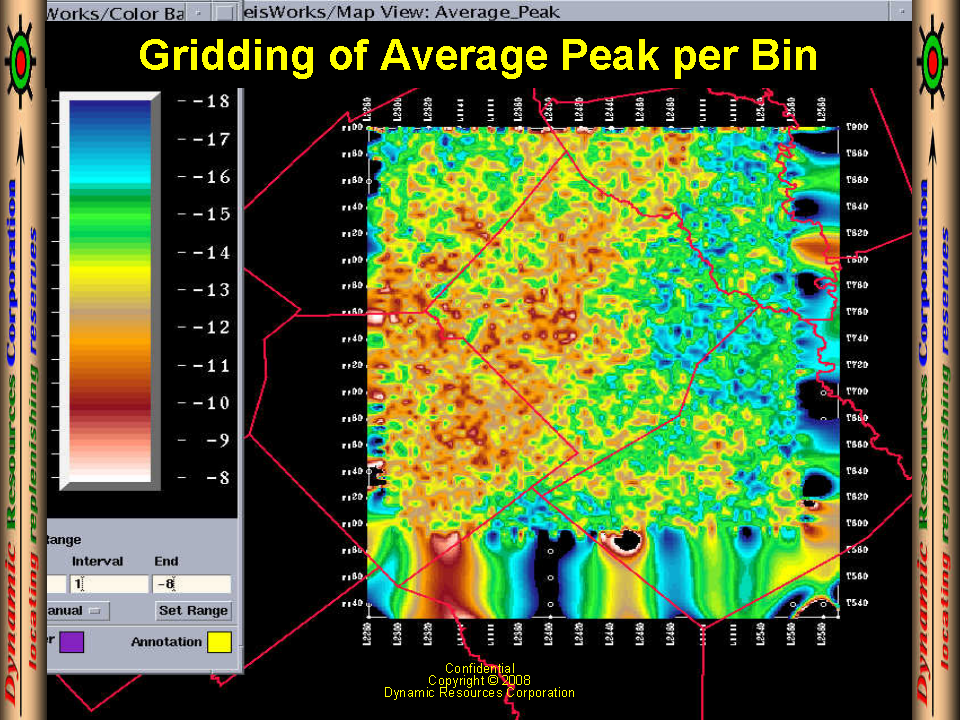
Control Points of Average Peak Per Bin | Gridding of Average Peak Per Bin |
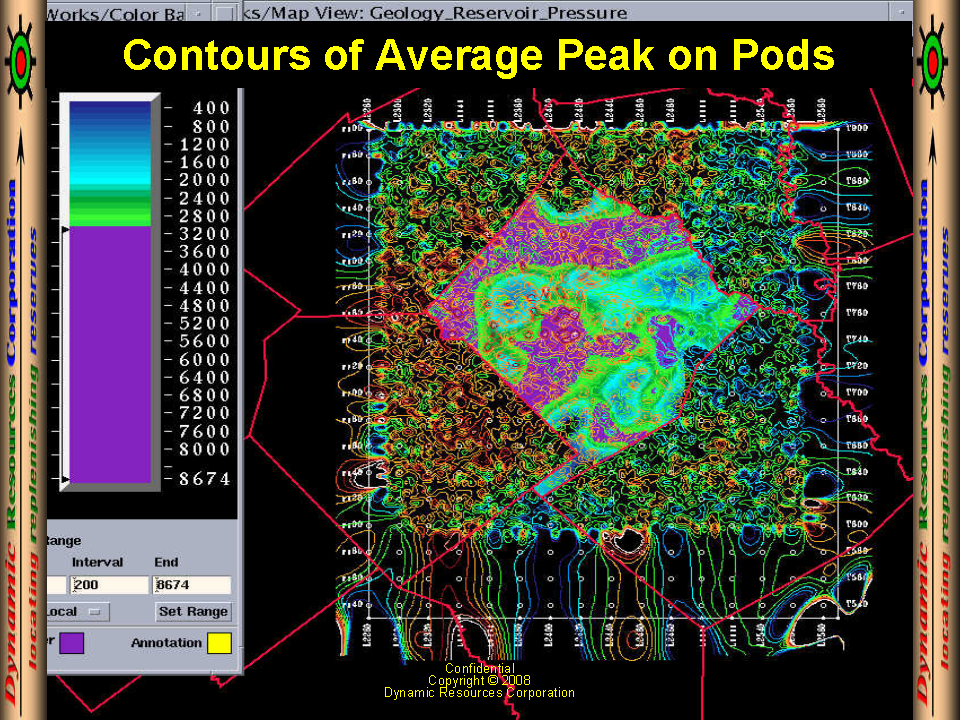
Average Peak Per Bin Over Pressure Map | Average Peak Per Bin Over Pods Map |
 |  |
 |  |
 |  |
 |  |
 |  |
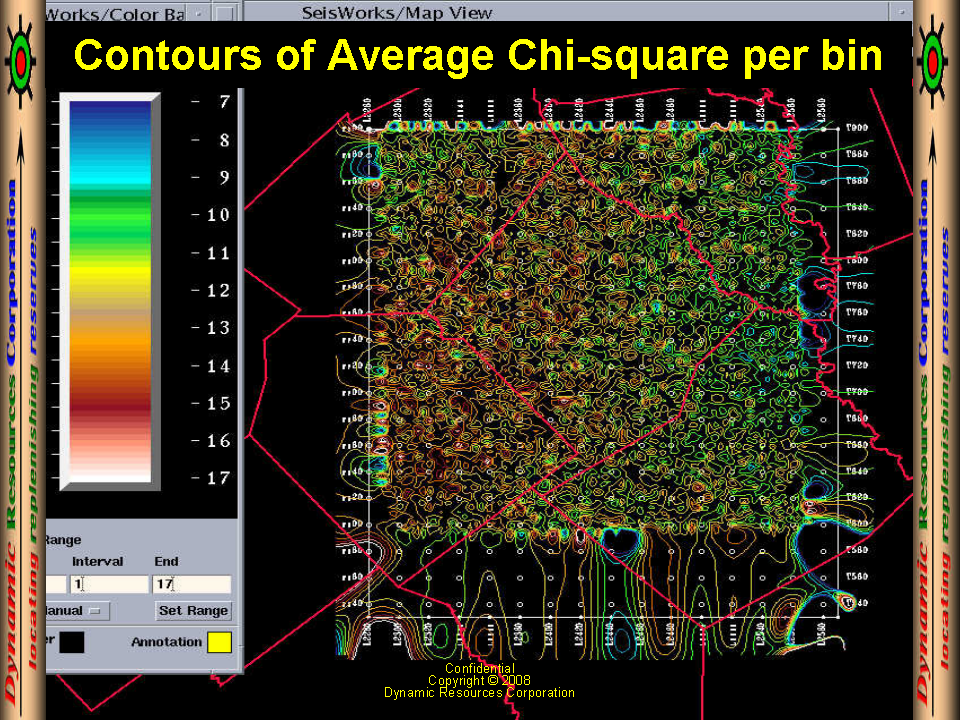
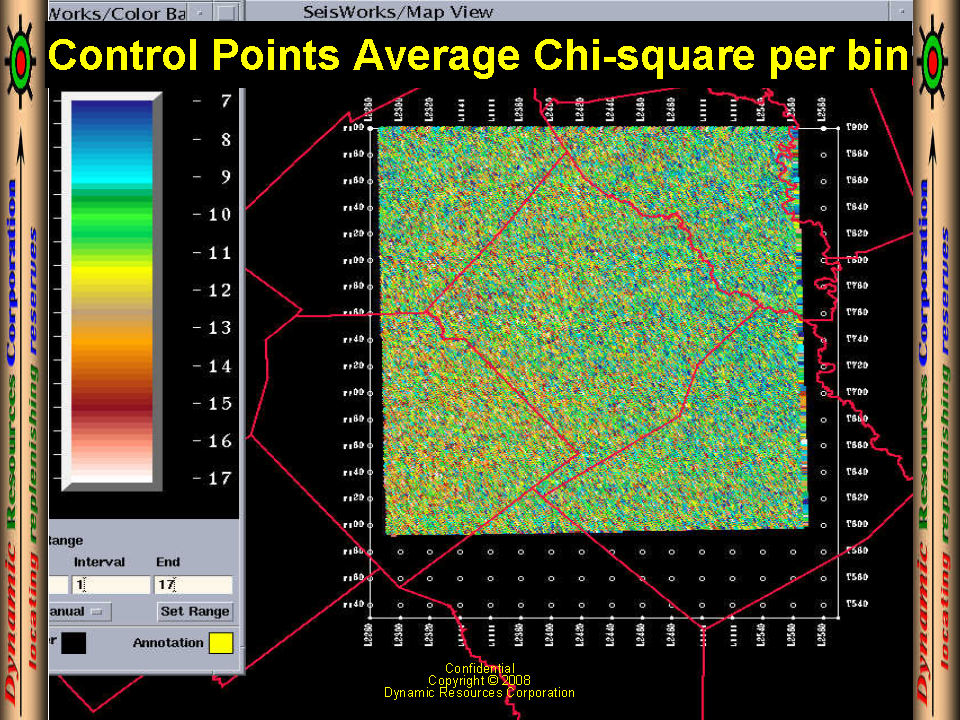
| Contours of Avg Chi2 per Bin | Control Points of Avg Chi2 per Bin |
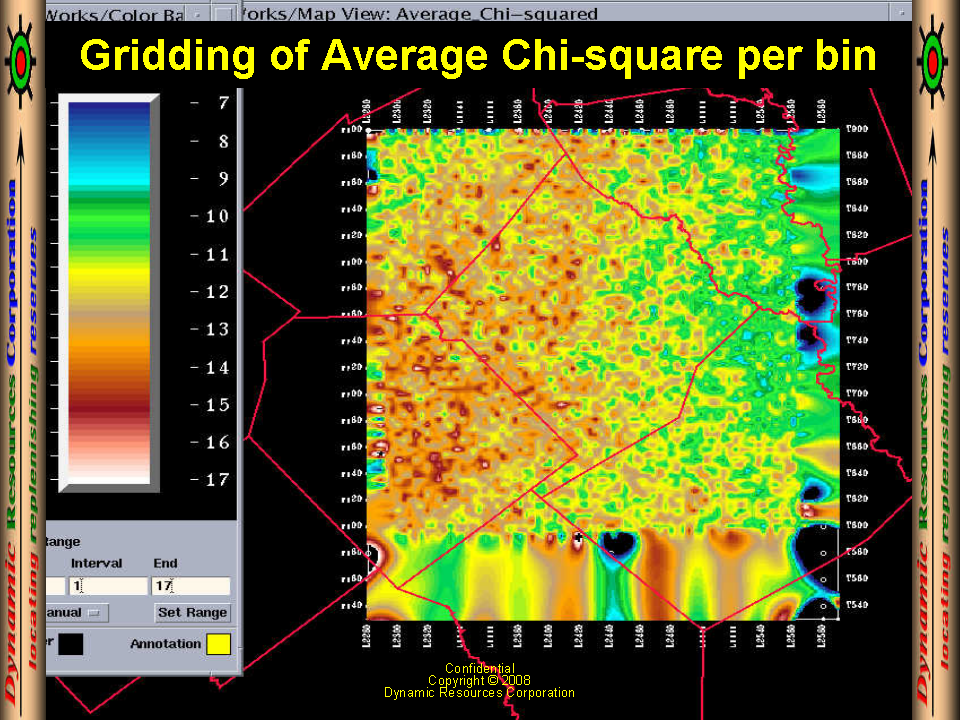
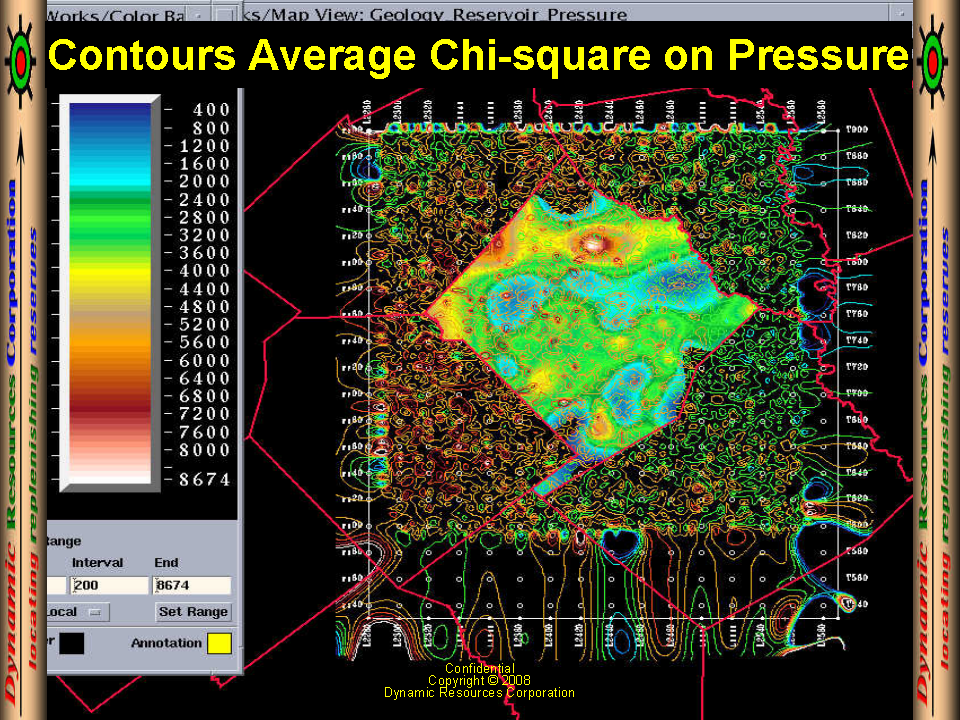
Gridding of Avg Chi2 per Bin | Average Chi2 per Bin Over Pressure |
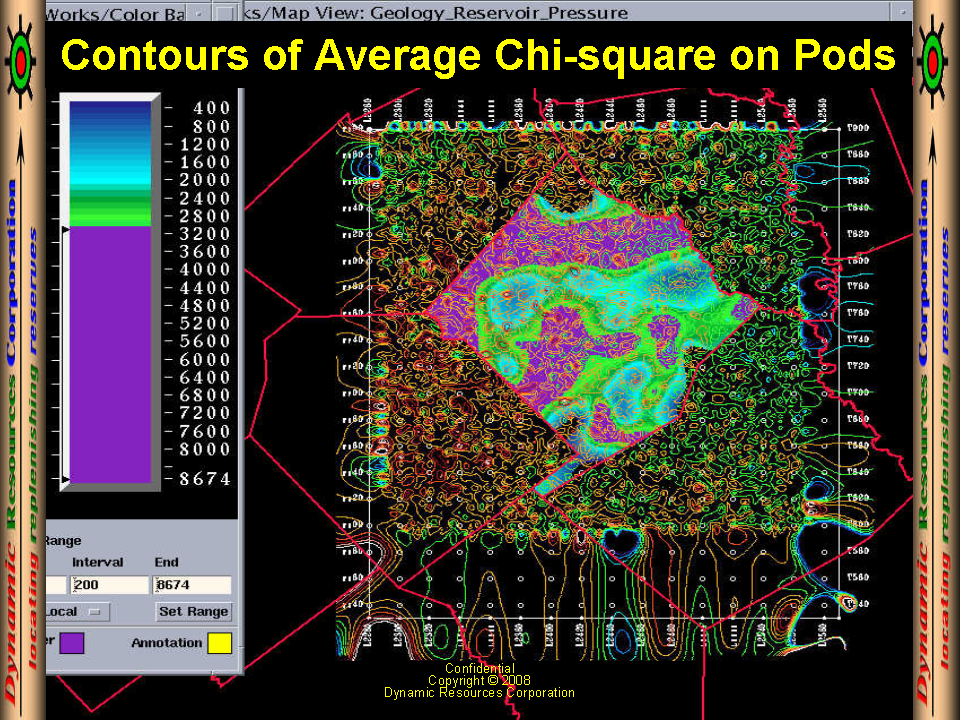
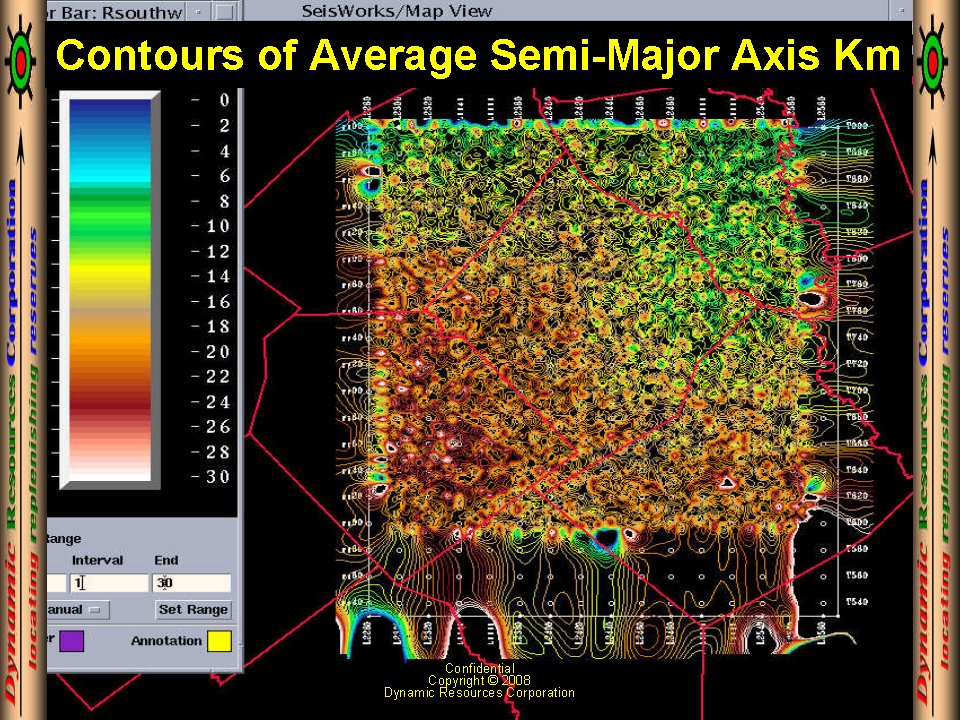
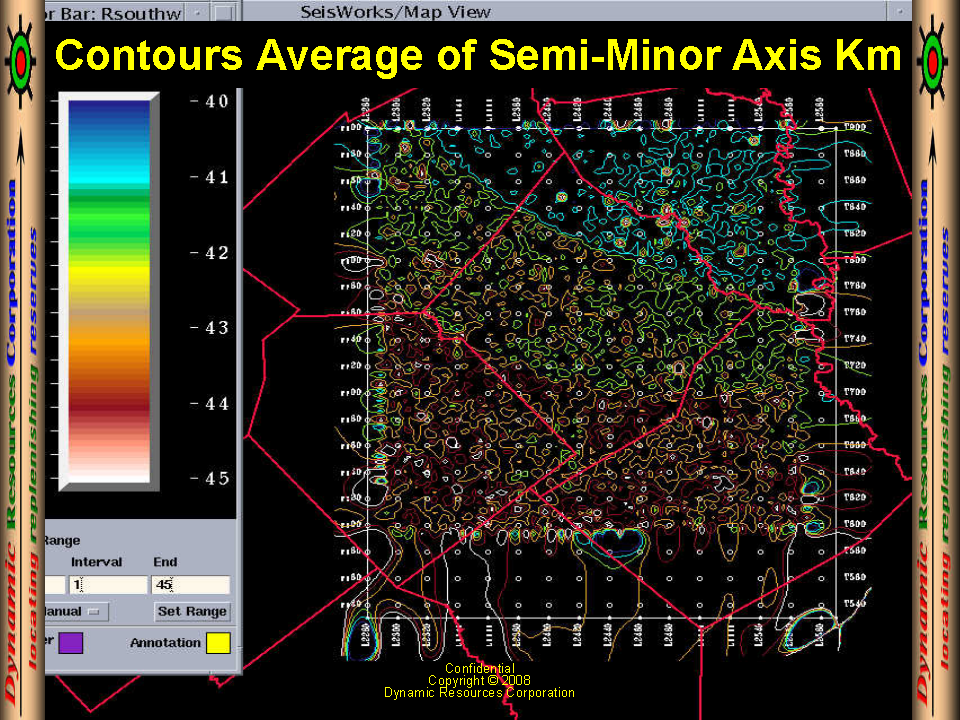
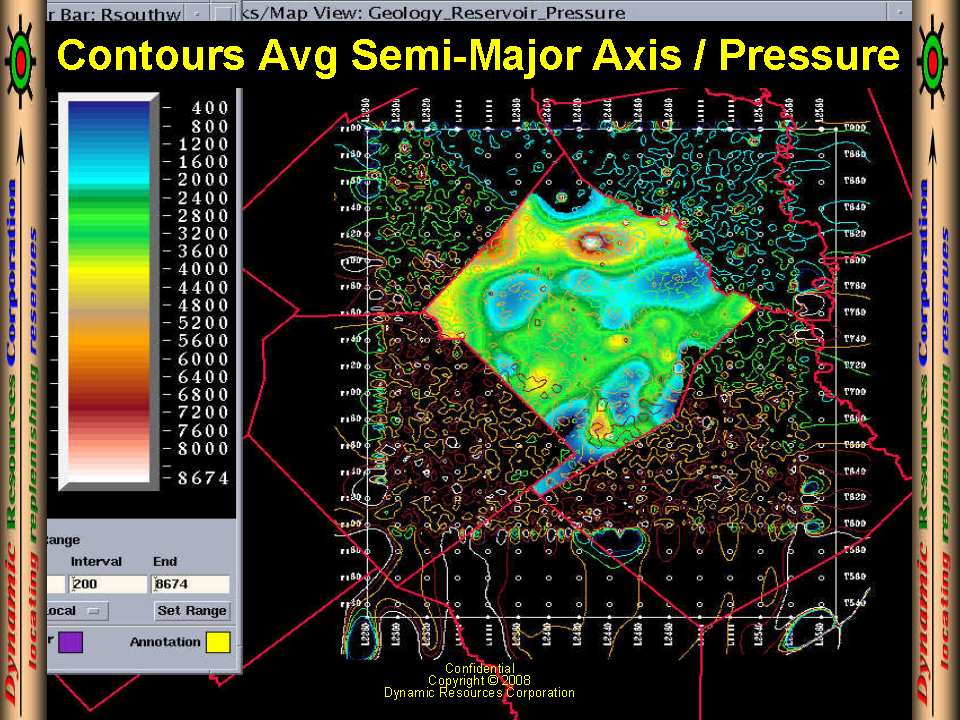
Average Chi2 per Bin Over Pods | Contours of Semi-Major Axis (km) |
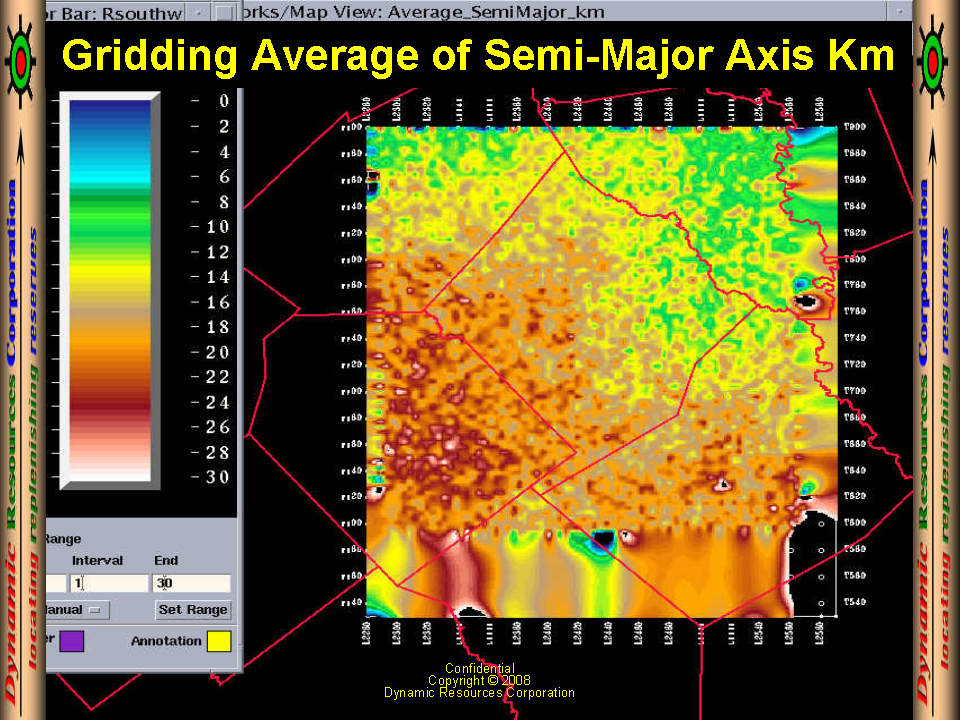
Control Points of Semi-Major Axis | Gridding of Semi-Major Axis (km) |
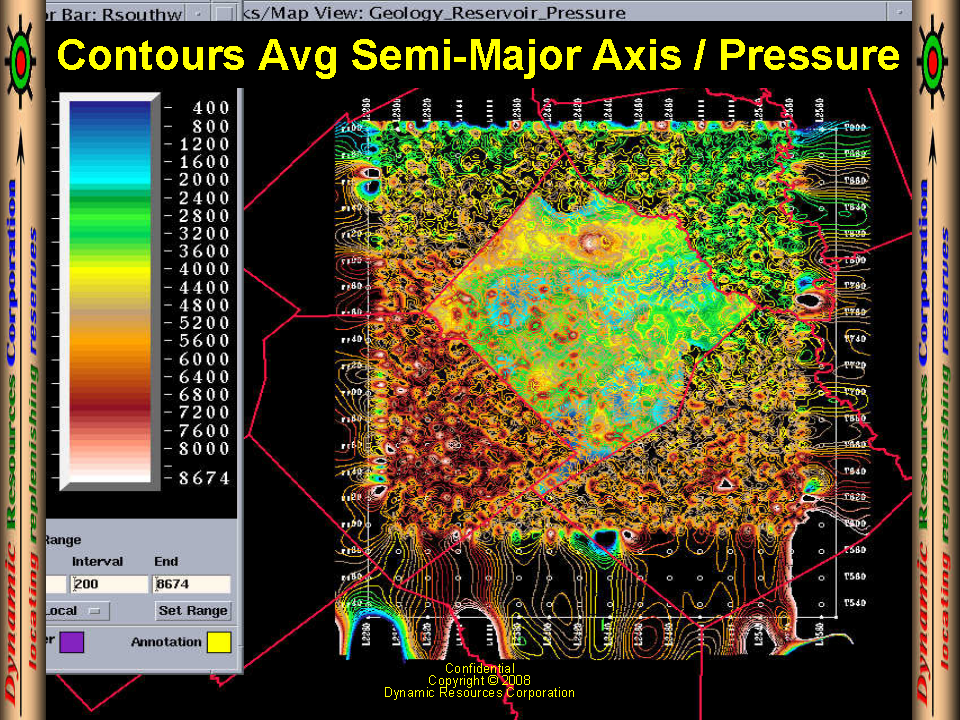
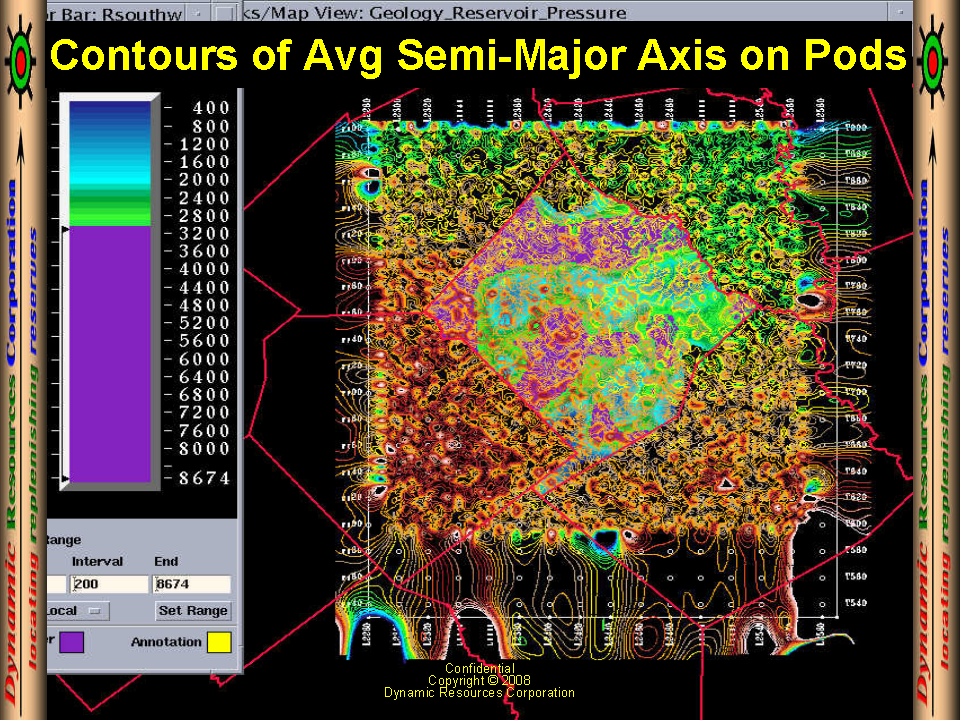
Semi-Major Axis (km) on Pressure | Semi-Major Axis (km) Over Pods |
 |  |
 |  |
 |  |
 |  |
 |  |
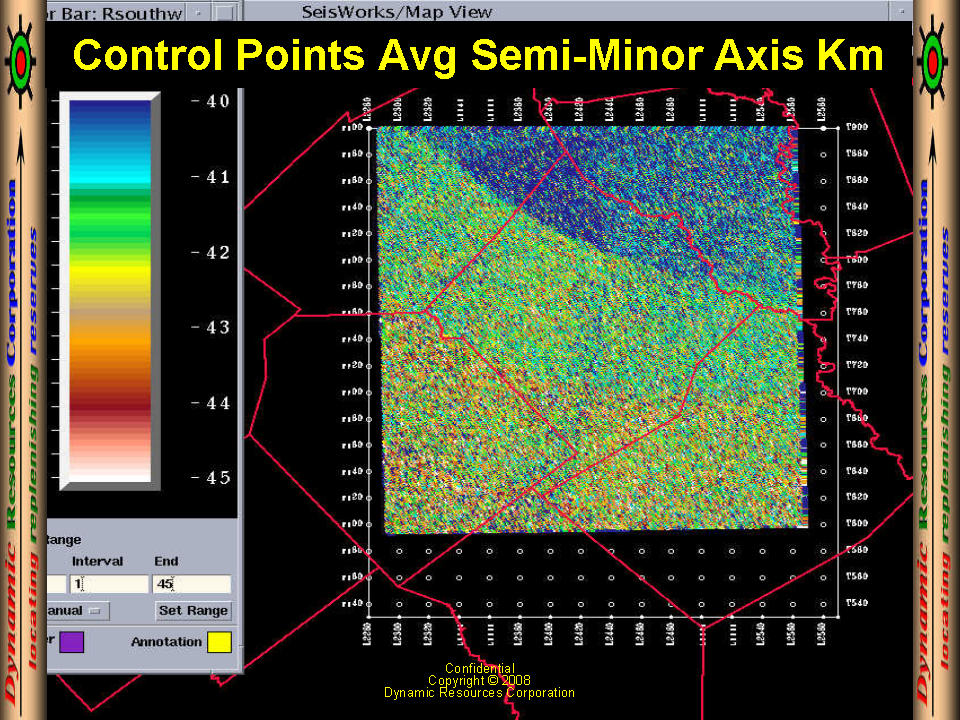
| Contours of Semi-Minor Axis (km) | Control Points of Semi-Minor Axis |
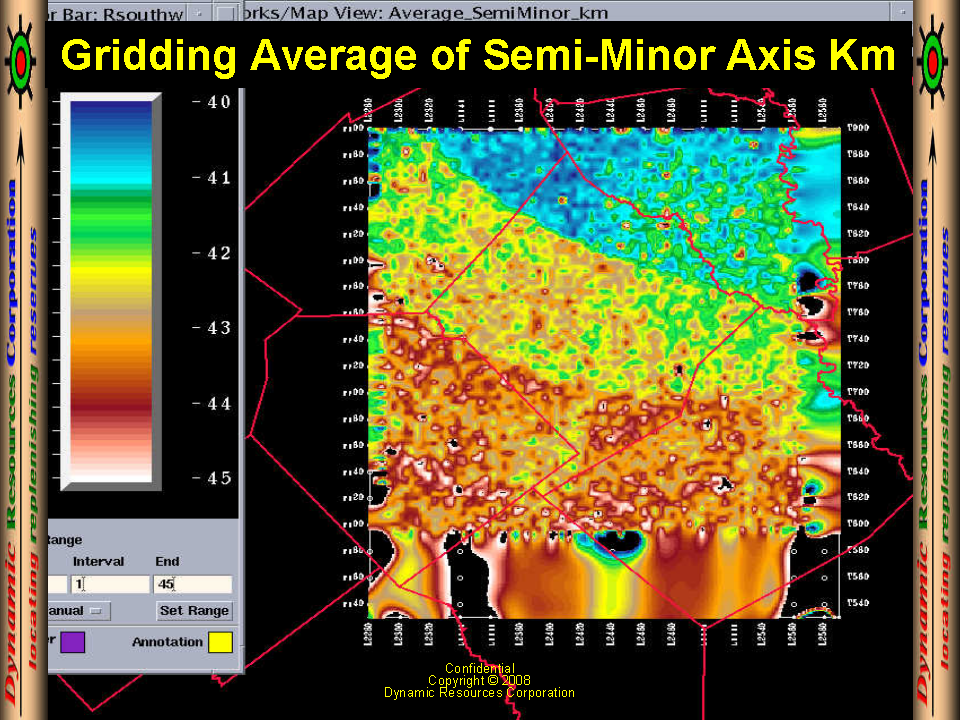
Gridding of Semi-Minor Axis (km) | Semi-Minor Axis (km) on Pressure |
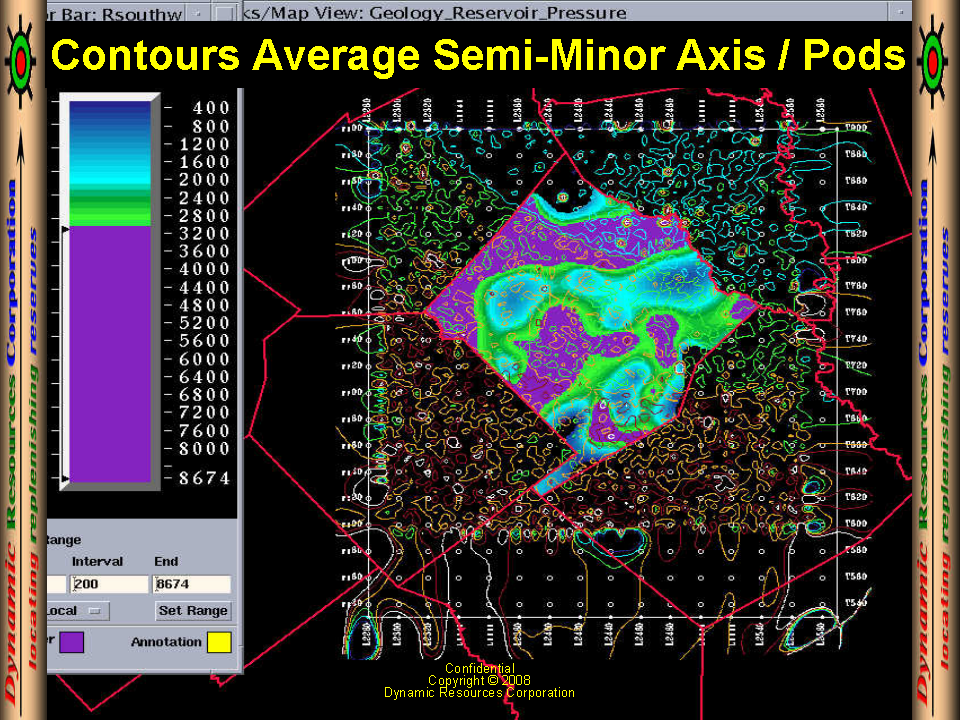
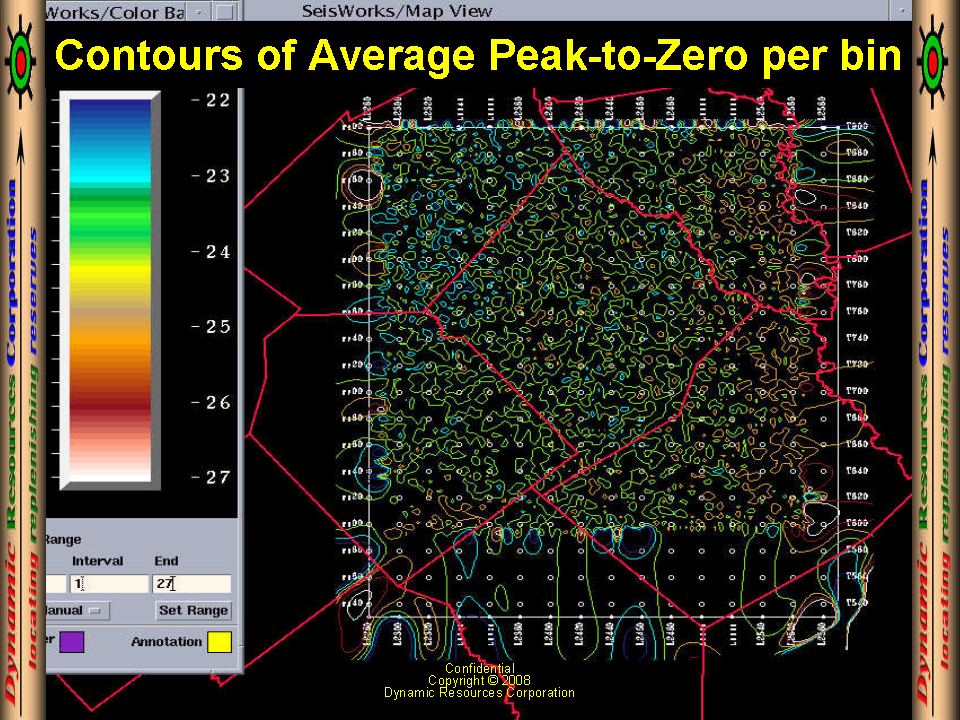
Semi-Minor Axis (km) Over Pods | Contours of Peak-to-Zero |
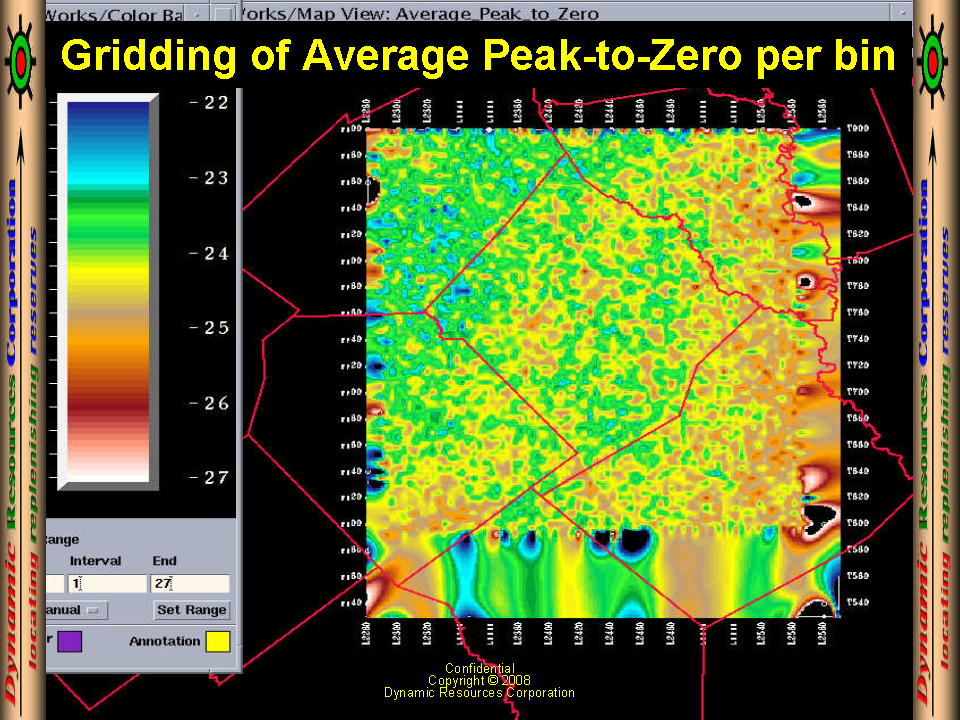
Control Points of Peak-to-Zero | Gridding of Peak-to-Zero |
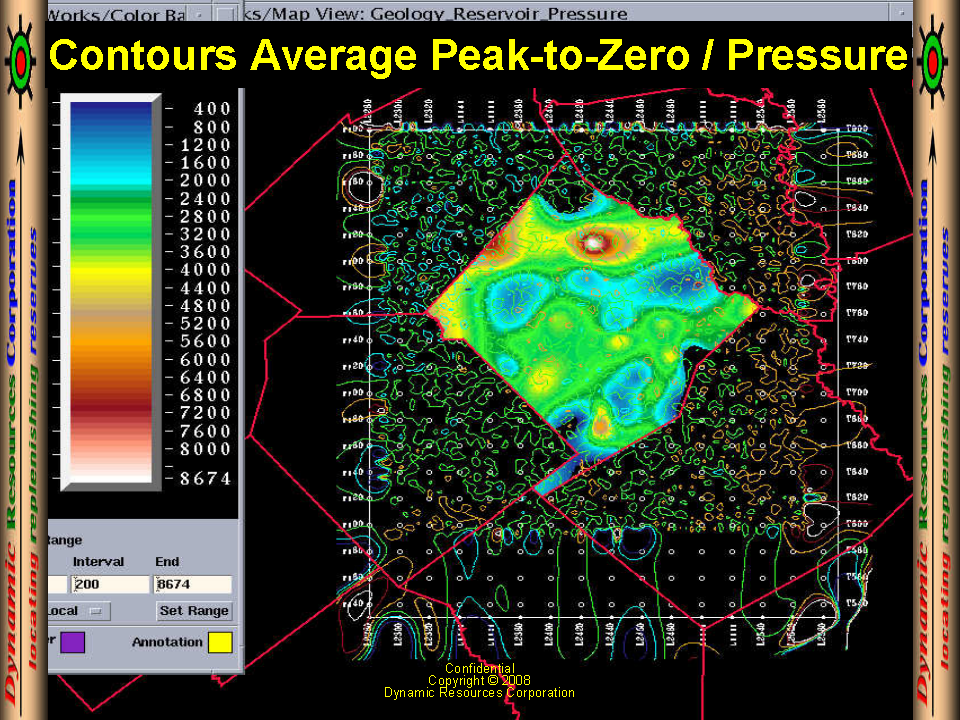
Peak-to-Zero Over Pressure | Peak-to-Zero Over Pods |
 |  |
 |  |
 |  |
 |  |
 |  |
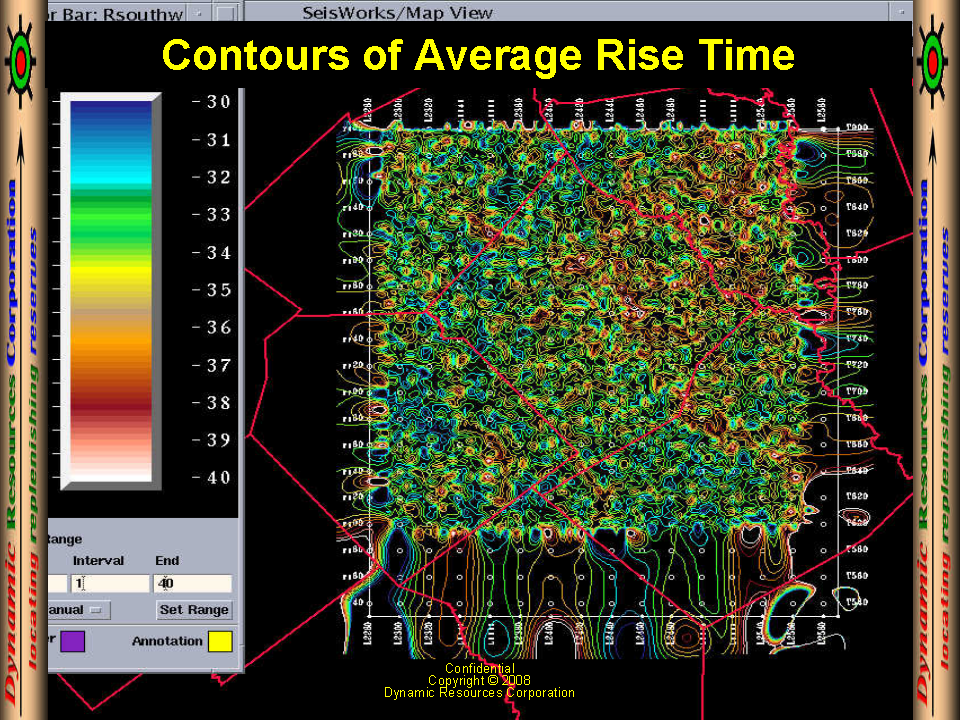
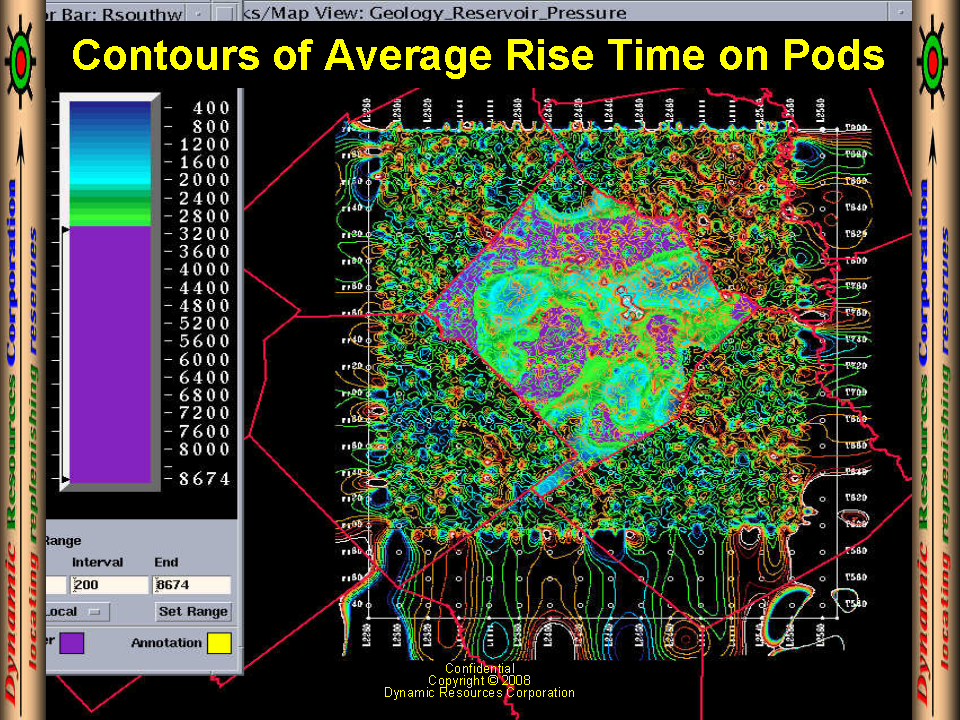
| Contours of Avg Rise-Time | Control Points of Avg Rise-Time |
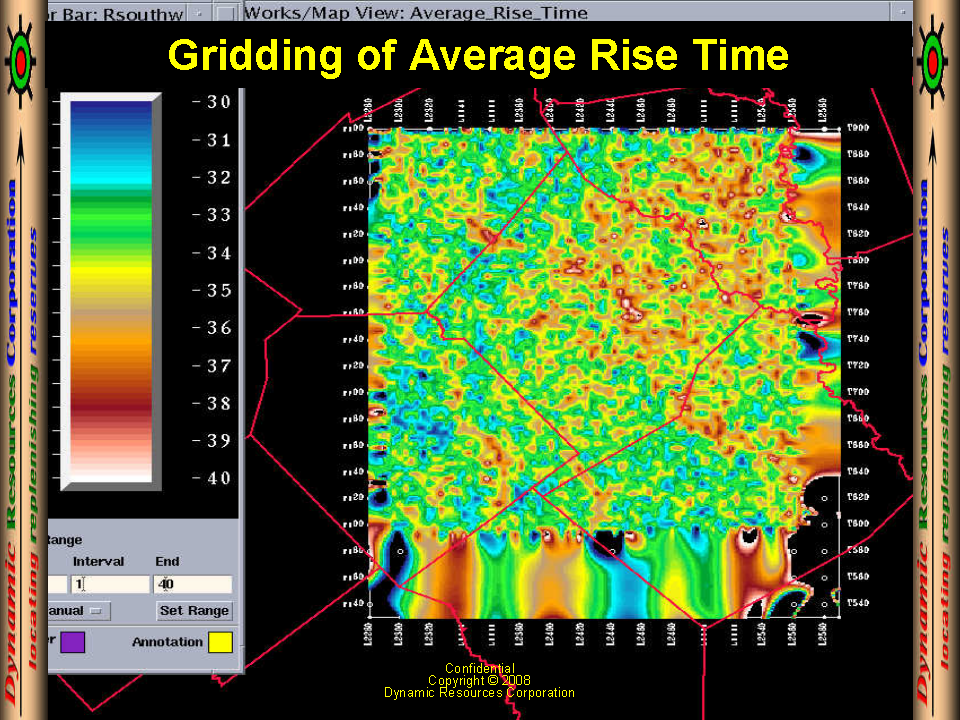
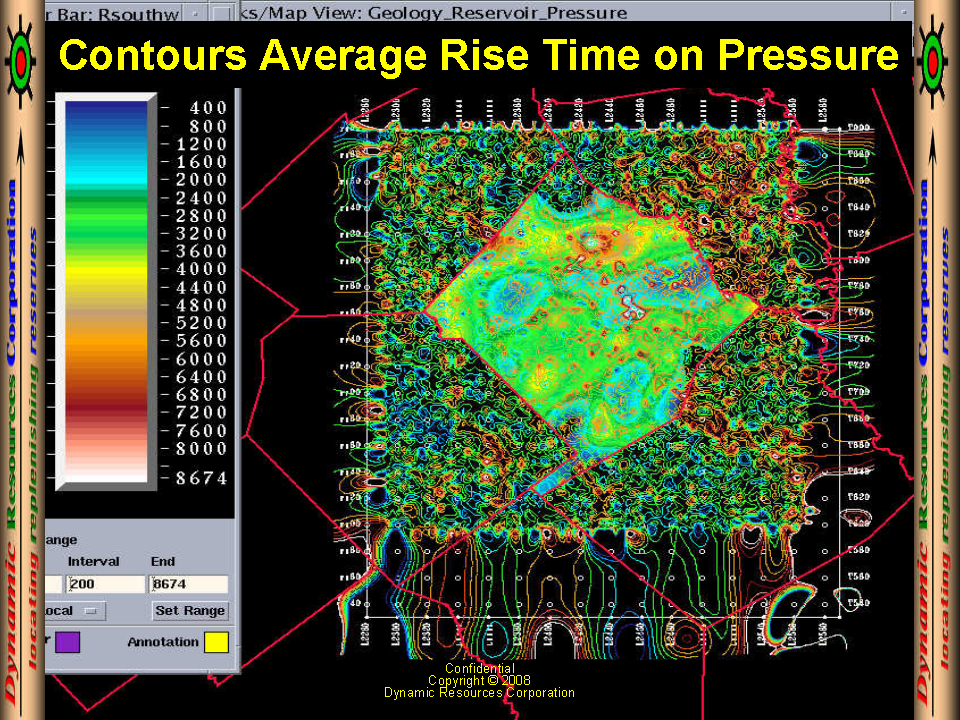
Gridding of Avg Rise-Time | Avg Rise-Time Over Pressure |
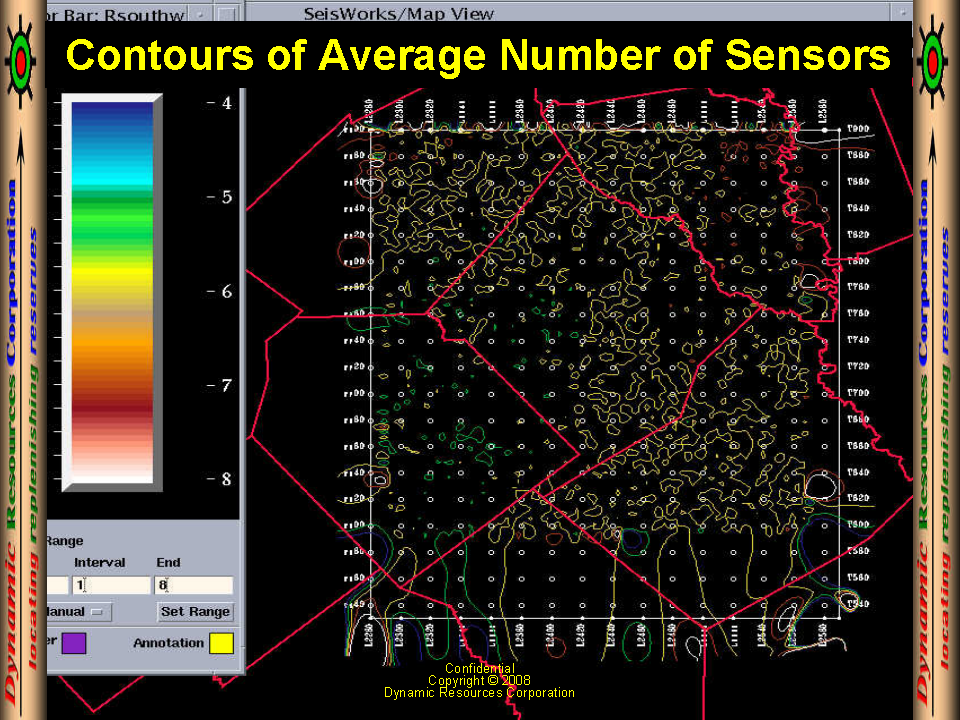
Avg Rise-Time Over Pods | Contours of # of Sensors |
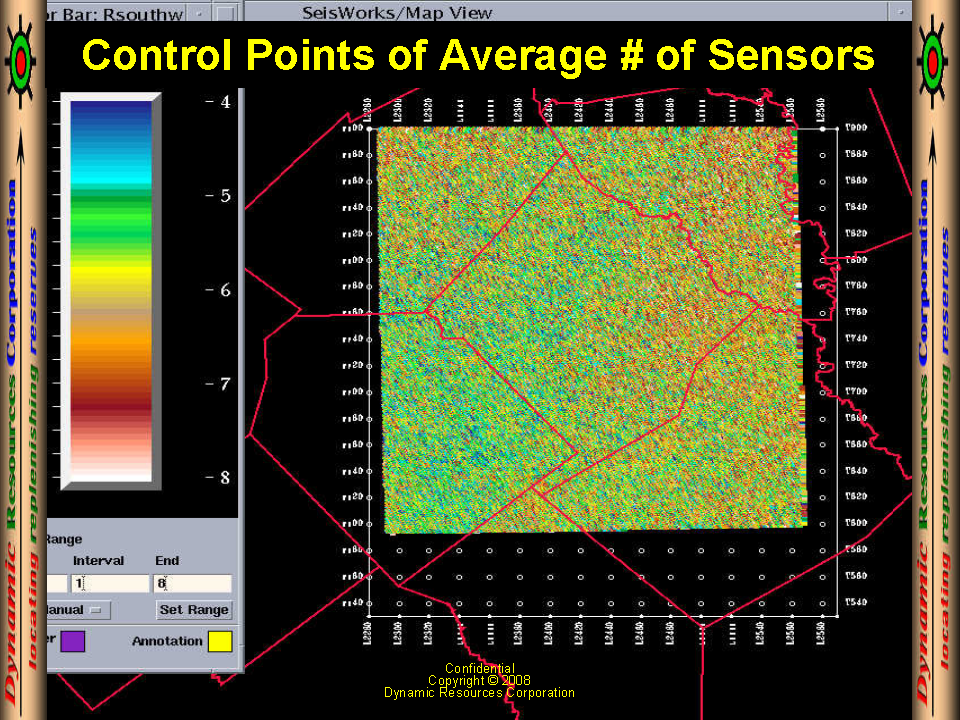
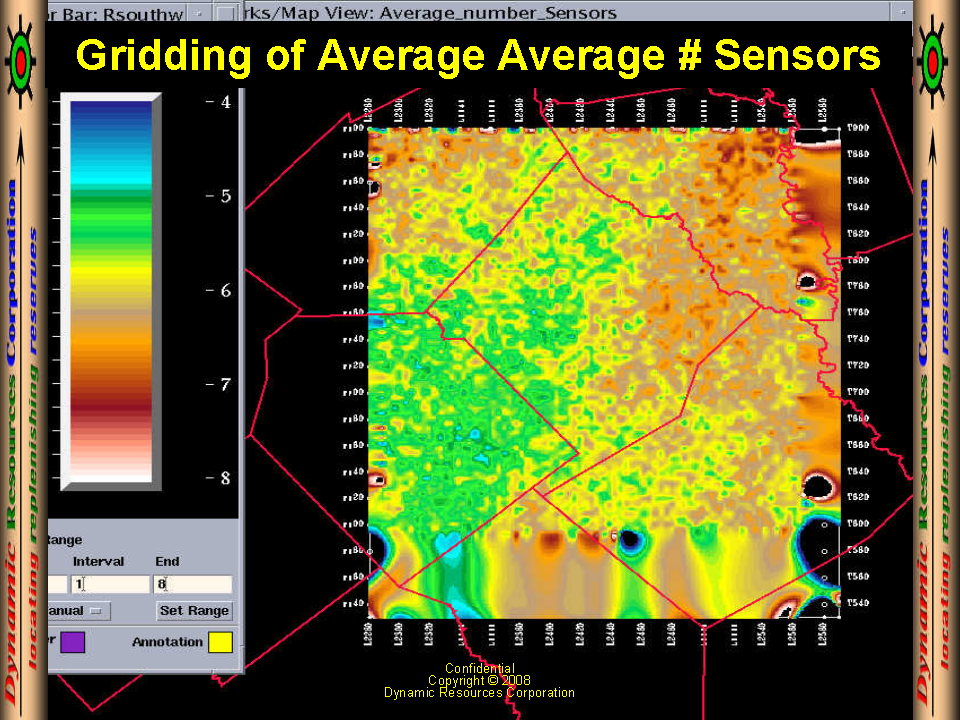
Control Points of # of Sensors | Gridding of # of Sensors |
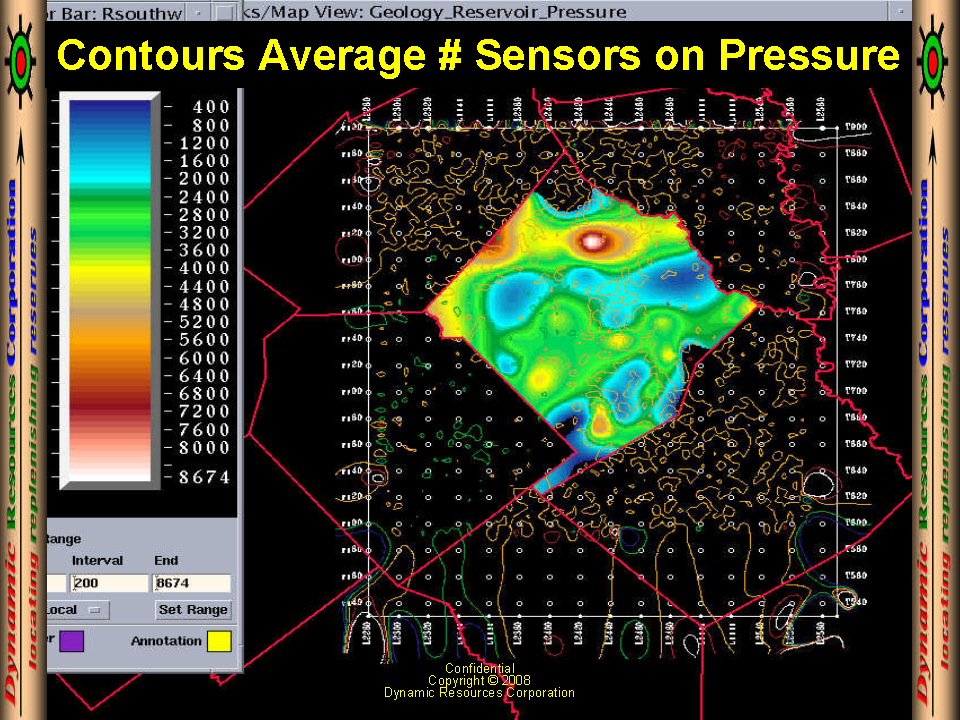
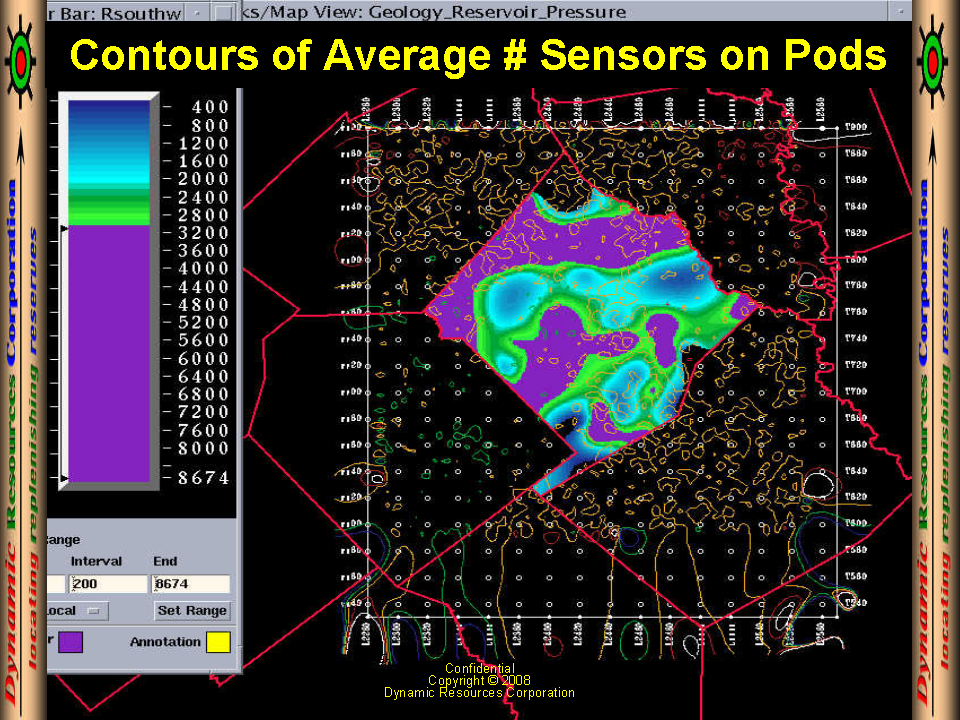
# of Sensors Over Pressure | # of Sensors Over Pods |
 |  |
 |  |
 |  |
 |  |
 |  |
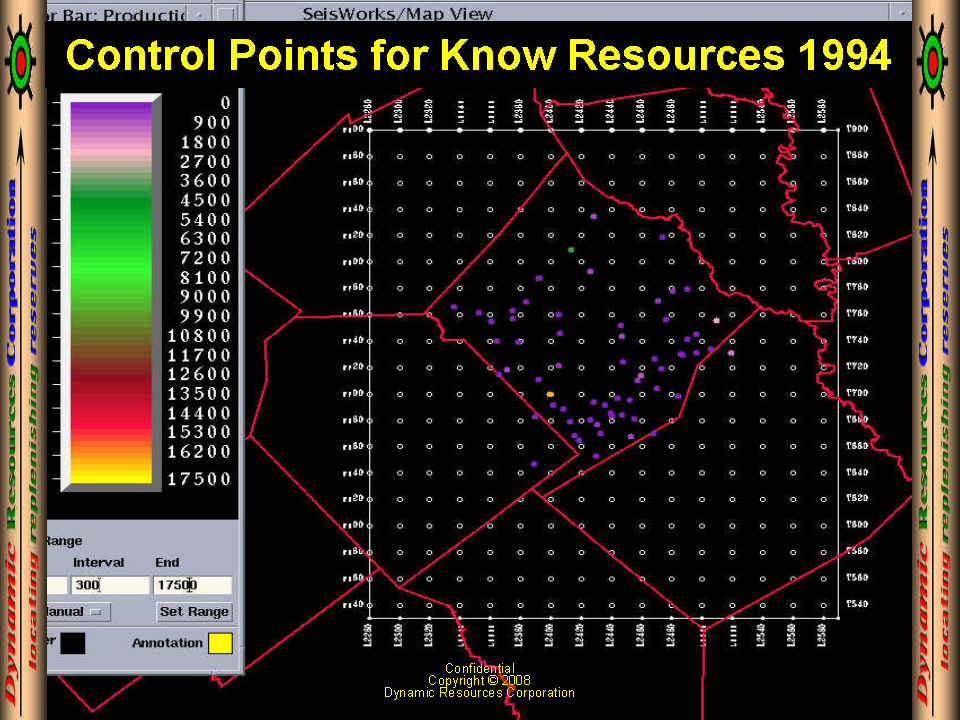
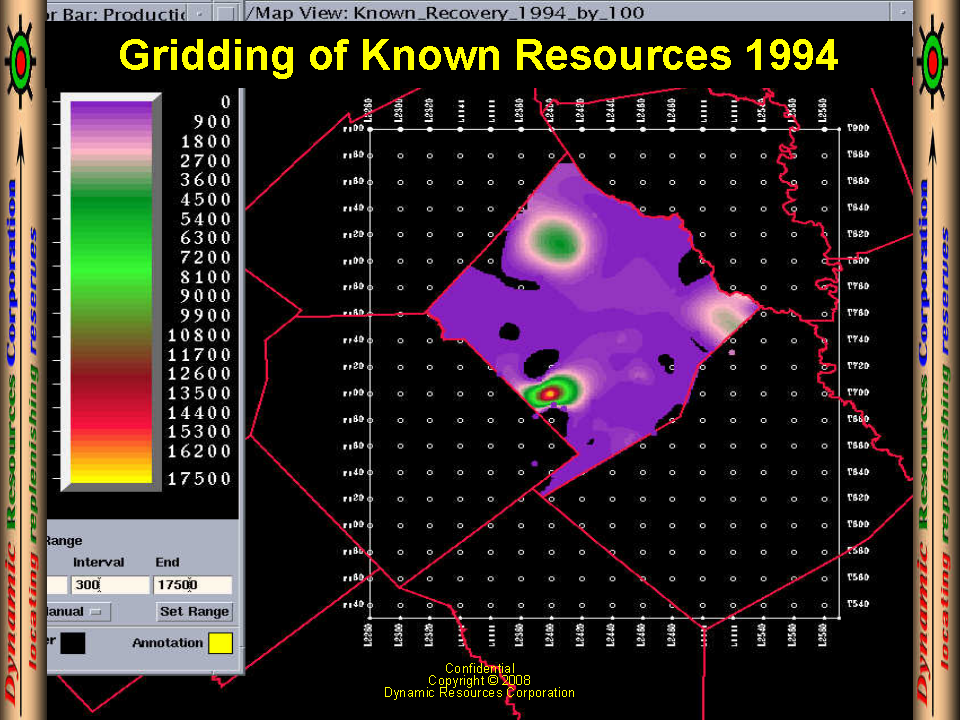
| Control Points 1994 Known Resources | Gridding of 1994 Known Resources Colorado County |
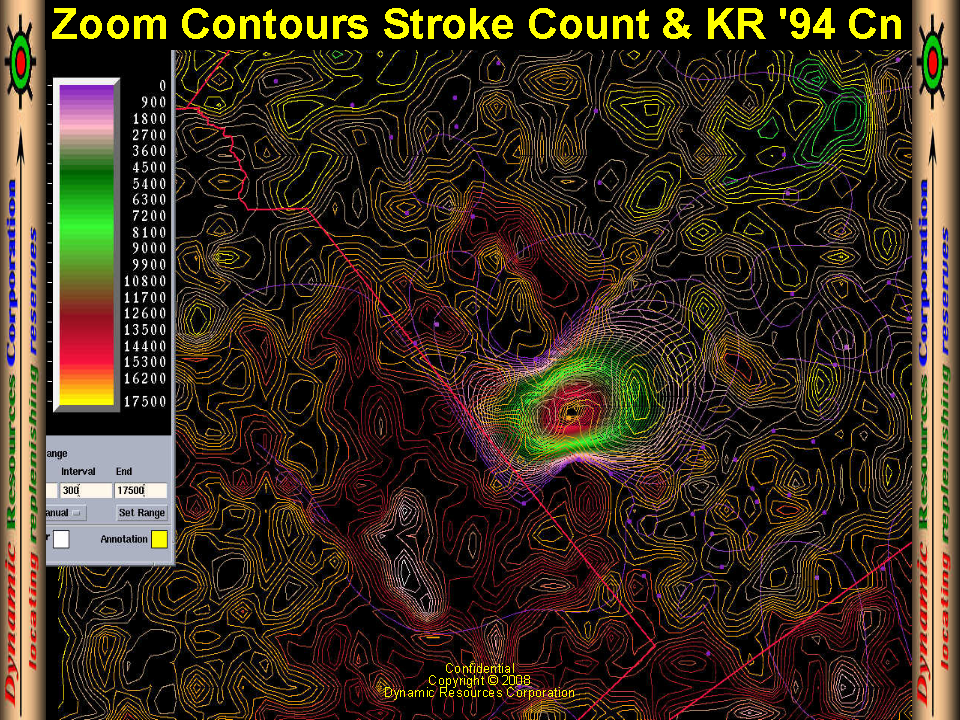
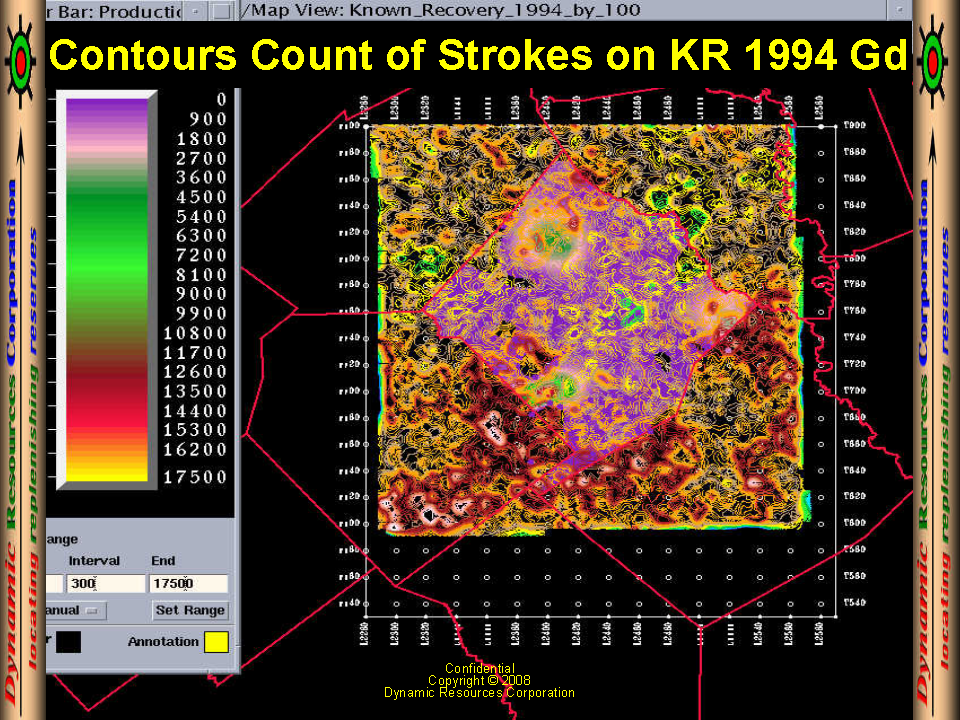
Zoom Strokes + 1994 Known Resources | Stroke Count on Grid of 1994 Known Resources |
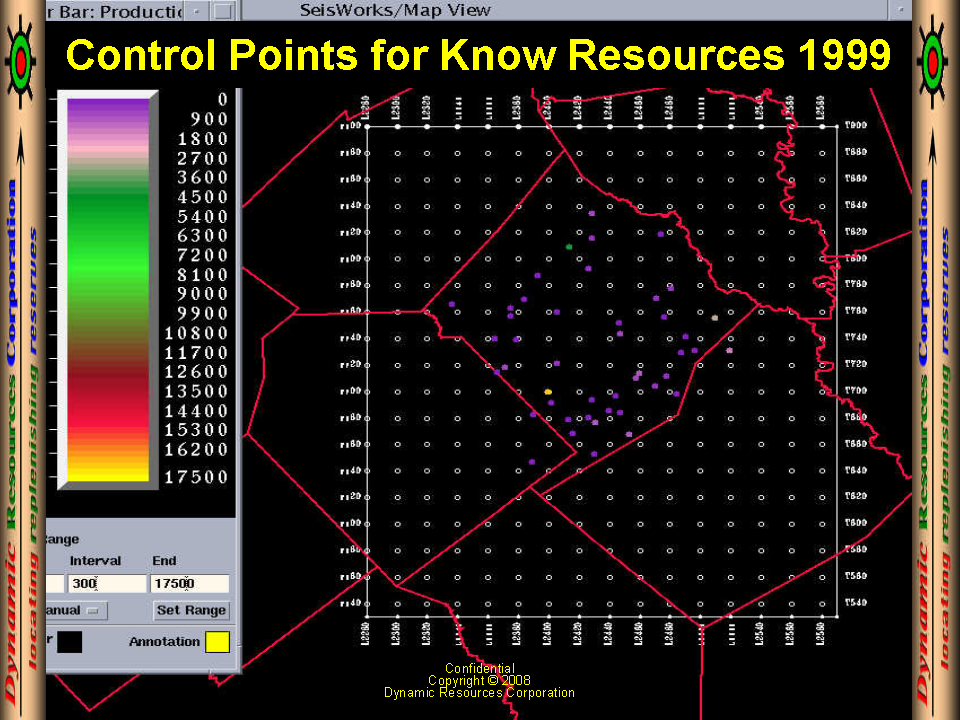
Zoom Strokes on Grid 1994 Known Resources | Control Points 1999 Known Resources |
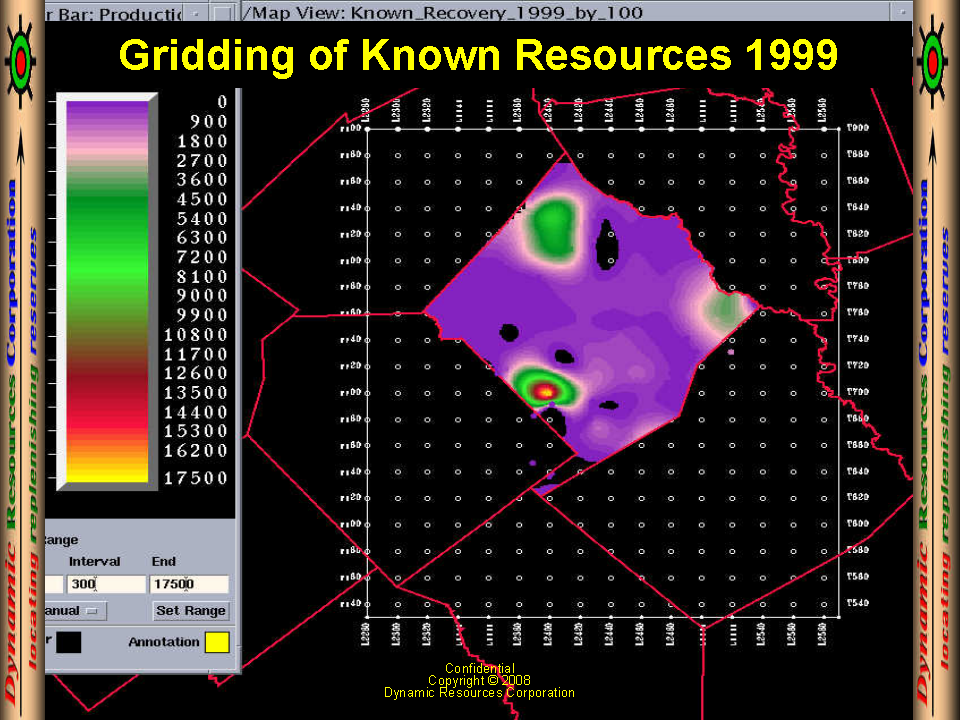
Gridding of 1999 Known Resources Colorado County | Zoom Strokes + 1999 Known Resources |
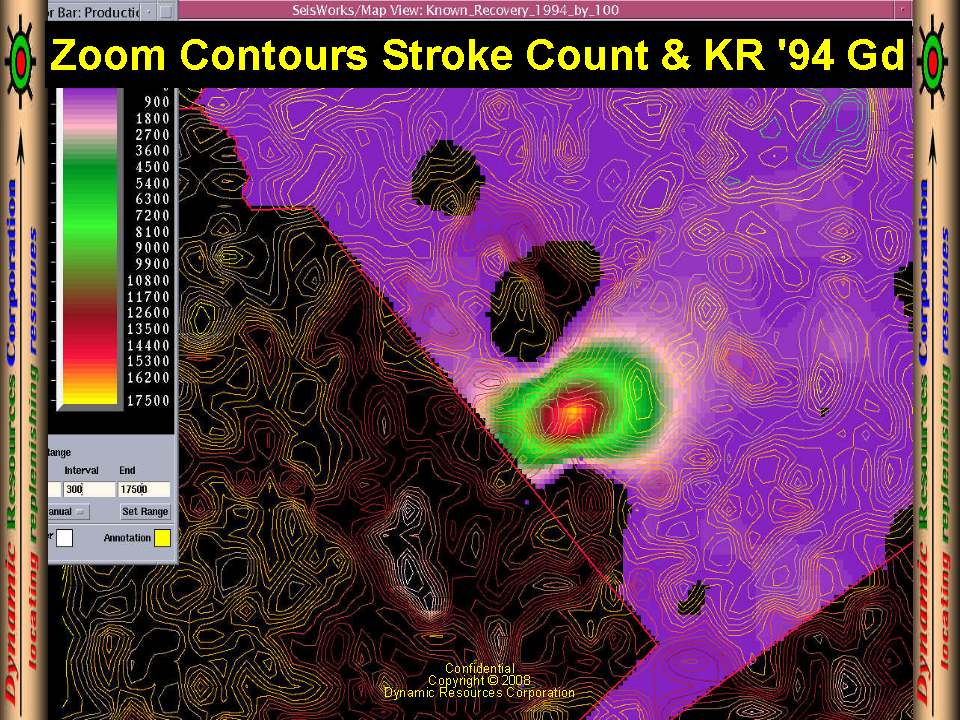
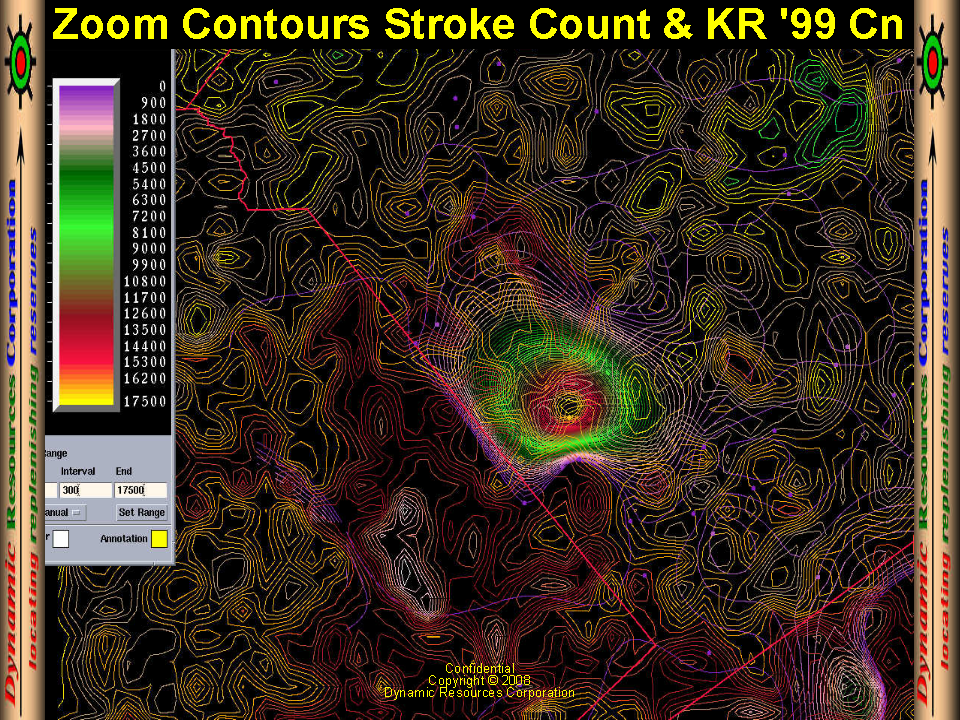
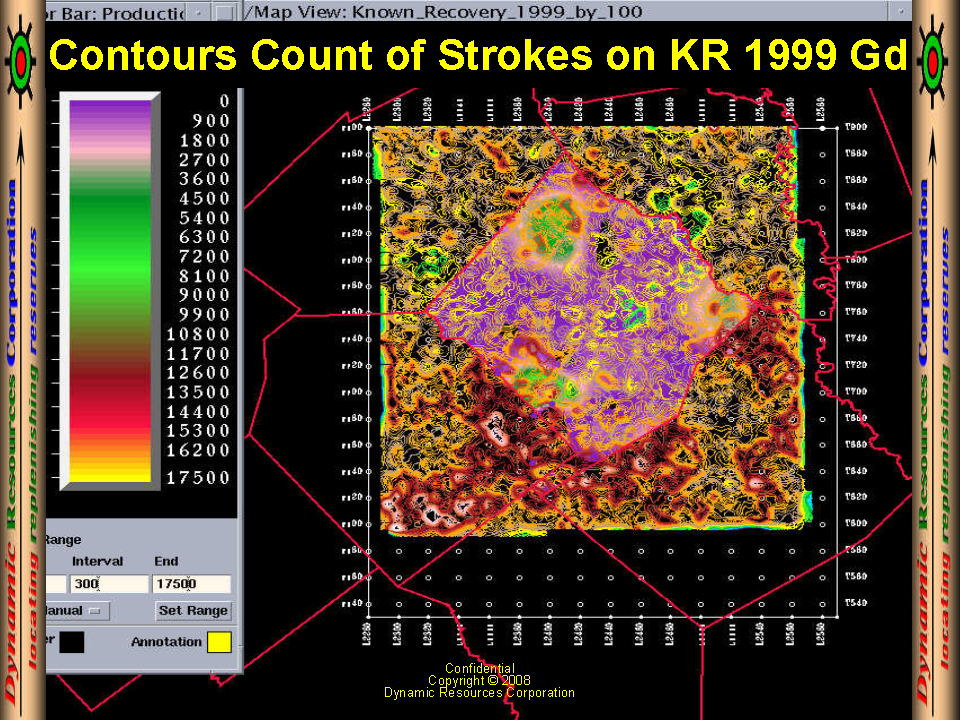
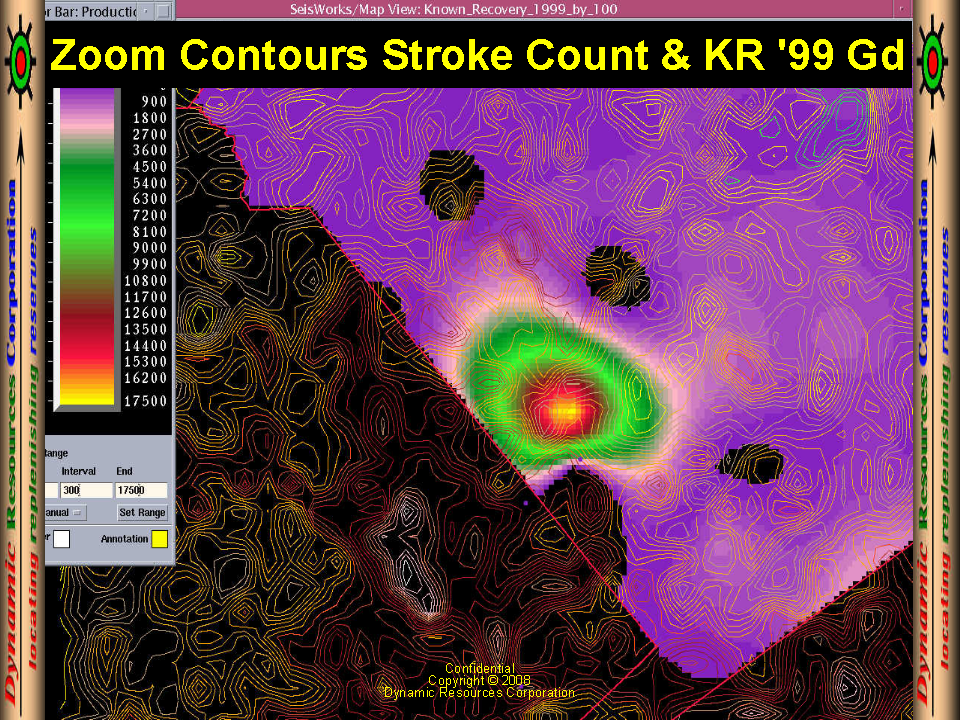
Stroke Count on Grid of 1999 Known Resources | Zoom Strokes on Grid 1999 Known Resources |
 |  |
 |  |
 |  |
 |  |
 |  |
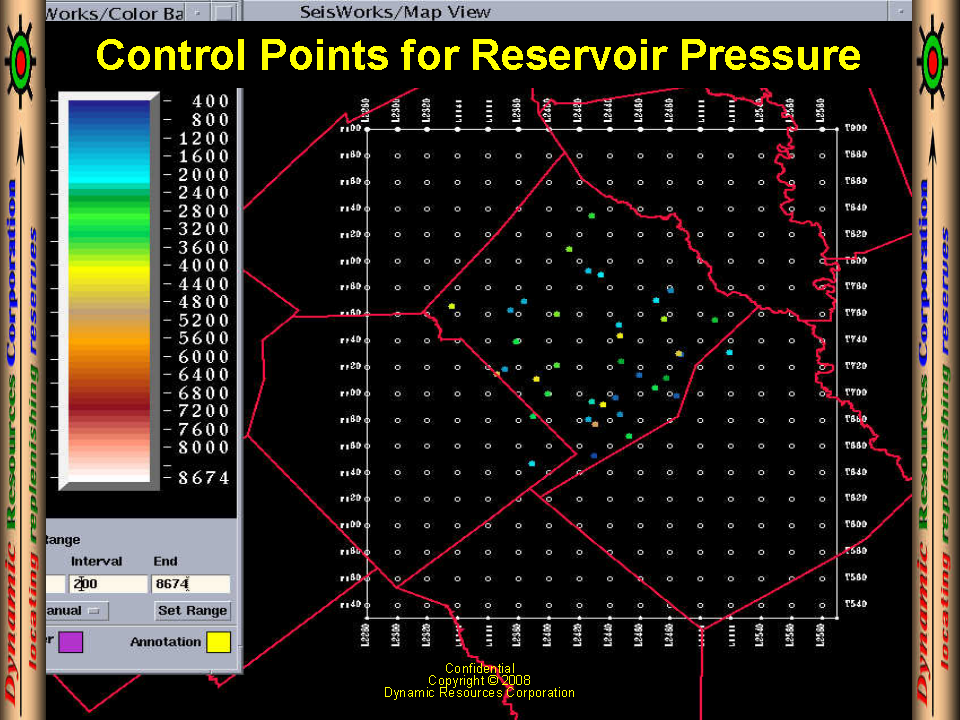
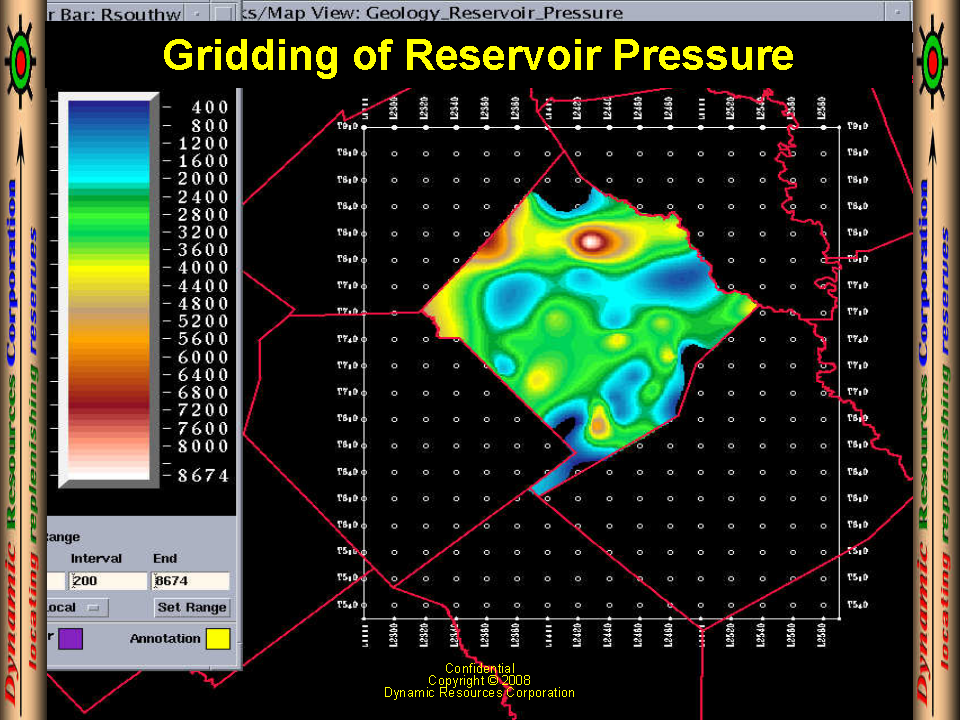
| Control Points for Reservior Pressure | Gidding of Reservoir Pressure |
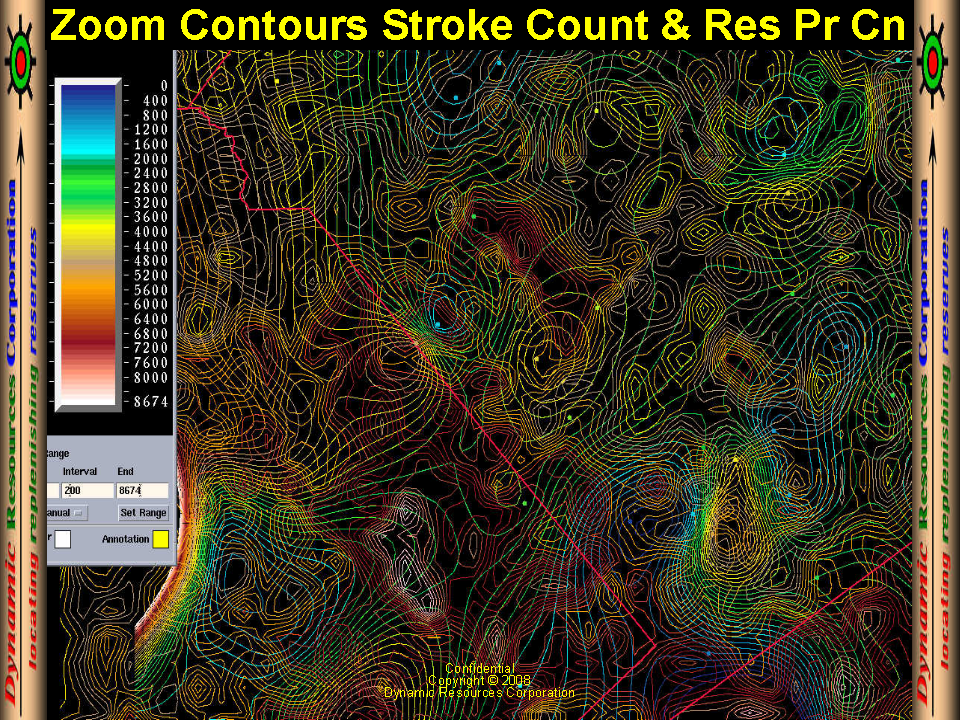
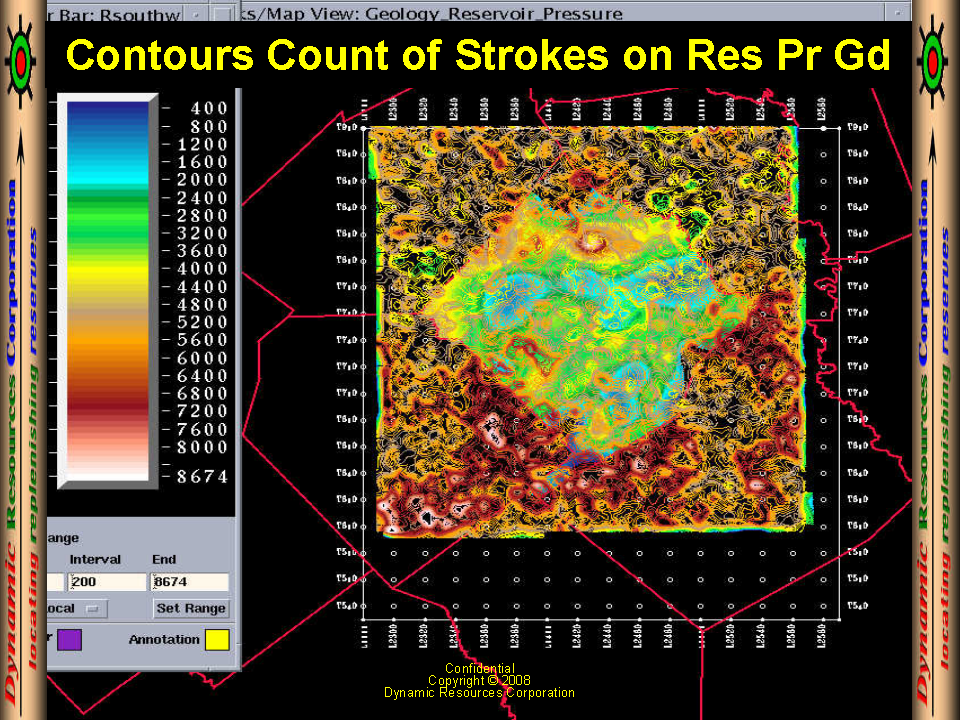
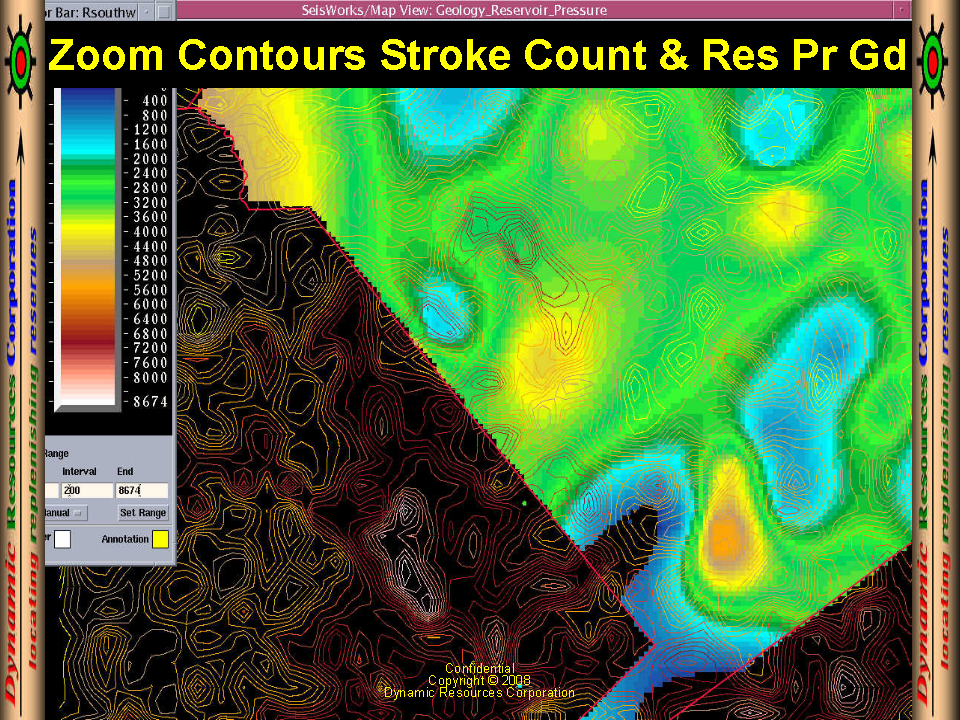
Zoom Strokes & Reservoir Pressure Count | Stroke Count & Reservoir Pressure Grid |
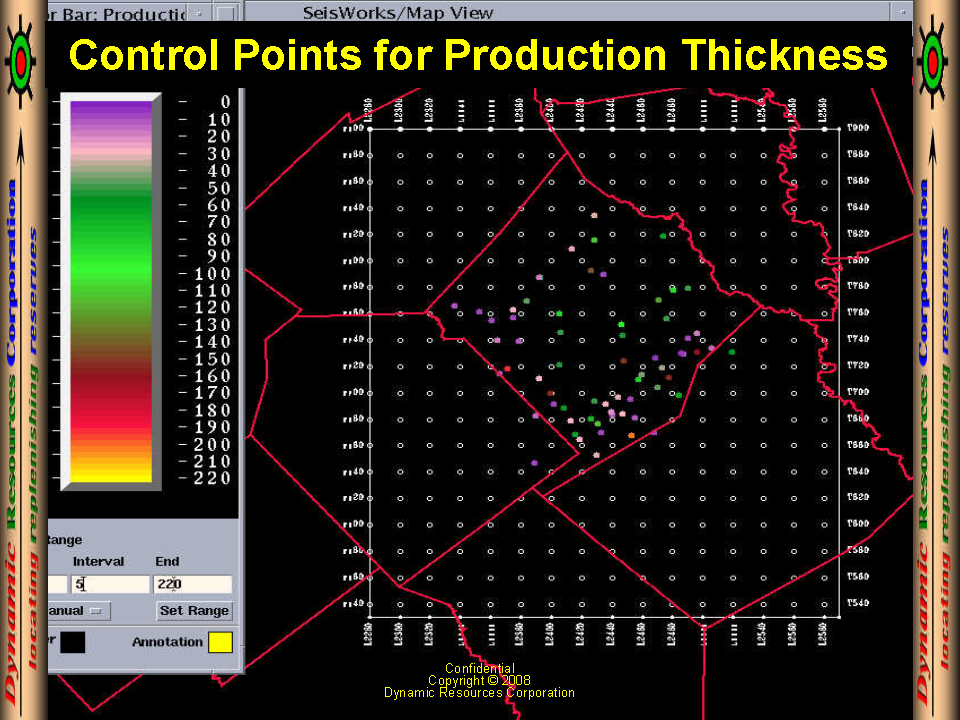
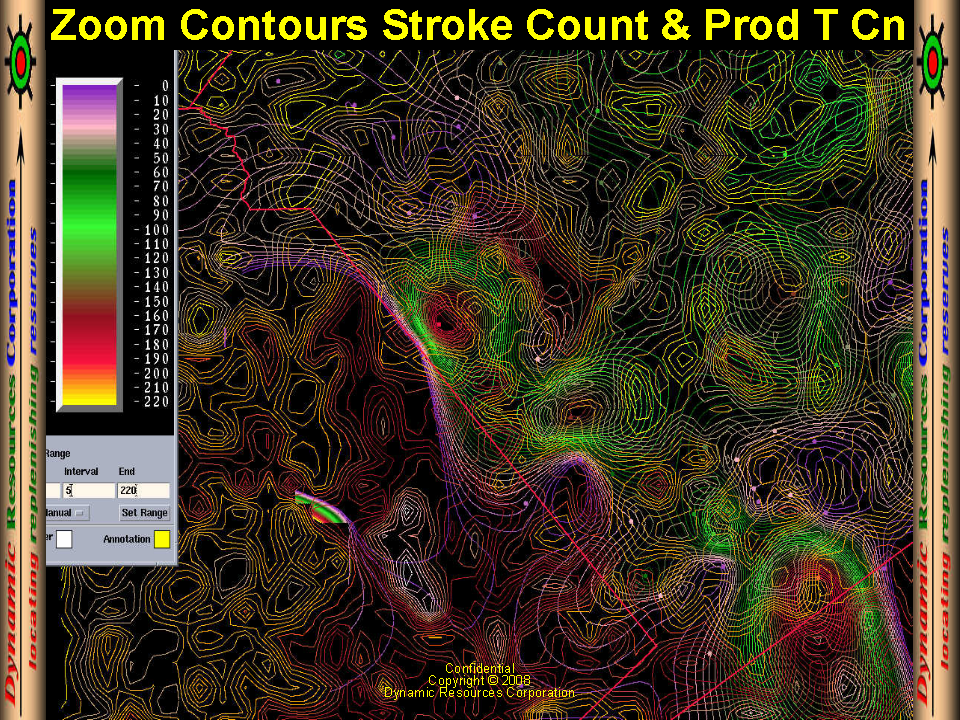
Zoom Strokes & Reservoir Pressure Grid | Control Points for Production Thickness |
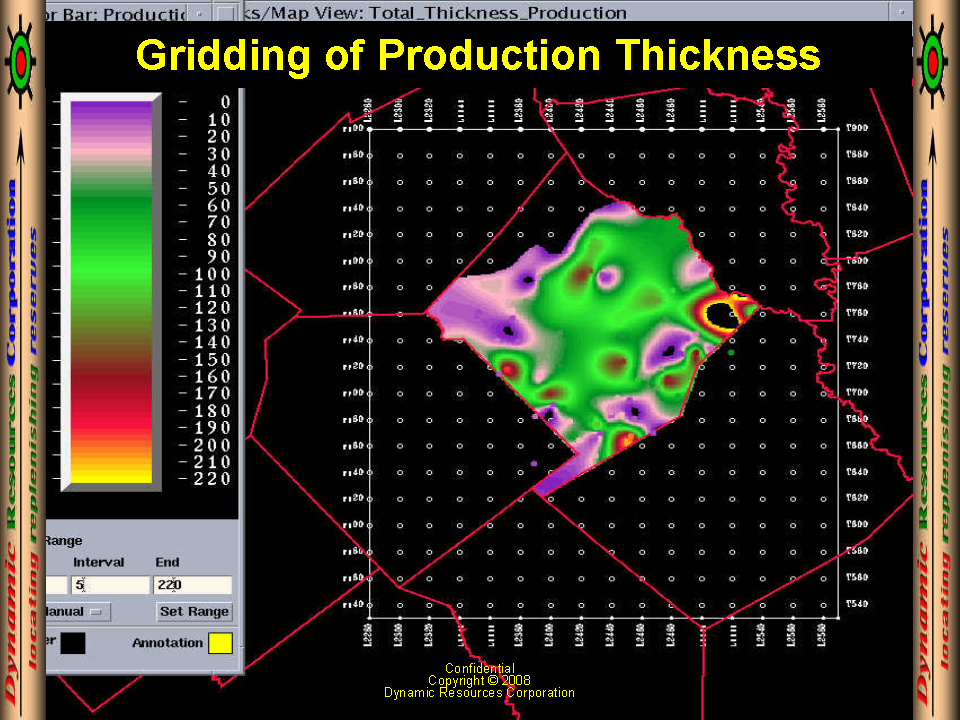
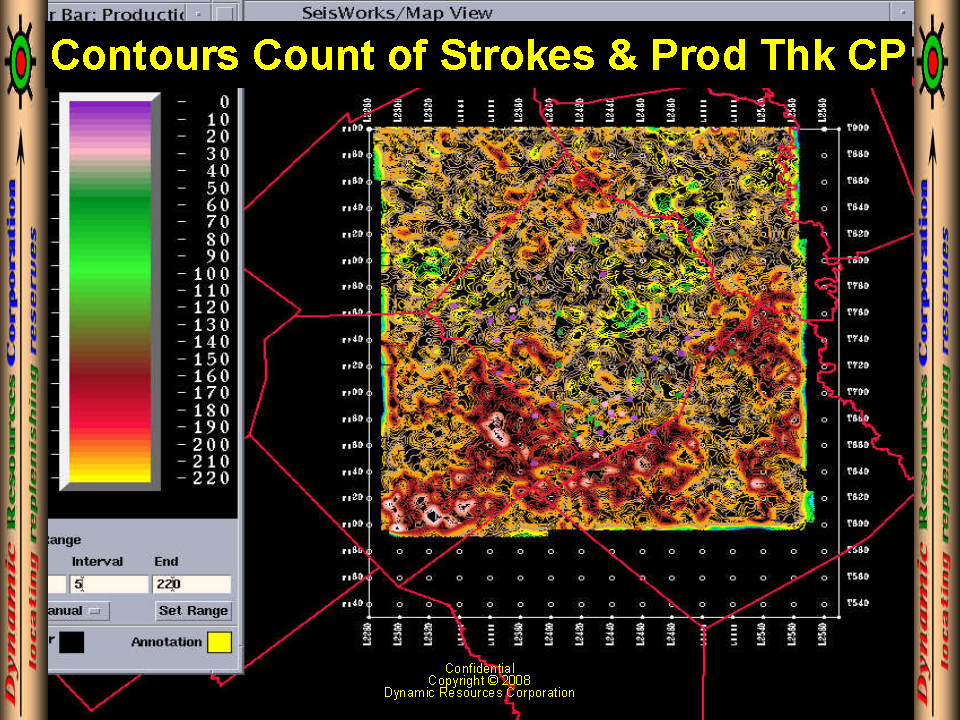
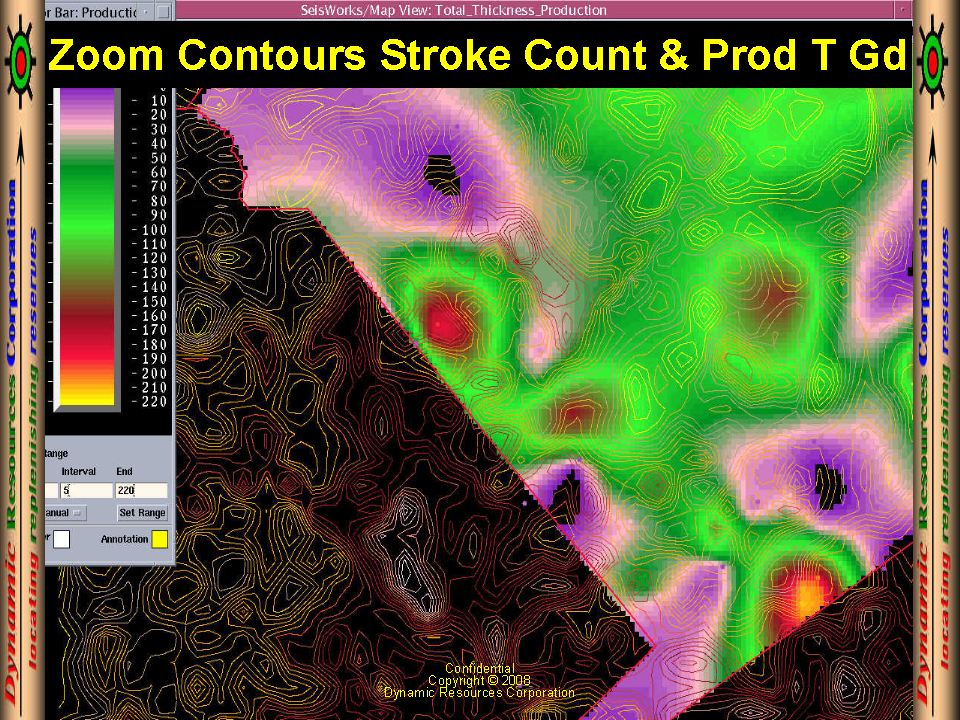
Gridding of Production Thickness | Stroke Count and Production Thickness Control |
Zoom Strokes & Production Thickness | Zoom Strokes & Production Thickness Grid |
 |  |
 |  |
 |  |
 |  |
 |  |
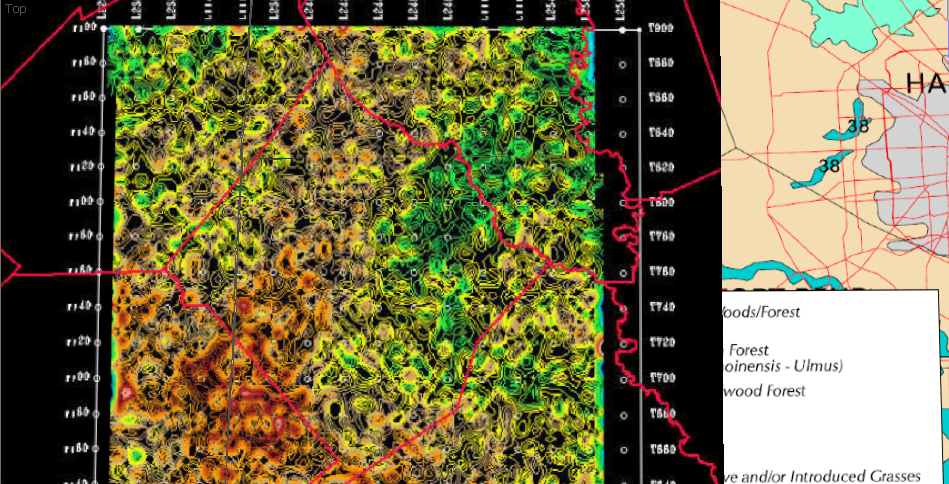
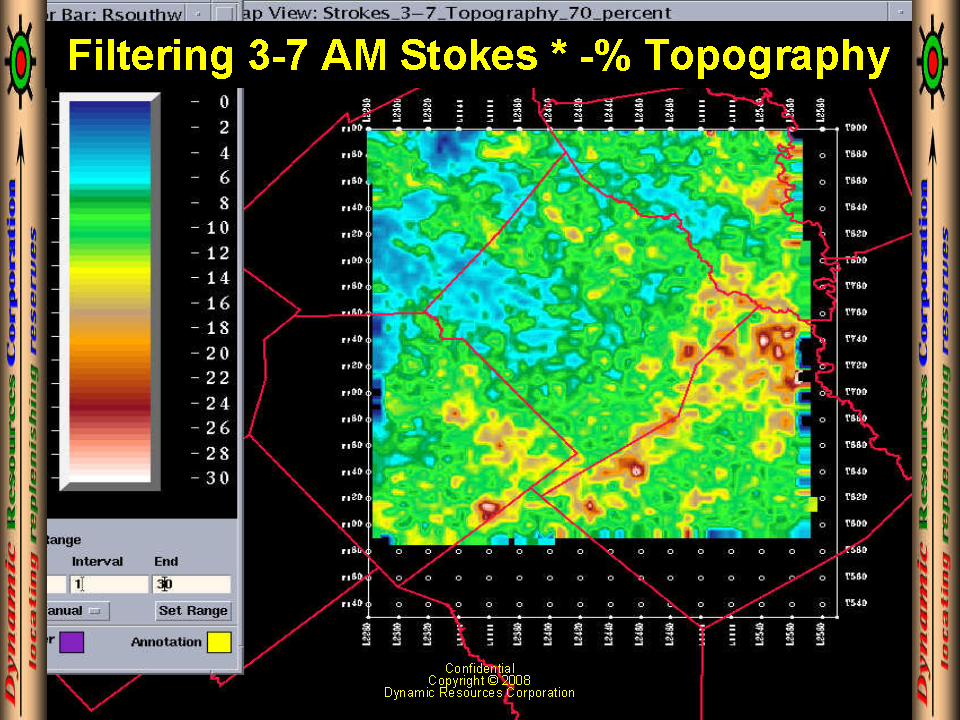
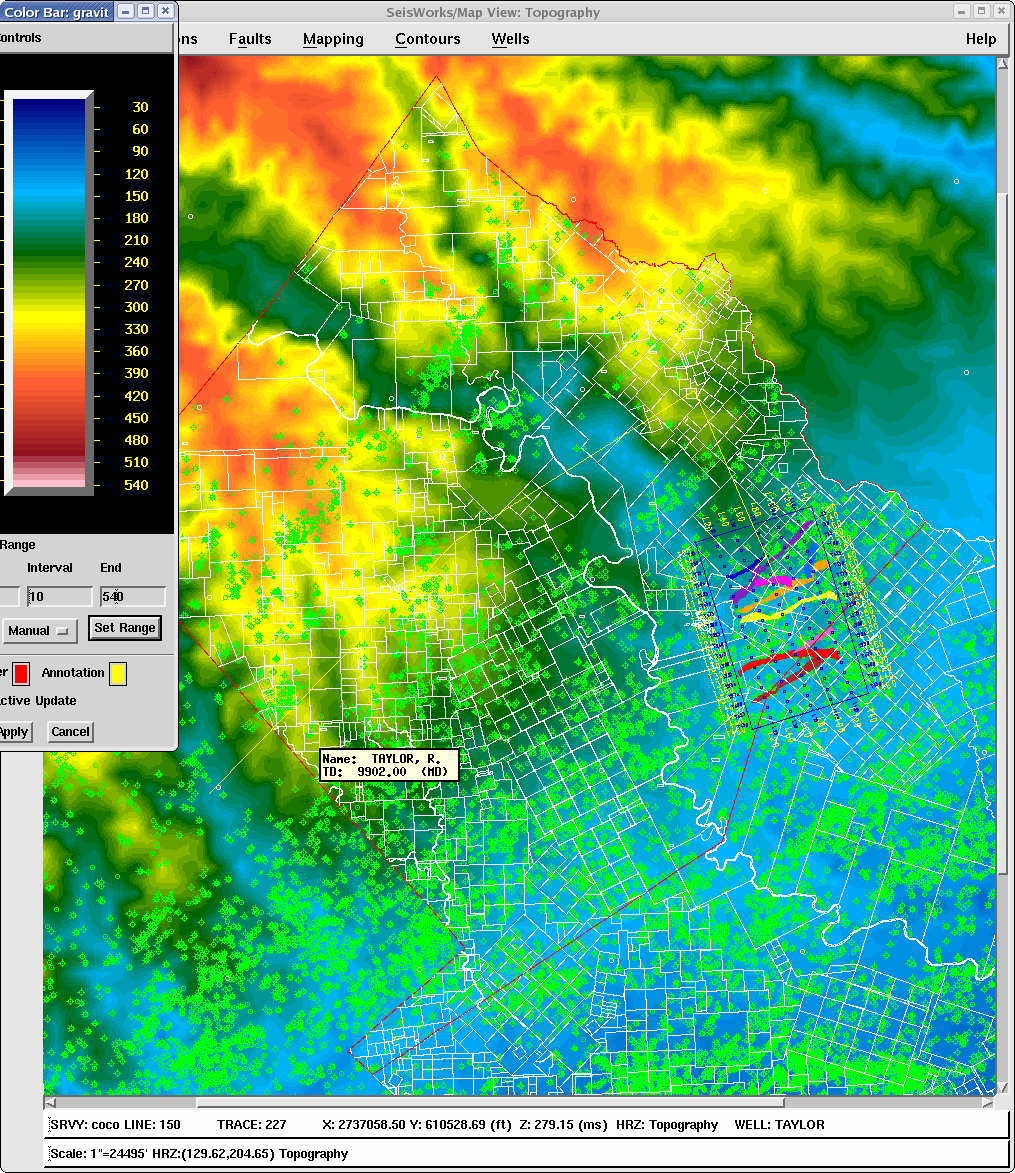
| Topography Colorado County | Filter 3-7 AM Strokes * % Topography |
Topography Colorado County Cropped | Topography Colorado County + Wells + Faults |
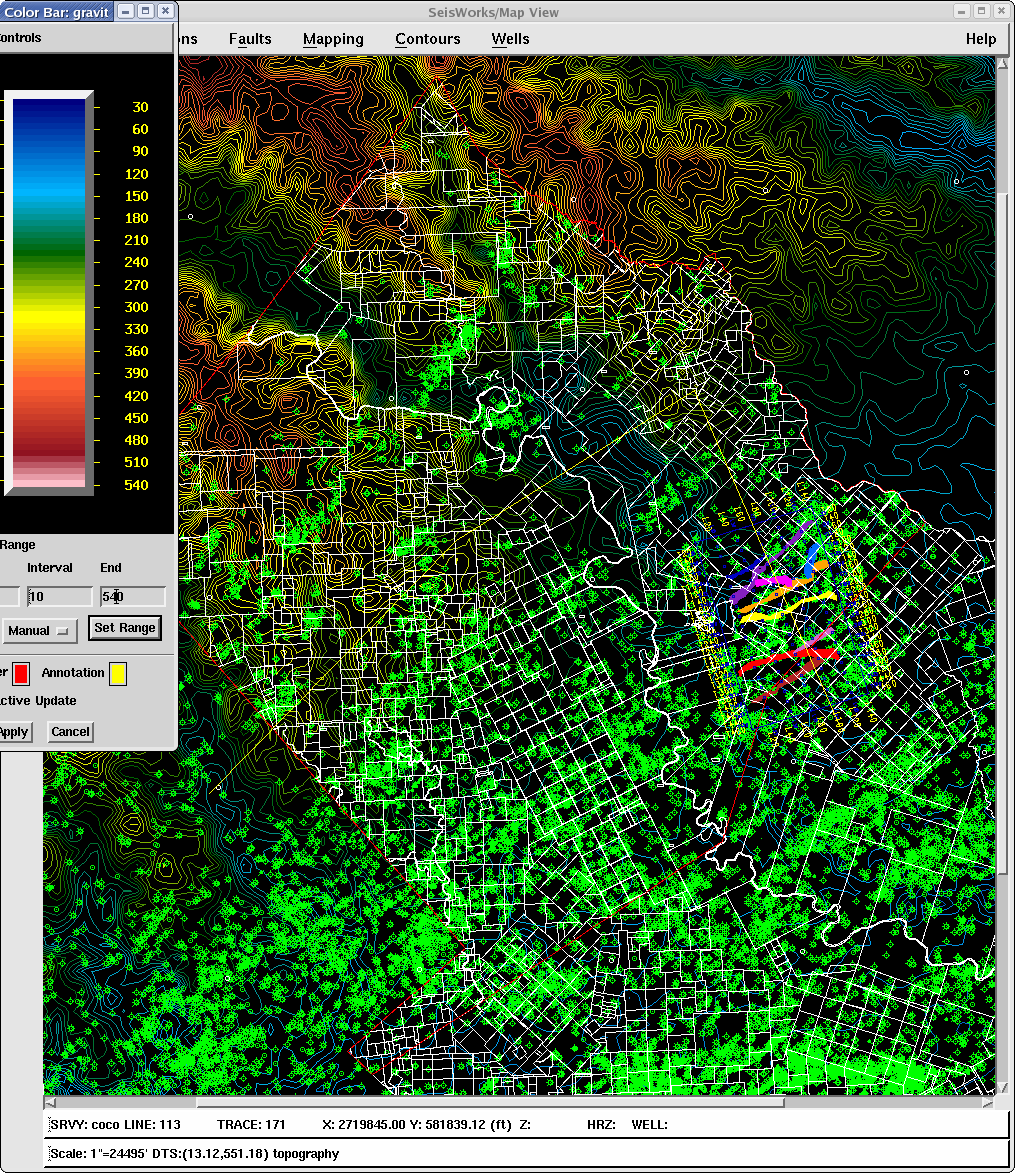
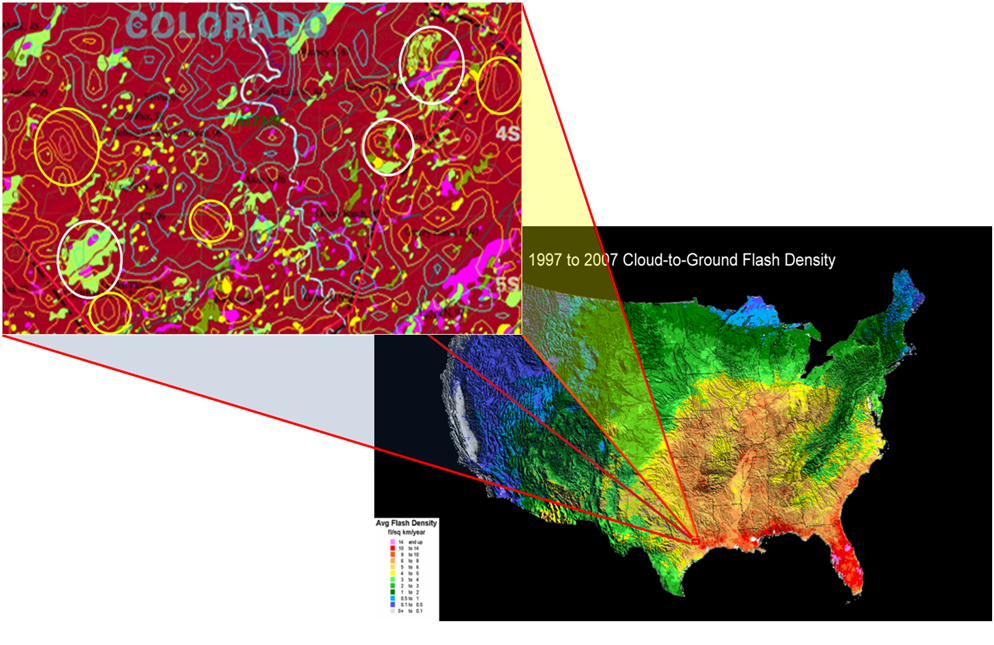
Topo Contours Colorado County + Wells + Faults | Colorado County Opportunities and NLDN |
Eugene Island 330 Dynamic Replenishment | Onshore Texas Geopressure Pods Example |
Louisiana Shelf Geopressure Pods Example | Background Image Missouri Rainbow |