Case Studies
Our Dynamic Natural Source Electromagnetic Method (D.NSEMSM) lightning analysis, unlike a 3-D seismic survey, is as easy to do in a big city as anywhere else. A typical project of 100 square miles has over 1 million lighting strikes. The figures below show a shallow high apparent resistivity anomaly, probably natural gas, inside Beltway-8 in northwest Houston. This project data is from the 18 years of lightning strike data that Dynamic Measurement has an exclusive license to for natural resource exploration.
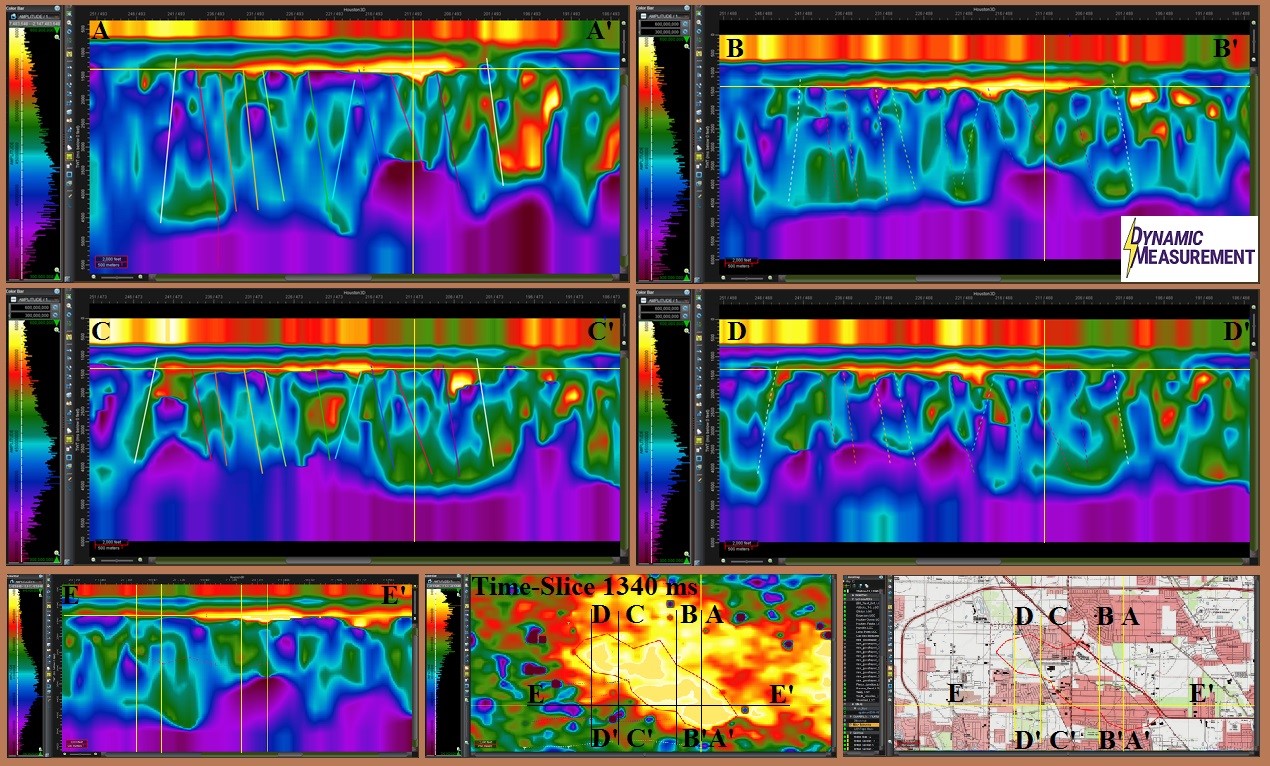
D.NSEMSM enables creation of rock property and lightning attribute volumes and sections. The top 4 images are cross-line sections from north-to-south through the lightning derived apparent resistivity volume. The bottom row includes an in-line section from west-to-east, a time-slice at 1340 ms, and a GIS map of the area on the right (with an outline of the extent of the high resistivity anomaly). These displays were made using Landmark Graphics’ DecisionSpaceTM software. Note the higher conductivity (blue), pinches out over the anomaly from north-to-south and from west-to-east. Also note the high resistivity anomaly (yellow) pinches out in all four directions. The fault interpretation interpolates nicely, as shown by the dashed fault lines on cross-line sections B-B’ and D-D’.
D.NSEM derived maps, sections, and volumes can be interpolated to match available 2-D or 3-D seismic, EM (Electromagnetic), air mag, or other geophysical or geological data. D.NSEM lightning analysis is quicker, less expensive, and safer than any other available geophysical technique. At Dynamic Measurement, we create maps and volumes for a lightning analysis project anyplace in the world. These maps and volumes can easily be loaded on any geophysical workstation, with project turn-around of less than two months.