Latest Radio Interview with Founder Roice Nelson
Click HERE to listen to an exclusive interview with founder H. Roice Nelson, Jr. on the Empire Broadcasting Network.
Click HERE to listen to an exclusive interview with founder H. Roice Nelson, Jr. on the Empire Broadcasting Network.
Click HERE to read about our newest patent for determining geological surface and subsurface resistivity.
Click HERE to read the news on our team winning the Gulf Coast Association of Geological Societies award for a second time.
Click HERE to read the full article regarding prospects in Houston, TX, where lightning derived volumes were found within the city limits.
Click HERE to see the full article and learn about the interesting frequency and effects of lightning in Cedar City, Utah.
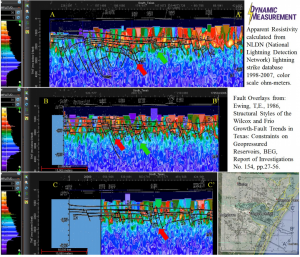
Calculation of apparent resistivity maps and volumes from lightning databases provides new ways for remote geologic mapping and interpretation. The above images hint at the interpretation potential of lightning derived rock property volumes. These three images are from some recent calibration work by Kathy Haggar, a Dynamic Measurement Geologist, and Dustin Northrup, a Dynamic Measurement Intern at Brigham Young University. Seismic controlled fault cross-sections published by Tom Ewing in 1986 were overlain on apparent resistivity cross-sections from about the same locations. The red and green faults were correlated between cross-sections on maps from the same publication. The patterns in the apparent resistivity cross-sections match fault cuts on the Ewing fault cross-section.
Lightning can be described mathematically as a relaxation oscillator (Abraham, H.; E. Bloch (1919), “Measurement of the periods of high frequency electrical oscillations,” Annales de Physique. Paris: Société Française de Physique, 9 (1): 237–302). Neon tube relaxation oscillators and lightning have two alternating processes, and each of these processes is on a different time scale. First, a long relaxation period when the system approaches equilibrium. This alternates with a short impulsive period in which the equilibrium point shifts as the voltage builds across the capacitor and an insulating gas ionizes, becoming a conductor. The formula describing the discharge of a neon tube can be modified to model the discharge of lightning by adding an additional resistance, R2, between the strike point and the bottom plate of the capacitor. R2 limits the current and can be calculated.
Empirical results to date are excellent. Our Dynamic Natural Sourced Electromagnetic Method (D.NSEMSM) is quicker, less expensive, and safer than any other geophysical technique and has absolutely zero carbon footprint. The Dynamic Measurement team is working to better understand the physics of lightning to better scientifically explain our empirical results. Drop me a note and describe your exploration needs, and our team will propose how D.NSEMSM lightning analysis might benefit your natural resource exploration work. We can create the maps and volumes for a lightning analysis project anyplace in the world, with a project turn-around of less than two months.
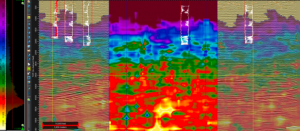 Since 2008 our team at Dynamic Measurement has developed new innovative exploration technologies using lightning strike database analytics. The above image was released for this post by one of our clients – a client who paid less than $70,000 for their second project, a project covering over 75 square miles. The cost for spec seismic for an area this size is about $1,500,000. This image highlights “filling the gap,” where the apparent resistivity cross-section overlay derived from lightning strike data continues between two seismic sections.
The apparent resistivity SEG-Y volume was generated from 18 years of data stored in the privately owned National Lightning Detection Network (NLDN) lightning database (see Using Lightning for Exploration by Les Denham). The rock property volume was loaded into Landmark’s DecisionSpace software and overlaid on the seismic as if it were a seismic velocity volume.
Obviously the lightning analysis area shown here was larger than the available seismic data. Dynamic Measurement has developed the tools to generate apparent resistivity and apparent permittivity rock property maps and volumes. Dynamic routinely generates 21 other lightning attribute maps and volumes and can interpolate any of these 23 volumes to the same trace spacing as any existing or planned 2-D or 3-D seismic survey anyplace in the continental U.S. or Canada, including off-shore out to about 300 foot water depths. This new exploration technology allows density, apparent resistivity and permittivity, rise-time, average and positive and negative peak current, peak-tozero, symmetry, total wavelet time, and 11 other lightning attribute derived volumes to be integrated with seismic, air mag, EM, or other geophysical surveys (see Geologic Frameworks derived from Lightning Maps and Resistivity Volumes). Integration occurs using any available geological or geophysical workstation to load data in SEG-Y or in ASCII voxel format. In addition, Dynamic has demonstrated generating 10 lightning attribute maps and volumes from the GLD-360 database in the U.S., and this process can cover any area in the world, out to the shelf break.
Dynamic Measurement has a U.S. patent and an exclusive license to sublicense this lightning database for natural resource exploration. The company also sublicenses the 5 years of data in the GLD-360 lightning database. Although the GLD-360 database has fewer attributes and less resolution than the NLDN, data includes lightning strike information worldwide. Our team continues working to validate and calibrate empirical results with known geophysical and geological control. We have done over 20 projects from Arizona to Louisiana and Florida and from Texas to Michigan and New York. Each project correlates with available control and known geology. We are unravelling the theory, including how lighting energy is transferred to the telluric currents measured by established magneto-telluric methods. Empirical results to date are extremely promising.
The Dynamic Measurement Method of lightning analysis is quicker, less expensive, and safer than any other geophysical technique. Drop me a note and describe your exploration needs, and our team will propose how the Dynamic Measurement Method of lightning analysis might benefit your work. We can create the maps and volumes for a lightning analysis project anyplace in the world within two months from existing evergreen databases.